Detect Hot Spots
The Hot Spots view can be a good starting point to investigate potential risk areas. You will see at once, where are the most complex methods with the less coverage.
To deal with project risks, dotCover introduces the risk metric, which is calculated for each method as follows:
Risk(m) = comp(m)^2 * (1 – cov(m)/100)^3 + comp(m)
Where:
m— methodcomp(m)— cyclomatic complexity of the methodcov(m)— test coverage of the method by unit tests
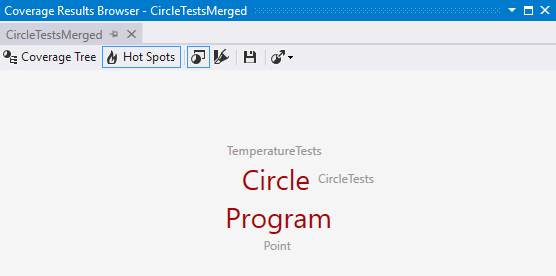
Using the calculated risk metrics, Hot Spots view builds a graphical presentation of the risk areas within the current coverage snapshot, where the types that have methods with the biggest risk metric are shown with a proportionally large font size.
To toggle the Hot Spots view, click Hot Spots ![]() in the top right of the Coverage Results Browser window or in the Unit Test Coverage window:
in the top right of the Coverage Results Browser window or in the Unit Test Coverage window:

If the currently opened snapshot corresponds to the current solution, you can navigate to types by clicking on them.
The context menu of each item allows you to locate it in the coverage tree view and to exclude it from the current snapshot presentation.