Compare Snapshots
There are two ways of comparing snapshots in dotMemory:
Each of the ways is better suitable for a particular use case.
Compare snapshots within one workspace
Comparing snapshots taken within one session is a useful technique that gives a direct answer to a question "What objects cause a memory leak in my app?" The idea behind comparing snapshots is quite simple: you take two snapshots, one of which is used as a basis for comparison (it is always the one that was taken earlier).
The Comparison view provides details on how many objects were created between snapshots and how many objects were collected. If a class shouldn't have new instances, but it does, then it is, probably, the cause of the leak.
To compare two snapshots within a workspace
Start the profiling session and collect at least two snapshots. After the profiling session is finished, dotMemory will open the Analysis Overview page.

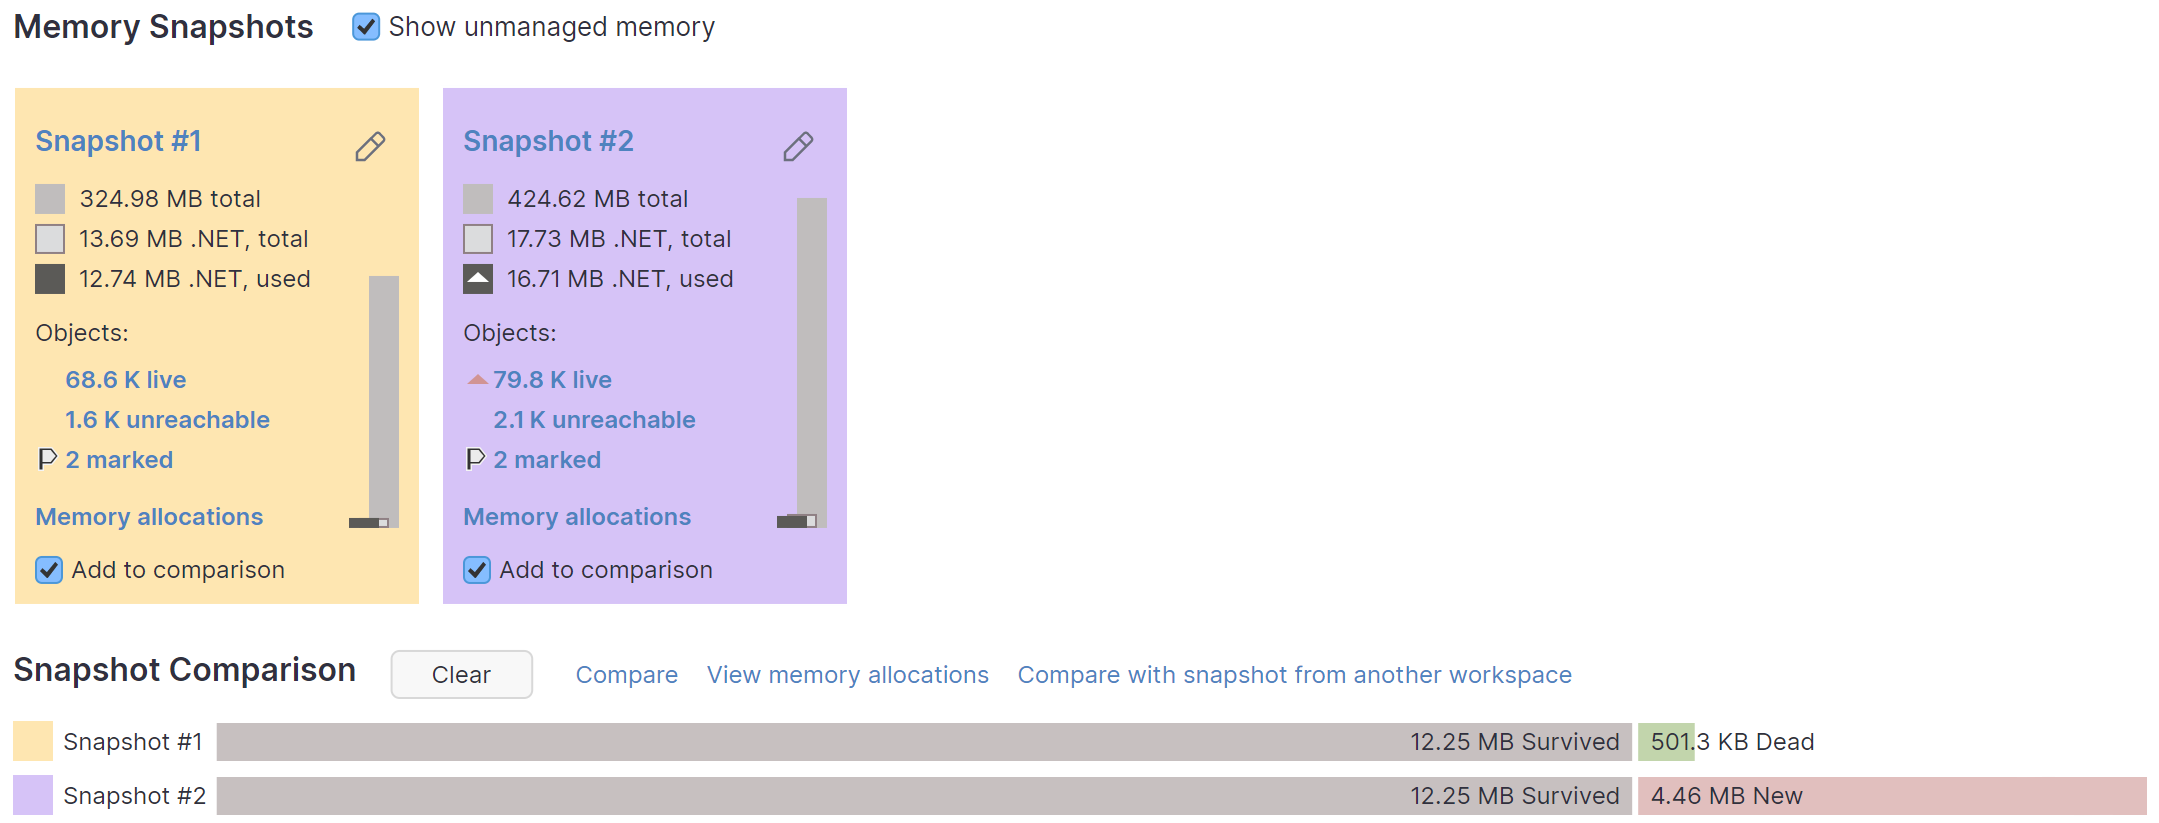
Drag two snapshots you want to compare to the Comparison area or click Add to comparison for each snapshot.
Click Compare in the comparison area.
After this, dotMemory will open the Comparison view for the snapshots.
Using the Comparison view, analyze the comparison data.
Compare snapshots from different workspaces
Sometimes it may be useful to compare memory snapshots taken in different profiling sessions. For example, when you need to understand how particular code changes affect application memory usage.
To compare two snapshots from different workspaces
Start the profiling session and collect at least two snapshots or open a workspace that contains a snapshot you want to compare. dotMemory will open the Analysis Overview page.
Click Compare with snapshot from another workspace in the comparison area.
In the opened Cross-workspace comparison | Snapshots selection view in Current Workspace area, select a snapshot from the current workspace. It will be used as a comparison basis.
In the Workspaces for Comparison area, select a snapshot that you want to compare.
Click Compare on the right.
Using the Cross-workspace comparison view, analyze the comparison data.