Controlling Profiling Session Through API
The dotMemory API lets you control profiling directly from the code of the profiled application. By using API classes, you can configure profiling options and get memory snapshots right from your application.
For examples on how to use API, refer toAPI Usage Examples. For detailed information about API classes, refer toAPI Reference.
When to use the API
There are two main scenarios that require using the profiling API:
- Profiling a specific part of the code
API allows you to profile only a specific part of the code. Typically, if your app is quite huge, you don't need to profile it entirely. The main point of your interest is memory issues in a certain module, memory usage of a particular method, and so on. - Self-profiled applications
API allows you to initiate profiling right from the profiled application. This may be convenient when you need to collect memory snapshots on end-user desktops (e.g., for troubleshooting purposes).
Important! To use the self-profiling API you will need to download the Profiling SDK (it is a set of performance and memory profiling APIs).
How the API works
Profiling a specific part of the code
The following list summarizes main API profiling concepts:
- To control the profiling process, the API uses the static
MemoryProfilerclass located in the JetBrains.Profiler.Windows.Api.dll assembly. - The
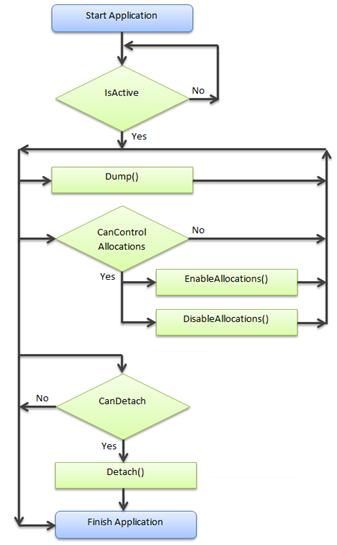
MemoryProfiler.IsActiveproperty is used to determine whether the API is enabled. - To enable the API, you should select the Use profiler API check box in the Profiler Configuration dialog.
-
MemoryProfiler.Dump()initiates snapshot generation and processing. - In case you attach dotMemory to an already running process, you should use
MemoryProfiler.Detach()for detaching from the process in the end of the profiling session.
The API state machine

Self-profiling
The following list summarizes "self-profiling" concepts:
- End-users do not have dotMemory or dotTrace installed; therefore, you must include dotTrace SDK redistributables into your app's installation package.
- As end-users are not supposed to initiate profiling, the self-profiling session is initiated by the API. For this purpose, the API uses the static
SelfAttachclass located in the JetBrains.Profiler.Windows.SelfApi.dll library. - The
Attachmethod prepares profiling configuration and executes the profiler from the "redistributables" folder. - The profiling configuration is defined by one of two classes (instantiated from the
BaseSnapshotProfilingConfigBaseProfilingConfigclasses) passed to theAttachmethod:-
SaveSnapshotProfilingConfig- the resulting snapshot is saved in the designated folder. -
ExecutableSnapshotProfilingConfig- the resulting snapshot is saved in the designated or default folder, the path to the snapshot is passed to an external application as a command line parameter.
-
- The resulting self-profiling snapshot has the
.dmwfile extension.
Last modified: 20 August 2018