Analysis Overview

After you finish with collecting profiling data, dotMemory opens a new tab with the Analysis Overview page.
The Analysis Overview page provides you with information about data collected during the session:
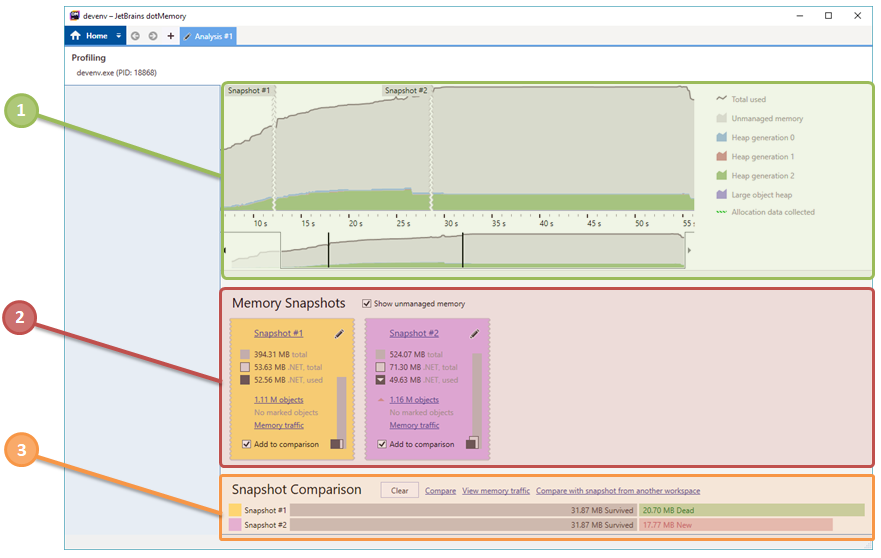
![]() Timeline
Timeline
The timeline graph shows how your app consumed memory during the profiling process. The timeline consists of four charts showing instant sizes of Gen0, Gen1, Gen2 heaps and Large Object Heap. You can also add the chart showing the size of unmanaged memory by selecting the Show unmanaged memory parameter.
![]() Collected snapshots
Collected snapshots

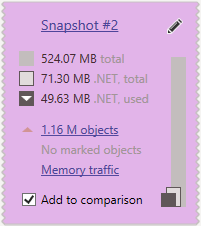
- Get details about the total amount of memory* requested by your app. The total value (grey bar) consists of:
Unmanaged memory: memory allocated outside of the managed heap and not managed by Garbage Collector. Generally, this is the memory required by .NET CLR, dynamic libraries, graphics buffer, and so on. This part of memory cannot be analyzed in the profiler.
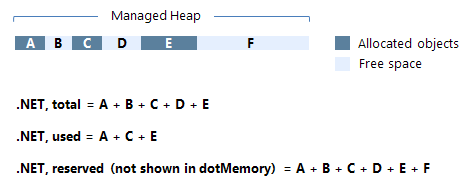
if you clear the Show unmanaged memory check box, the size of unmanaged memory will be subtracted from the total value..NET, total (grey bar with an outline): the amount of memory in the managed heap used by the app including free space between allocated objects. See the image below for more details.
.NET, used (dark grey bar): the amount of memory in the managed heap used by the app excluding free space. This is the only part of memory .NET allows you to work with.

Open a snapshot in the Snapshot view by clicking the snapshot name.
Rename a snapshot using the
 button.
 Open all objects in the heap for analysis (using the [objects size] objects link). In this case, the 'All objects' object set will be opened in the Group by Types view.
Open marked objects for analysis (using the Marked objects link). The 'Marked objects' object set will be opened in the Group by Types view. Learn more about marking objects in the section Marking an Instance.
View memory traffic (using the Memory traffic link) generated by the app from the start of the profiling session to the moment of getting a snapshot. Learn more about analyzing traffic in the section Analyzing Traffic.
To compare two snapshots drag and drop them to the Comparison area or click Add to comparison for each snapshot. Learn more about how to compare snapshots in the section Comparing Snapshots.