Profile Web Application on IIS Server
Typically, determining performance issues in a web application is required when the application is already running on a server. The table summarizes all possible options of profiling the application:
Pros | Features | |
|---|---|---|
|
| |
|
| |
|
|
Local profiling

Typically, local profiling is used when you need to profile the app that is hosted right on your (developer's) machine or on some testing environment, which doesn't impose any security/performance restrictions.
To locally profile a web app hosted on an IIS server
Install dotMemory on the server.
Run dotMemory as a standalone application. The dotMemory Home window will open.
Add a run configuration - the configuration that tells dotMemory how to run the profiled application:
Under Choose what you want to profile, New Process Run, click
 Add run configuration.
In the New Run Configuration wizard, choose IIS and click Next.
In Open URL, specify the URL of the profiled application. If you do not do this, dotMemory will start profiling of the first running application pool it'll be able to find.
Optionally, in in browser, specify the browser that dotMemory should use to open the URL.
Optionally, in Set environment variables, specify required environment variables. Each variable must be specified on a new line.
Click Save.
Make sure the created run configuration is selected in the New Process Run list.
Under Choose how you want to profile it, specify profiling options:
Collect allocation data: choose between Sampled (approximate data on object size) and Full (accurate data on object count and size). Learn more about data collection
If required, specify other profiling options.
Click Start. This will start the profiling session.
Go through a particular workflow in your application (if you want to check it on potential memory issues) or reproduce a particular memory issue. Collect memory snapshots using the Get Snapshot button. Learn more about how to control the profiling session
After you collect the data, either close the profiled application or detach the profiler using the Detach button.
Profiling via the command-line profiler

The command-line profiler is the best choice if you need to automate profiling, for example, for profiling your application from time to time. Another possible scenario is when you don't have access to the server but some other person does, so you can provide them with profiling tools and a batch file.
How does it work? In short, you copy the command-line profiler to the server and either run the app under profiling (the app pool will be restarted) or attach the tool to the running application pool w3wp.exe. Then you can get snapshots by sending special commands to stdin.
To profile a web app on an IIS server using the command-line profiler
Download the zip archive with the dotMemory.exe tool and copy/unpack it to the server.
Now, you have two options for getting a memory snapshot:
Attach dotMemory.exe to the running application pool and instantly get a snapshot:
dotMemory.exe get-snapshot 1234 --save-to-dir=C:\Snapshotswhere
1234is the process ID of the corresponding w3wp.exe process.Tip: To get the ID, in IIS Manager, open the required server. On Worker Processes page, you will find the list of running workers and their IDs.
Run the application pool under profiling (if the pool is already running, it will be restarted):
dotMemory.exe start-iis --trigger-timer=30s --open-url=localhost/myapp --use-browser=Chromewhere
--open-url=localhost/myappis the URL of your application. In case you've chosen to run the app pool, you cannot instantly get a snapshot. Instead, you should:get a snapshot by condition: for example, when
--trigger-timer=30sis specified, snapshots are taken each 30 sget a snapshot by sending a command to stdin:
##dotMemory["get-snapshot"]get a snapshot on process exit (for example, Recycle app pool in the IIS Manager)
For more information about working with the dotMemory command-line profiler, refer to Use dotMemory Command-Line Profiler.
Copy the resulting snapshot to the computer with installed dotMemory and analyze the snapshot.
Memory dumps

What if, for some reason, copying and running third-party tools on the server is not possible at all. Well, then your last resort is memory dumps. It can be taken with a number of tools, with the two most popular being Task Manager (comes with the operating system) and Process Explorer.
To profile a web app on an IIS server using memory dumps
On the server, take a memory dump using the Task Manager or Process Explorer tool. When creating a dump of a 32-bit application with Task Manager, make sure you use a 32-bit version of the tool that can be found in C:\Windows\SysWOW64\taskmgr.exe.

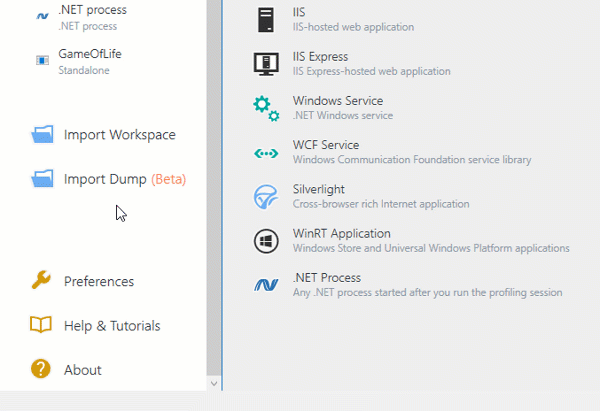
Copy the resulting snapshot to the computer with installed dotMemory and open it using the Import Dump command.