Configure Profiling Session
To configure a profiling session, you should:
Specify how dotMemory should run the application you wish to profile. You can do this with the help of run configurations. If you want to profile an already running application, this step is not required.
If necessary, configure other profiling options and process filters.
1. Create a run configuration
A run configuration is the way to tell dotMemory how it should run the profiled application. For example, a run configuration of a standalone .NET application will include a path to the application executable, command-line arguments, and a path to the application working directory.
If you already have a run configuration for the profiled application, select this run configuration from the New Process Run under Choose what you want to profile. Otherwise, create the run configuration by following the instruction below.
To create a run configuration
Under Choose what you want to profile, New Process Run, click
 Add run configuration.
In the New Run Configuration wizard, choose the application type and provide application options:
Click Save. This will create and save the run configuration. Next time when you need to profile this application, select the created configuration from the New Process Run list.
2. Configure other profiling options
- Collect allocation data
Sampled (default): Compared to the Full data, the Sampled data is less detailed: The snapshot will contain only data on approximate size of allocated objects, there will be no data on object count. The pros of the Sampled mode:
It doesn't slow down the profiled application.
You can use it when attaching the profiler to an already running application.
Full: dotMemory will collect full memory allocation data. This includes correct object size data and data on object count. The cons of the Full mode:
It significantly slows down the profiled application.
You can't use it when the profiler is attached to an already running application.
Important: You can switch the data collection mode anytime during the profiling session using the Allocation data: Sampled | Full switch in the profiling controls.
- How to control profiling
Manually (default): you control the profiling session using the profiling controls. For example, to take a snapshot, you click Get Snapshot.
Using API: you control profiling directly from the code of the profiled application. For example, to take a snapshot in the exact point of your code, you call the
MemoryProfiler.GetSnapshot()function. Learn more about using the API in Controlling Profiling Process Through API.
3. (Optional) Configure process filters
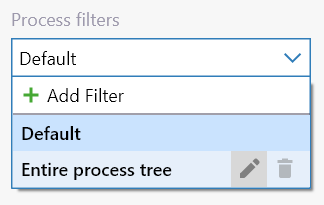
If the profiled application creates a number of processes, use the Process filters setting to specify what processes you want to profile. You can either select a predefined filter or create a new one.
Note that process filters work differently depending on the application type specified in the selected run configuration.
App type | Description |
|---|---|
dotMemory will profile only processes that match the specified filter. The filter is applied to the entire process tree of the profiled process (including child processes). For example, you have a managed process that creates a number of child processes. You want to profile not only the main process but also child processes with | |
In this mode, starting the profiling session doesn't start the profiled process. Instead, dotMemory waits for and attaches to the first managed process started in the operating system. When certain Process filters are selected, dotMemory will attach to the first process that matches the filter. For example, you created the include filter: | |
Process filters aren't applied. |
To select a process filter
Under Choose how you want to profile it, Advanced Options, open the Process filters list.
Select the required filter.
dotMemory provides two predefined filters:
Default: process filter is not applied.
Entire process tree: dotMemory will profile the entire process tree including child processes. In case a .NET Process run configuration is selected, dotMemory will attach to and profile the first managed process started in the system, including all its child processes.

To create a process filter
Under Choose how you want to profile it, Advanced Options, open the Process filters list.
Choose Add Filter.
Specify filter settings:
Name: filter name.
Profile entire process tree: if selected, dotMemory will profile the entire process tree including child processes. Disabling this option makes sense only if you create a filter for the .NET Process run configuration. In this case, dotMemory will wait for and attach to the first process in the system that matches the filter, but it will not profile child processes of this process.
Include filter masks, Exclude filter masks: include and exclude filter masks correspondingly. The masks are applied according to the following rules:
The default policy is 'profile all'.
Include masks are applied first. Exclude masks are applied to the processes filtered by the include masks.
You can use asterisk
*wildcards.
For example, to profile all child processes with
Servicein their name excludingMyService, add the*Service*include mask and theMyServiceexclude mask.
Click Save.