Blocking profiler
Blocking profiler shows you the time period in which goroutines are not running (waiting). The blocking profiler might be useful if you need to find unbuffered or full channels, sync.Mutex locks, or any other bottlenecks.
Run Blocking profiling
Open the _test.go file. Near the function or method that you want to profile, click the Run Application icon (![]() ) in the gutter area and select Run with 'Blocking Profiler' <configuration_name>.
) in the gutter area and select Run with 'Blocking Profiler' <configuration_name>.
Interpreting the results
- Flame Chart
-
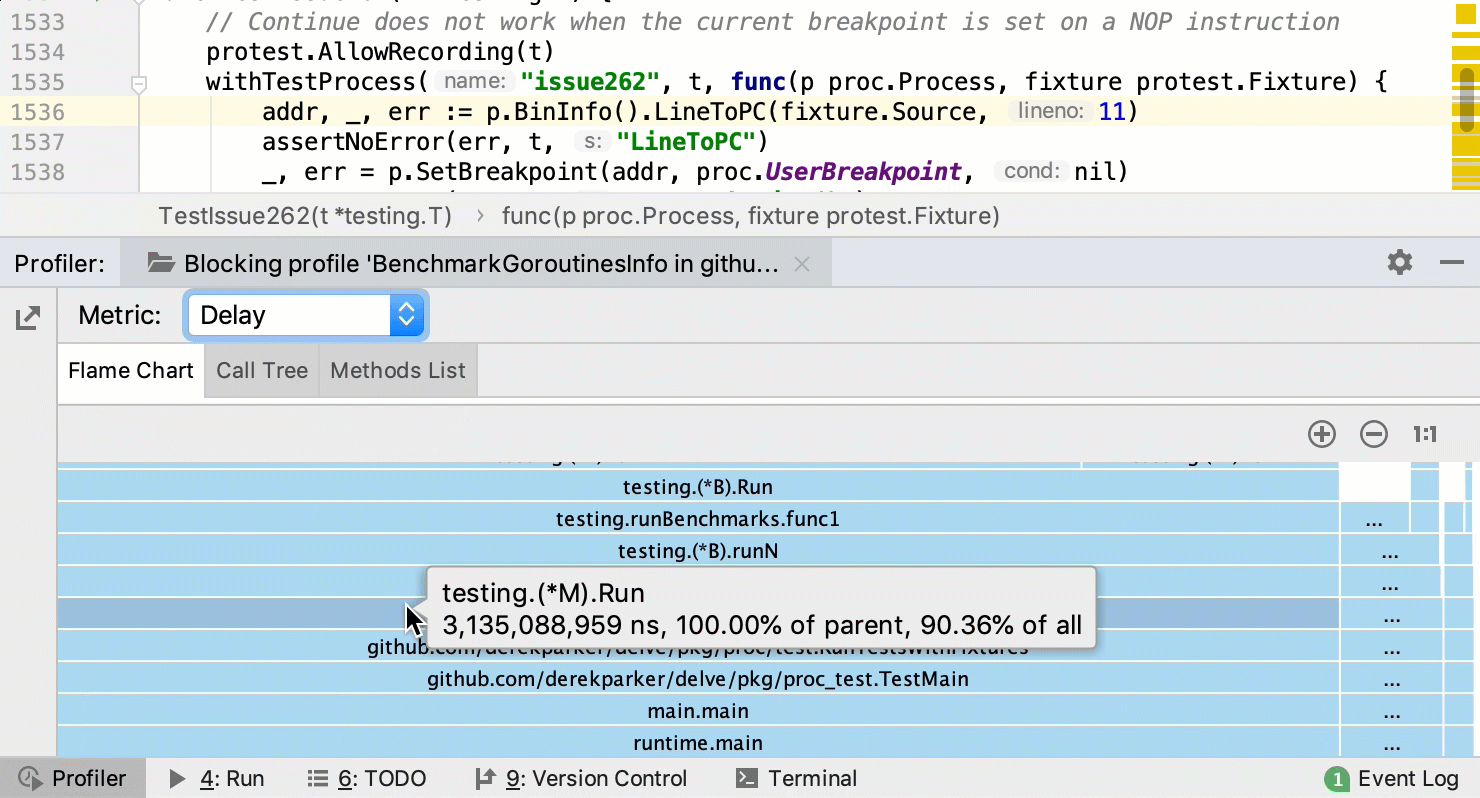
The Flame Chart tab shows you function calls and the amount of time in which goroutines are not running (waiting). Each block represents a function in the stack. On the Y-axis, there is a stack depth going from bottom up. The X-axis shows the stack profile sorted in the increasing order according to the number of delays for each function (with Contentions selected) or according to the time that was spent in the waiting state (with Delay selected).
In the Flame Chart tab, you can hover the mouse over any block to view the details.

, where
4(with Contentions selected): a number of delays at each region.2,990,089,830 ns(with Delay selected): delay time at the selected region, in nanoseconds.100.00% of parent: percentage between different procedures that belong to a single parent call.13.79% of alland90.70% of all: percentage of delays for the procedure and all of its callees.
In the Performance Profiler tool window, you can select between the following metrics:
Contentions: shows functions that are sorted according to a number of delays at each region.
Delay: shows functions that are sorted according to delay time at each region, in nanoseconds.
- Call Tree
-
The Call Tree tab shows the call tree with a number of delays for each function (with Contentions selected) or with time that was spent in the waiting state (with Delay selected). It organizes the data in the decreasing order. To configure and filter the Call Tree view, use the
 and
and  buttons.
 - Method List
-
The Method List tab shows the list of methods sorted by a number of contentions (with Contentions selected) or delay time (with Delay selected). For each method from the list, the profiler provides more information on the nested tabs. The Back Traces tab shows where the selected method has been called. The Merged Callees tab shows call traces that started from the selected method.