CPU profiler
CPU Profiler shows what functions consume what percent of CPU time. This information can provide you a better understanding of how your application is executed, and how exactly resources are allocated.
Once the analysis is finished, the profiler visualizes the output data in the reports to make them more understandable.

Using the profiler
Run CPU profiling
Open the _test.go file. Near the function or method that you want to profile, click the Run Application icon (![]() ) in the gutter area and select Run with 'CPU Profiler' <configuration_name>.
) in the gutter area and select Run with 'CPU Profiler' <configuration_name>.
Interpreting the results
In the CPU Profiler tool window, the collected data is presented on three tabs - Flame Chart, Call Tree, and Method List.
- Flame Chart
-
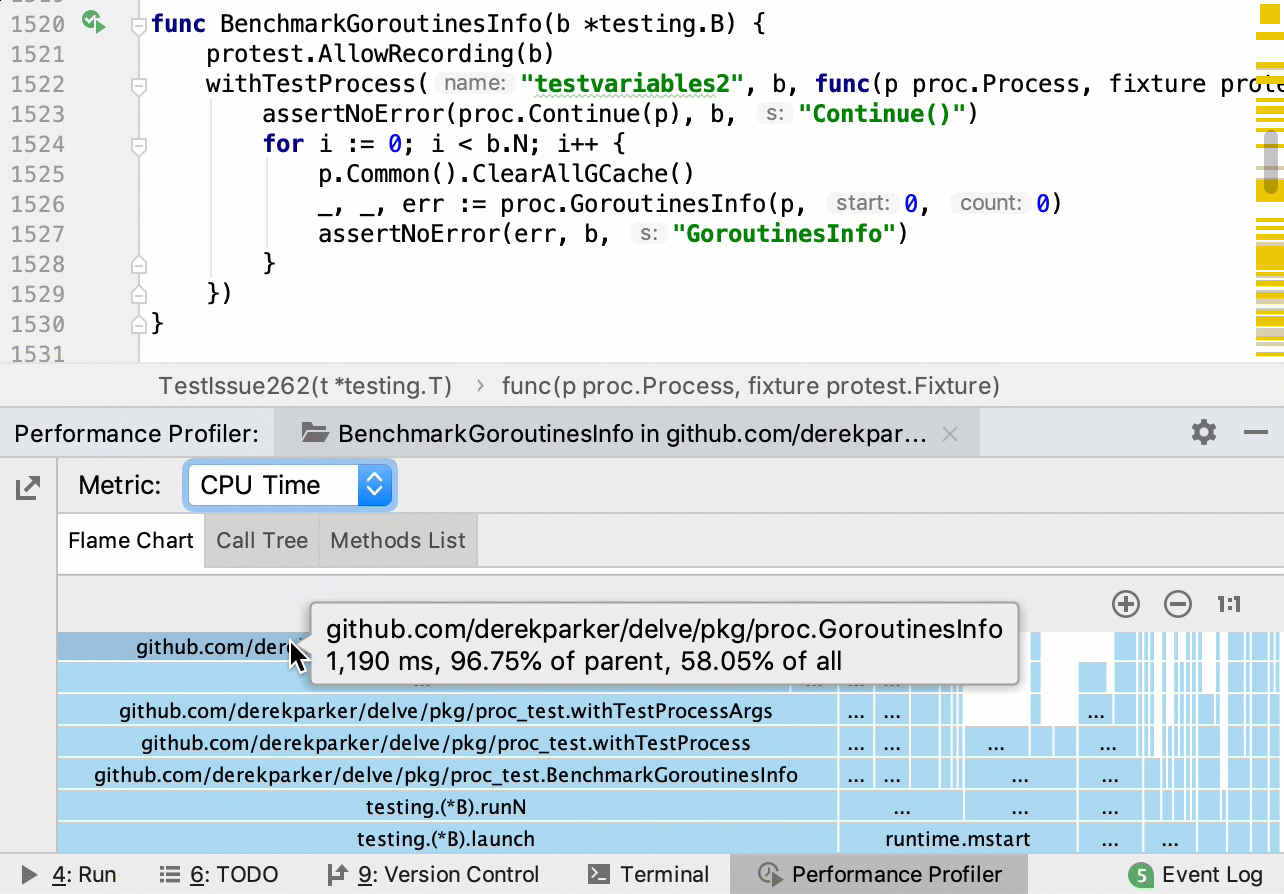
The Flame Chart tab shows you function calls and the percentage of time for execution of each call. Each block represents a function in the stack (a stack frame). On the Y-axis, there is a stack depth going from bottom up. The X-axis shows the stack profile sorted from the most CPU-consuming functions to the least consuming ones.
When you read the flame chart, focus on the widest blocks. These blocks are the functions that are presented in the profile most.
In the Flame Chart tab, you can hover the mouse over any block to view the details:

- Call Tree
-
The Call Tree tab shows the program call tree with the percentage of each function in the total profiling time. It organizes the data to show you where the application spends most of the time in total. To configure and filter the Call Tree view, use the
 and
and  buttons.
- Method List
-
The Method List tab shows the list of methods sorted by the number of samples. For each method from the list, the profiler provides more information on the nested tabs. The Back Traces tab shows where the selected method has been called. The Merged Callees tab shows call traces that started from the selected method.
