Creating diagrams
Generate a diagram for a database object
You can create a diagram for a data source, a schema, or a table.
In the Database tool window (), right-click a database object and select .

Build a query plan
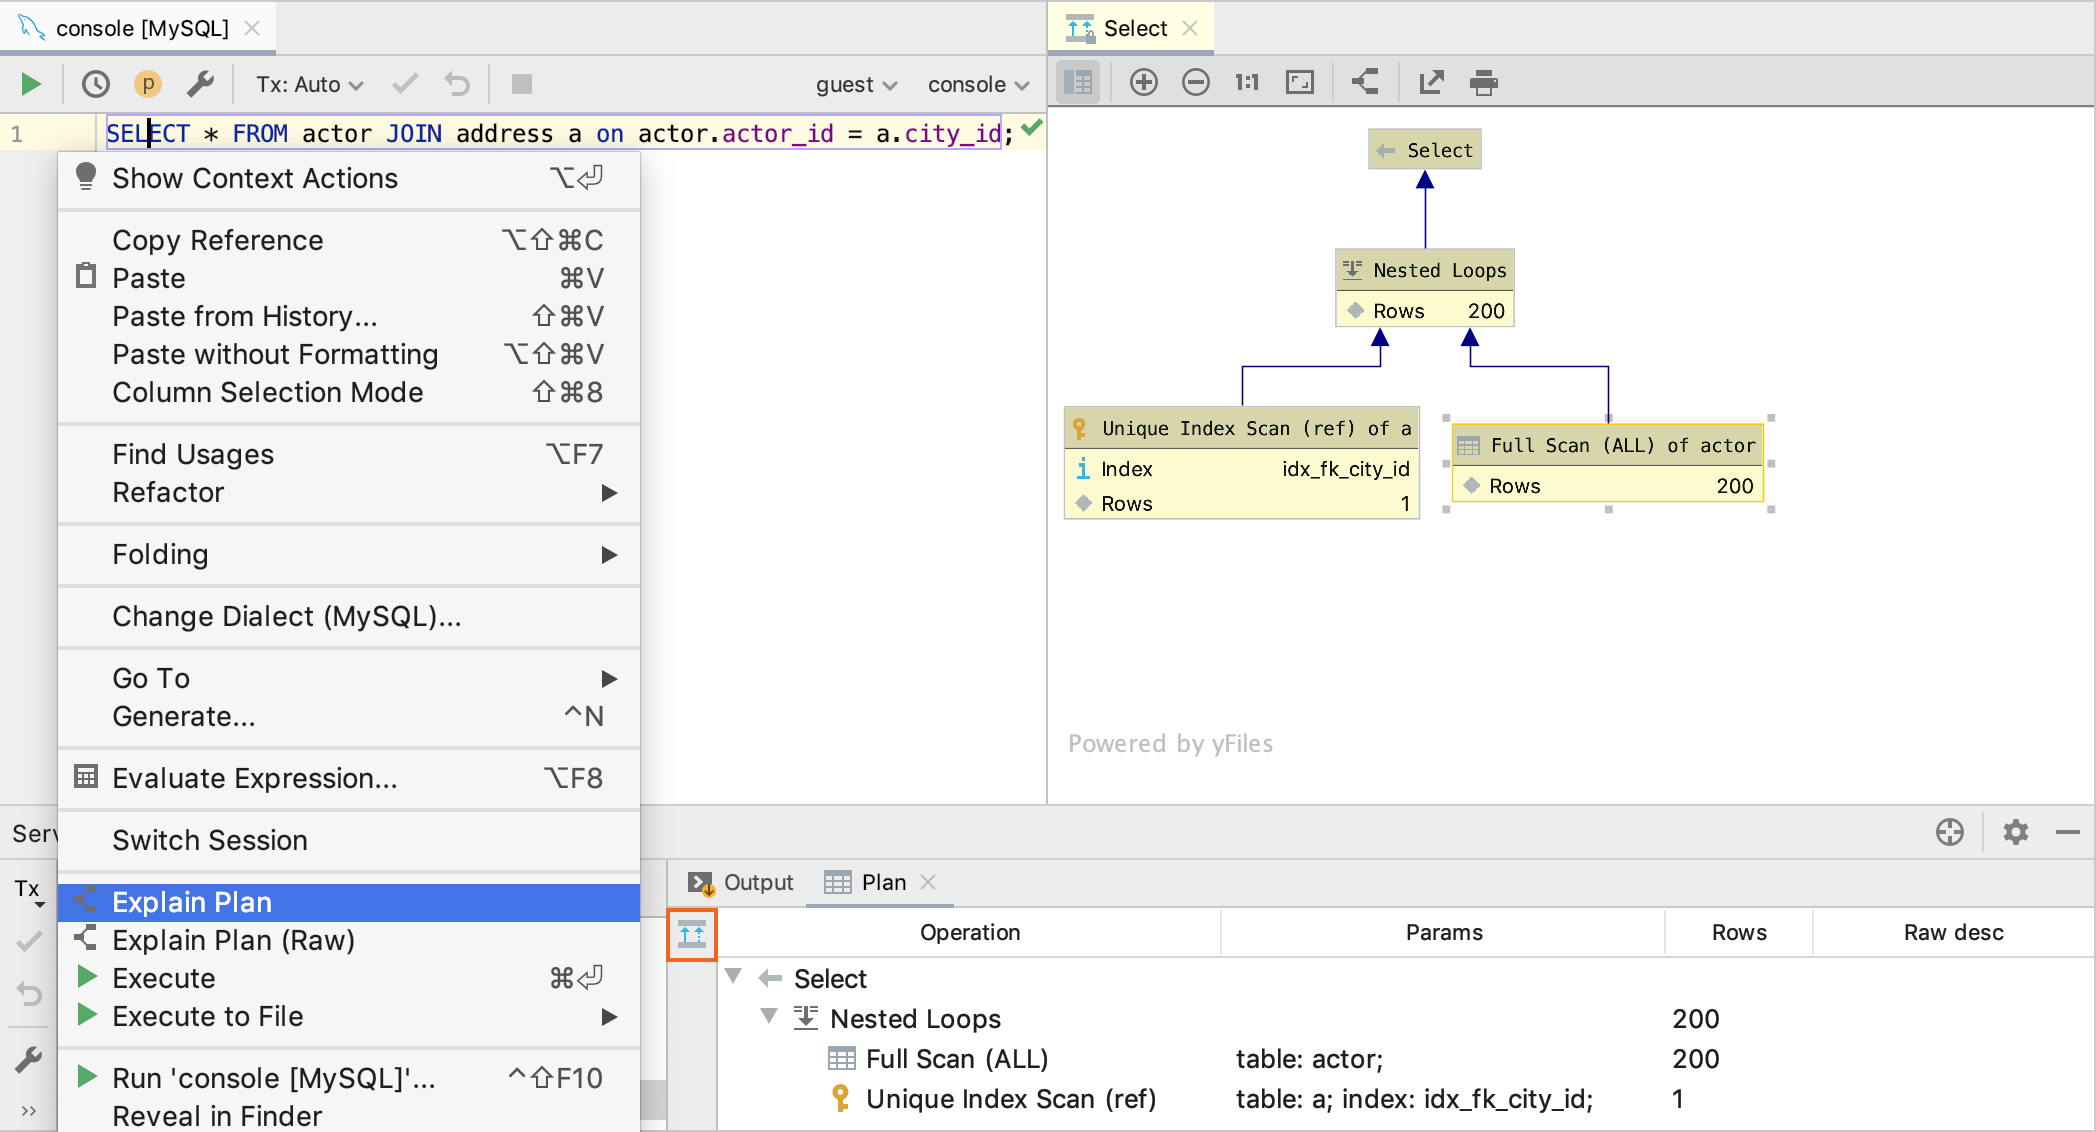
Right-click an SQL statement, and select Explain plan.
In the Output pane, click Plan.
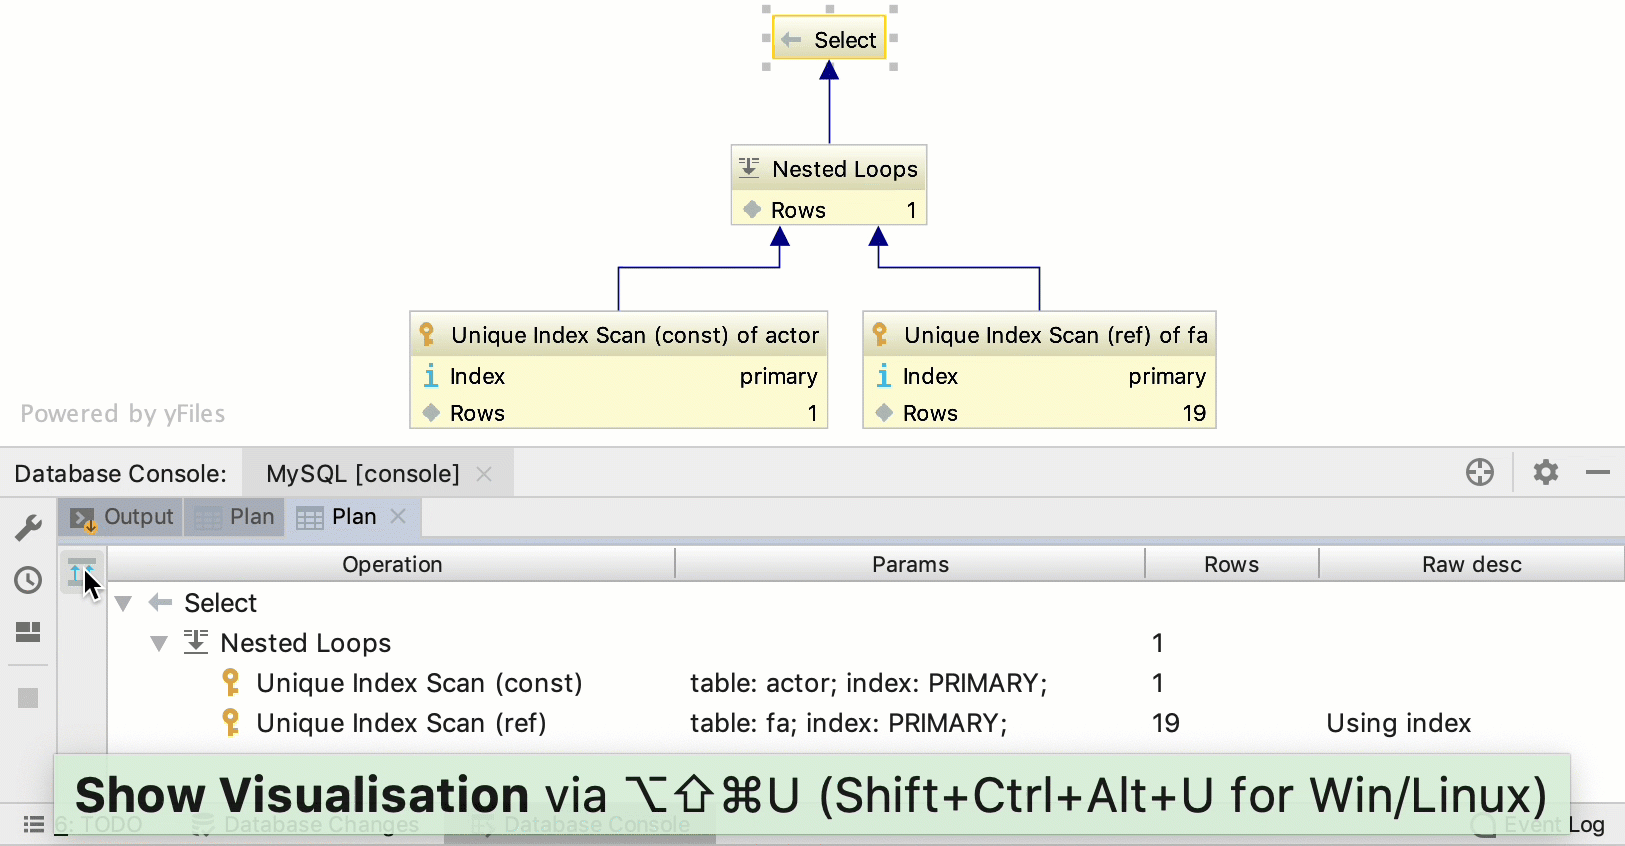
By default, you see the tree representation of the query. To see the query plan, click Show Visualization
 , or press Ctrl+Shift+Alt+U.
Show execution plans
Execution plan is a set of steps that were used to access data in a database. GoLand supports two types of execution plans:
Explain Plan: the result is shown in a mixed tree and table format on a dedicated Plan tab. You can click the Show Visualization icon (
) to create a diagram that visualizes the query execution. Explain Plan (Raw): the result is shown in a table format.
To create an execution plan, right-click a query in the database console and select Explain Plan. If you want to create a diagram for the query, click the Show Visualization icon (![]() ).
).