Debugging code
Create a breakpoint
To create a breakpoint, select the code line that you want to examine and click an area in the gutter near the line number.
The Evaluate Expression window and the Watchers pane provide code completion, code inspections, and quick-fixes.
Start a debugging session
-
Configure the Run/Debug Configurations profile ().
Create a breakpoint.
- Click the Debug <configuration_name> button
 .
. You can pause or resume the debugging session as required. Also, during the debugger session, you can step through the breakpoints, evaluate function calls, examine suspended program, and set watches.

Breakpoints
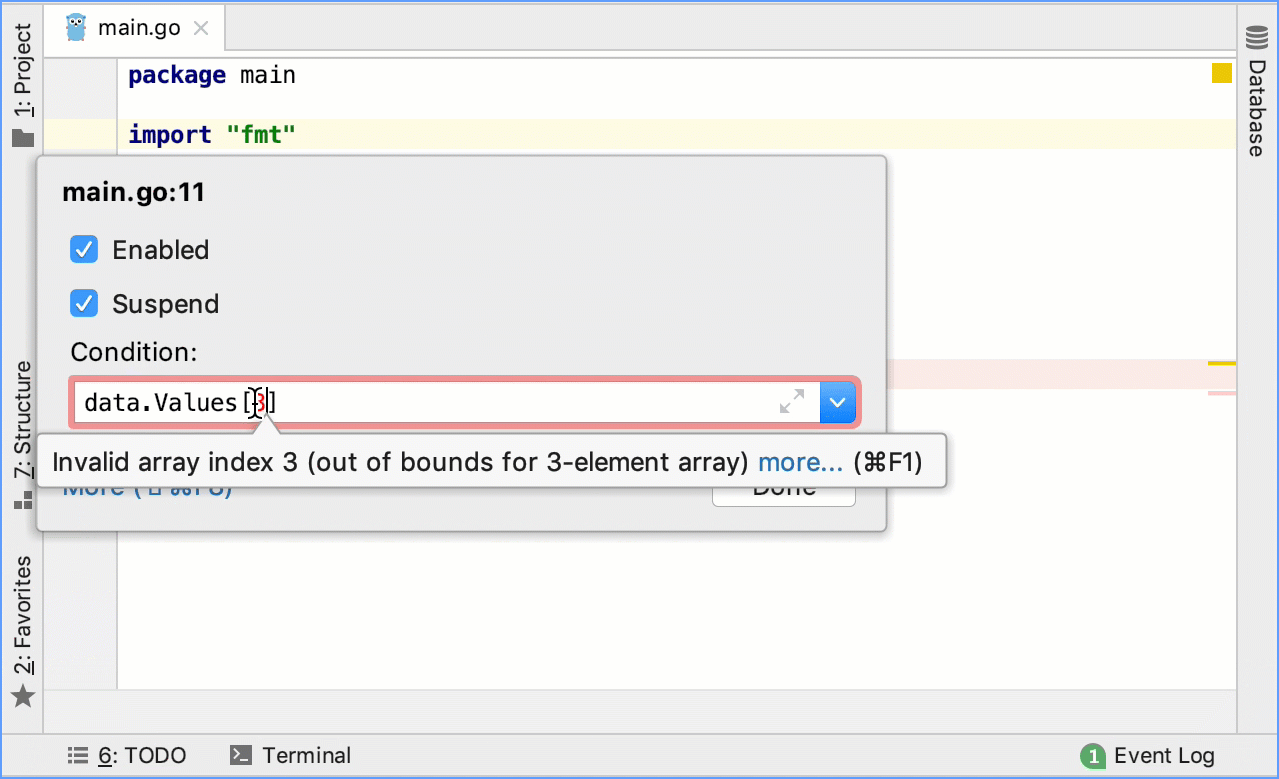
Customize breakpoint settings
To customize breakpoint settings, press Ctrl+Shift+F8. To see all breakpoints in the project (with additional settings), click More or press the same shortcut Ctrl+Shift+F8 again.

Do not suspend code execution
Use action breakpoints to evaluate a variable at a particular line of code without suspending code execution. To create an action breakpoint, click the gutter while pressing Shift.
Create a temporary breakpoint
To create a breakpoint that stops only once, click the left gutter while holding Shift+Alt. For more information, refer to the section Breakpoints.
Disable breakpoints
To disable a breakpoint, click the breakpoint while pressing Alt.
Debugger session
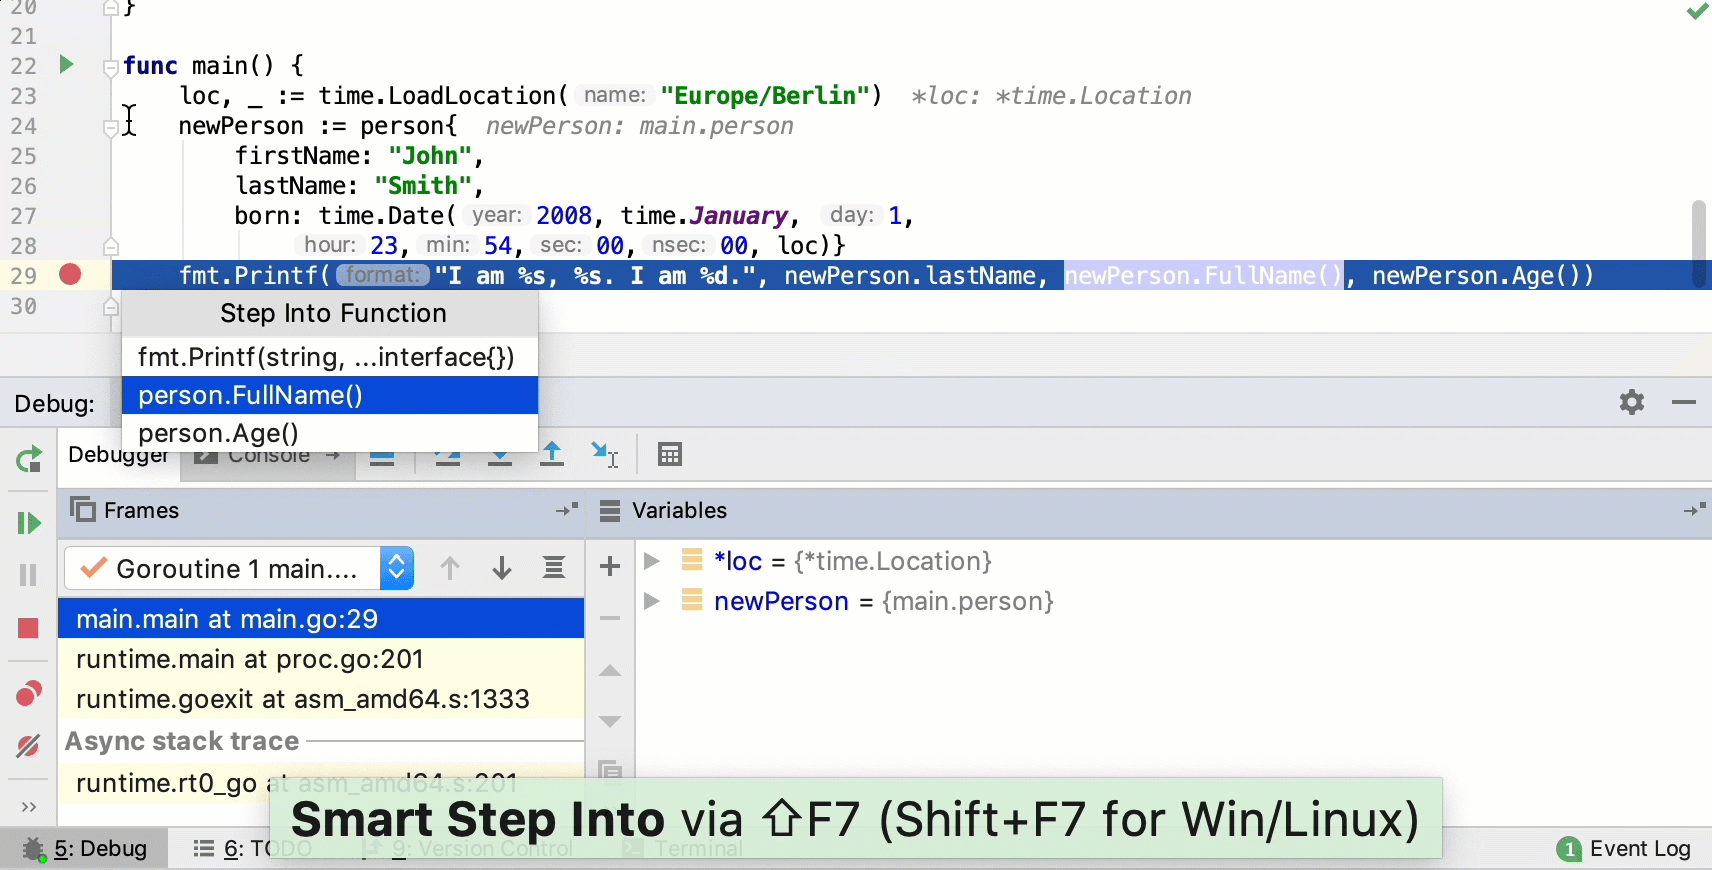
Smart step into
Sometimes it happens that you stay at a line and want to step into a particular method but not the first one that will be invoked. In this case use Smart step into by pressing Shift+F7 to choose a particular method.
Place a breakpoint on the line that has a chain of calls or nested method calls.
Run a debugging session Shift+F9.
Press Shift+F7.
From the context menu, select the method that you want to debug.
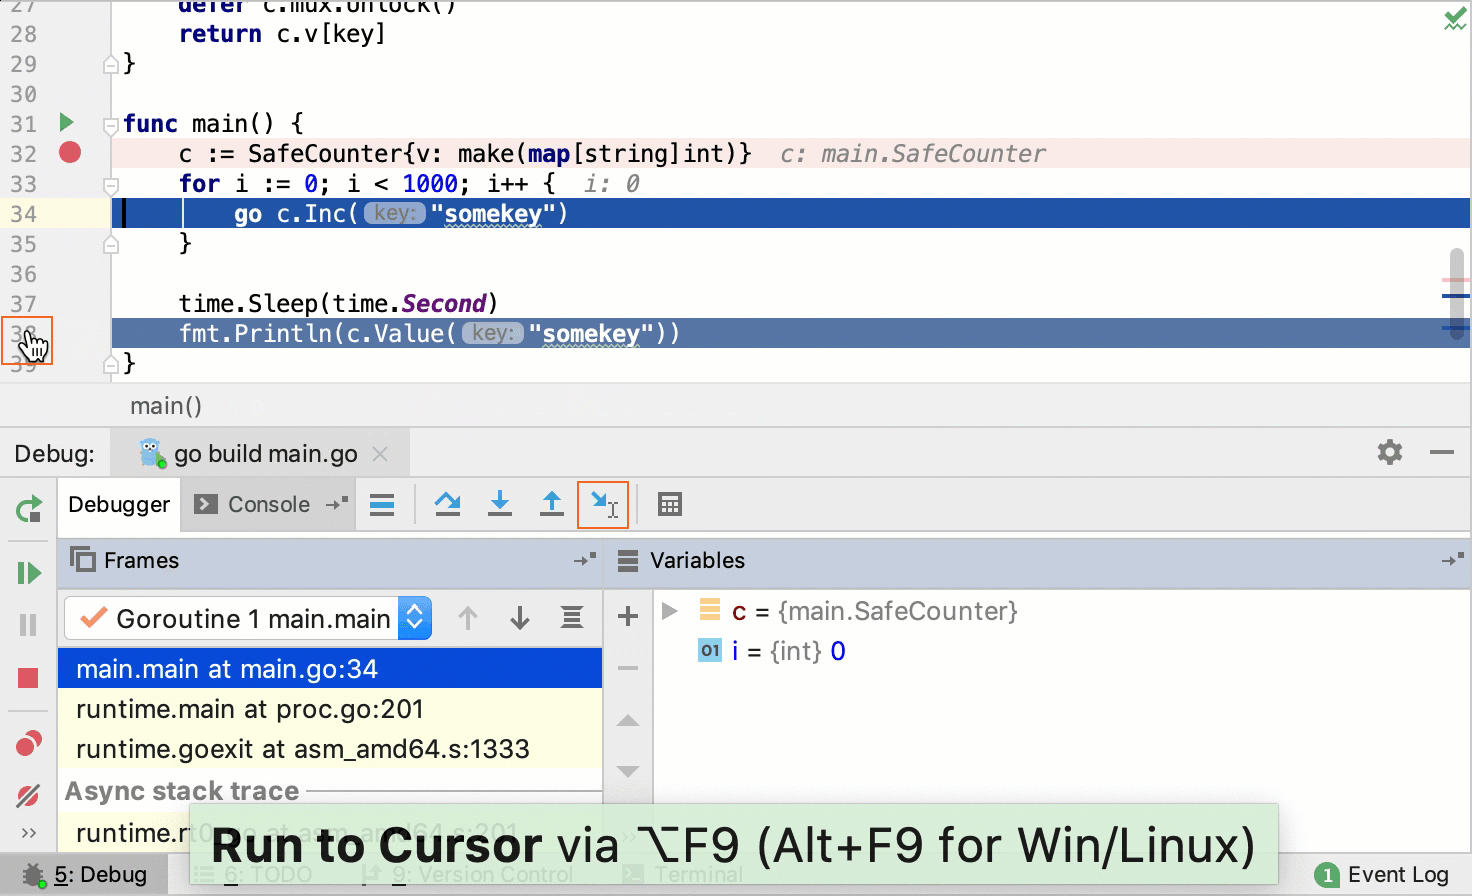
Run to cursor
Create a breakpoint.
Run a debugging session. To run a debugging session, click the Run Application icon (
 ) in the gutter area and select Debug <configuration_name>.
To stop code execution at the cursor position without adding another breakpoint, click the Run to cursor icon (![]() ) or press Alt+F9. Alternatively, you can click the line number in the gutter area.
) or press Alt+F9. Alternatively, you can click the line number in the gutter area.
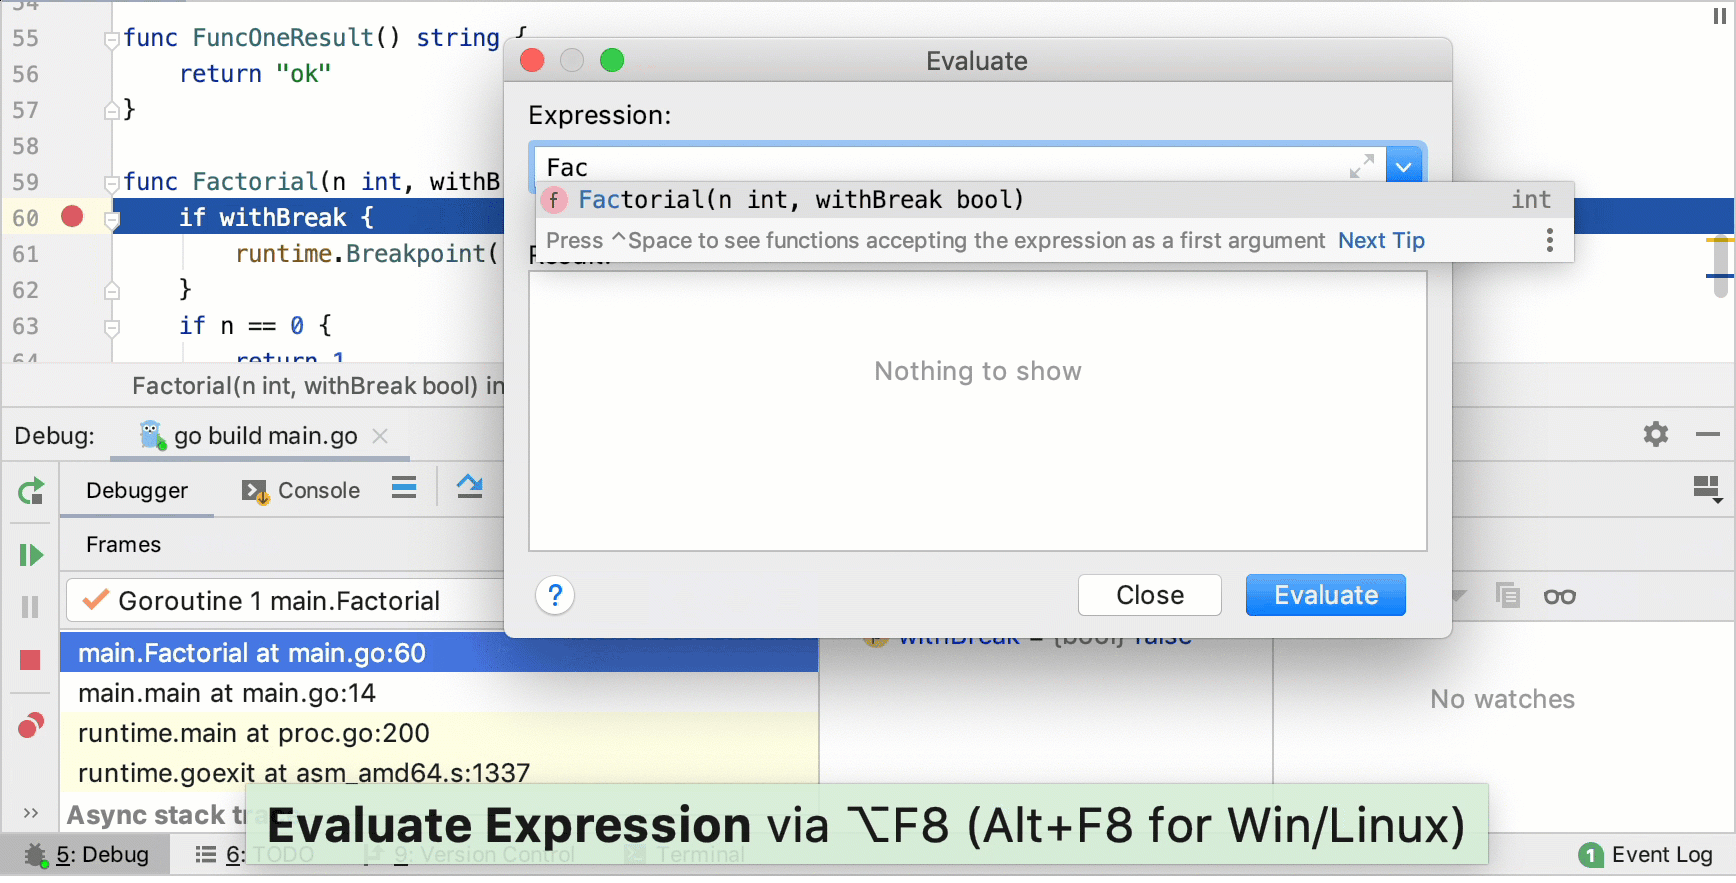
Evaluate expression
In the debug mode, you can evaluate a function call by pressing Alt+F8.
The Evaluate dialog supports code completion.
To see how the behavior of various function calls changes during your debugging session, set custom watches. You can read more about watches in Adding, editing and removing watches.
Quick evaluate expression
During the debugging session, select (highlight) an expression and press Ctrl+Alt+F8 or click . You will see the result of the expression in a tooltip.

Configuring debugger settings
To change debugger settings, click . In the Settings menu, click . 
Useful debugger shortcuts
Action | Hotkey |
|---|---|
| Toggle breakpoint | Ctrl+F8 |
| Resume program | F9 |
| Step over | F8 |
| Step into | F7 |
Stop | Ctrl+F2 |
| View breakpoint details/all breakpoints | Ctrl+Shift+F8 |
Debug code at caret | Shift+F9 (within the main method), or Shift+Alt+F9 |