Memory profiler
Memory profiler shows what functions allocate heap memory. This statistics can help you to find memory leaks and optimize the overall memory usage.
Run Memory profiling
Open the _test.go file.
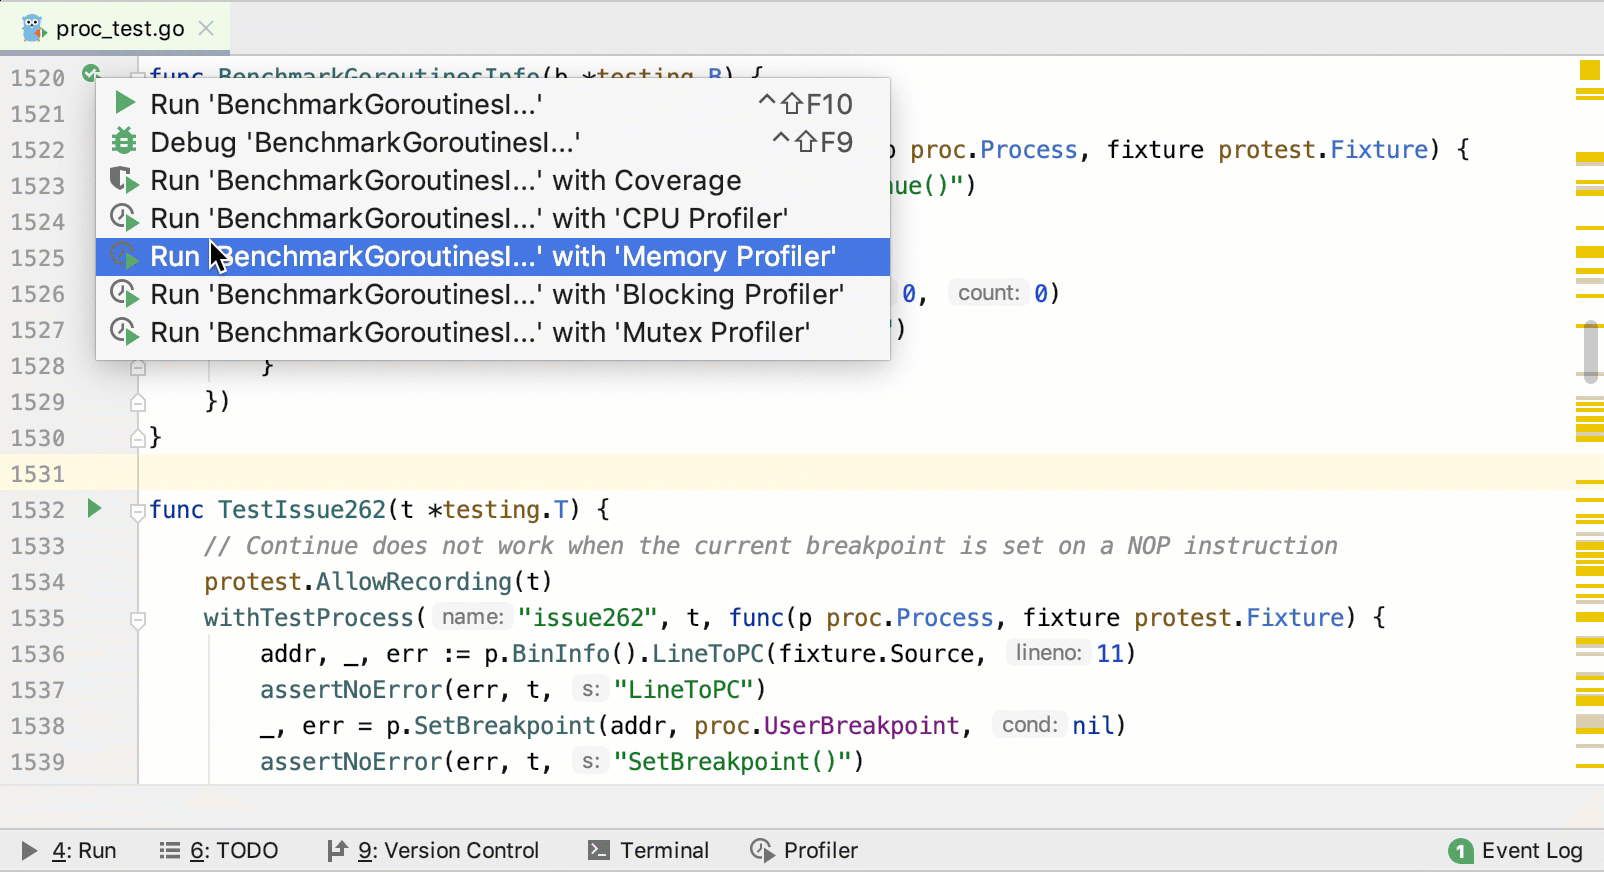
Near the function or method that you want to profile, click the Run Application icon ![]() in the gutter area and select Run <configuration_name> with 'Memory Profiler'.
in the gutter area and select Run <configuration_name> with 'Memory Profiler'.
Interpreting the results
- Flame Chart
The Flame Chart tab shows you function calls and the amount of memory that was allocated for each call. Each block represents a function in the stack. On the Y-axis, there is a stack depth going from bottom up. The X-axis shows the stack profile sorted from the most memory-consuming functions (space and number of objects) to the least consuming ones.
When you read the flame chart, note that large objects affect memory consumption and garbage collection time, while a large number of small allocations affects execution speed. It might be useful to investigate both cases.
In the Flame Chart tab, you can hover the mouse over any block to view the details.

, where
13,020,338: direct memory usage, in bytes.
100.00% of parent: percentage between different procedures that belong to a single parent call.
95.17% of all: percentage of memory usage for the procedure and all of its callees.
- Call Tree
The Call Tree tab shows the call tree with the percentage of each procedure in the total memory usage. It organizes the data to show you where the application uses most of the memory or more objects in the memory. To configure and filter the Call Tree view, use the Presentation Settings button
 .
. 
- Method List
The Method List tab shows the list of methods that are sorted by the number of allocated objects. The Back Traces tab shows where the selected method has been called. The Merged Callees tab shows call traces that started from the selected method.