Attach to running Go processes with the debugger
In GoLand, you can attach the debugger to a running Go process on a local machine, on a remote machine, or in the Docker container.
Attach to a process on a local machine
You can debug an application that you launched from the command line. In this case, the application runs outside the IDE but on the same local machine. To debug the application, you need to open the project in the IDE and attach the debugger to the running process.
For example purposes, you can use the following Go code at github.com.
Step 1. Install the gops package
Open the Terminal tool window () and run the following command:
go get -t github.com/google/gops/Click (Ctrl+Alt+F5). In the notification window, click the Invoke 'go get gops' link.

Step 2. Build and run the application
Open the Terminal tool window () and run the following command depending on your Go version:
Go 1.10 and later:
go build -gcflags="all=-N -l" -o myAppGo 1.9 and earlier:
go build -gcflags="-N -l" -o myApp
This command compiles the
myAppexecutable and disables compiler optimizations and inlining.Run the compiled executable (for example,
./myApp).
Step 3. Attach to and debug the running process
Click the gutter near the line of code to place the breakpoint. For example, in the provided code example, put the breakpoint on the line 23 (
message := fmt.Sprintf("Hello %s!", r.UserAgent())). Read more about breakpoints in Breakpoints.Click Ctrl+Alt+F5.
In the Attach with Debugger To window, select your application process and press Enter.
Trigger the event at the breakpoint in your application. If you used the provided code example, open the
http://localhost:8080/link in a browser.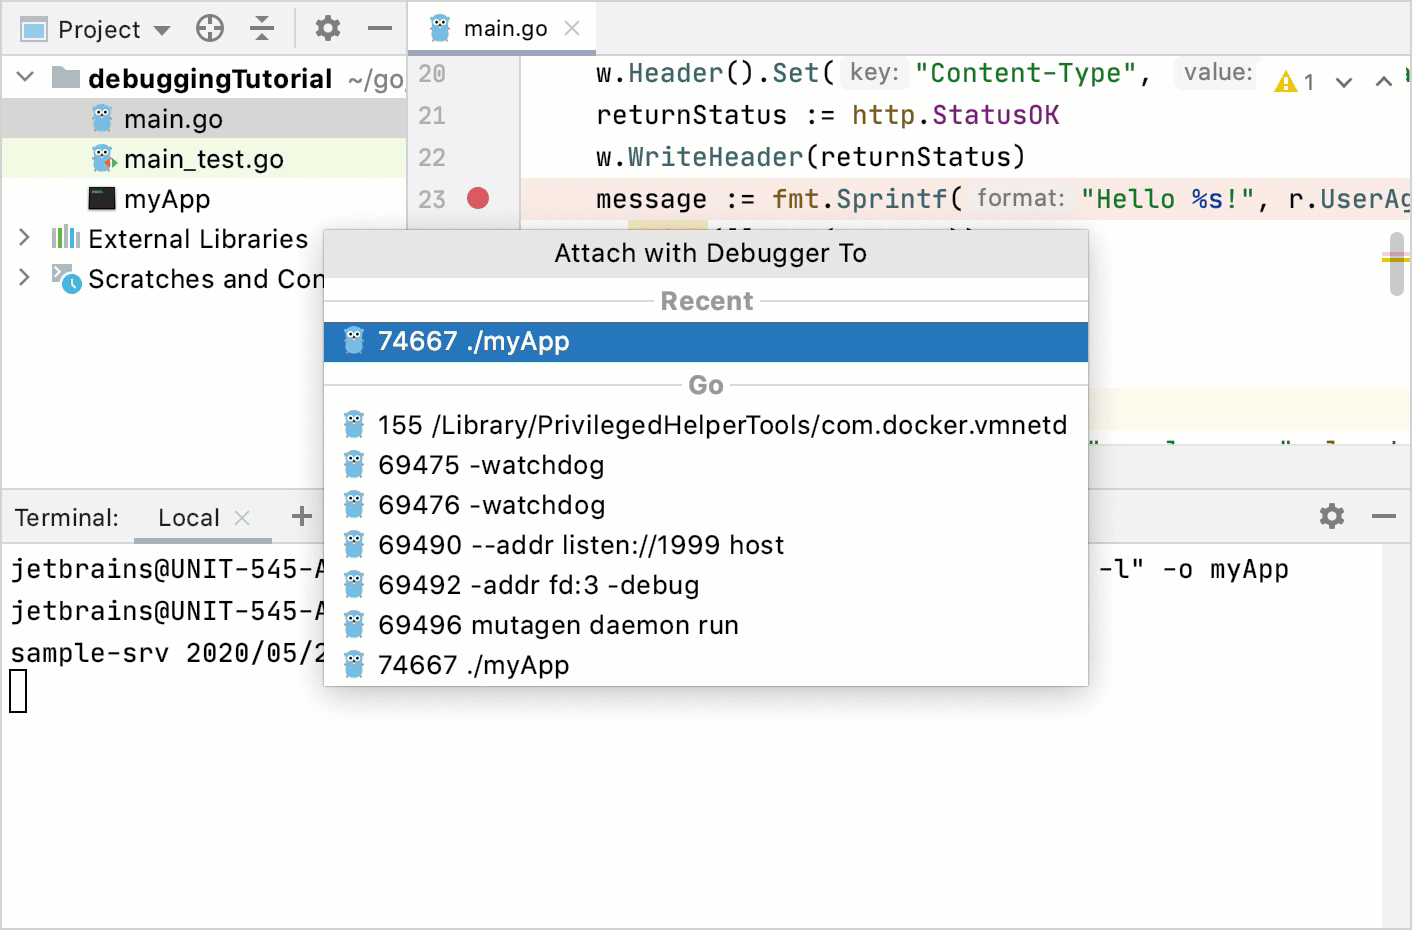
Attach to a process on a remote machine
You can connect to a remote computer (a host) and attach the debugger to the Go process that runs on the host. The remote debugger (Delve) must be running on the remote computer.
Step 1. Build the application on the host machine
If you use the
$GOPATHapproach, ensure that the project is compiled with the same relative path to$GOPATHon host and client machines. For example, if code of your application on the host is in$GOPATH/src/debuggingTutorial/. Code on the client must be in the same directory ($GOPATH/src/debuggingTutorial/).Open the Terminal tool window () and run the following command depending on your Go version:
Go 1.10 and later:
go build -gcflags="all=-N -l" -o myAppGo 1.9 and earlier:
go build -gcflags="-N -l" -o myApp
This command compiles the
myAppexecutable and disables compiler optimizations and inlining.
Step 2. Run Delve on the host machine
You have two options to launch the debugger on the host machine:
The debugger runs the process for you. If you use a firewall, expose the port that is used in the configuration (for example,
2345). You can use any port number that is not occupied.myAppis the name of the executable that was built on Step 1.dlv --listen=:2345 --headless=true --api-version=2 exec ./myAppYou run the process, and the debugger attaches to the running process.
<PID>is the process identifier of your application. You can get the process identifier by using the Attach to Process command.run dlv --listen=:2345 --headless=true --api-version=2 attach <PID>

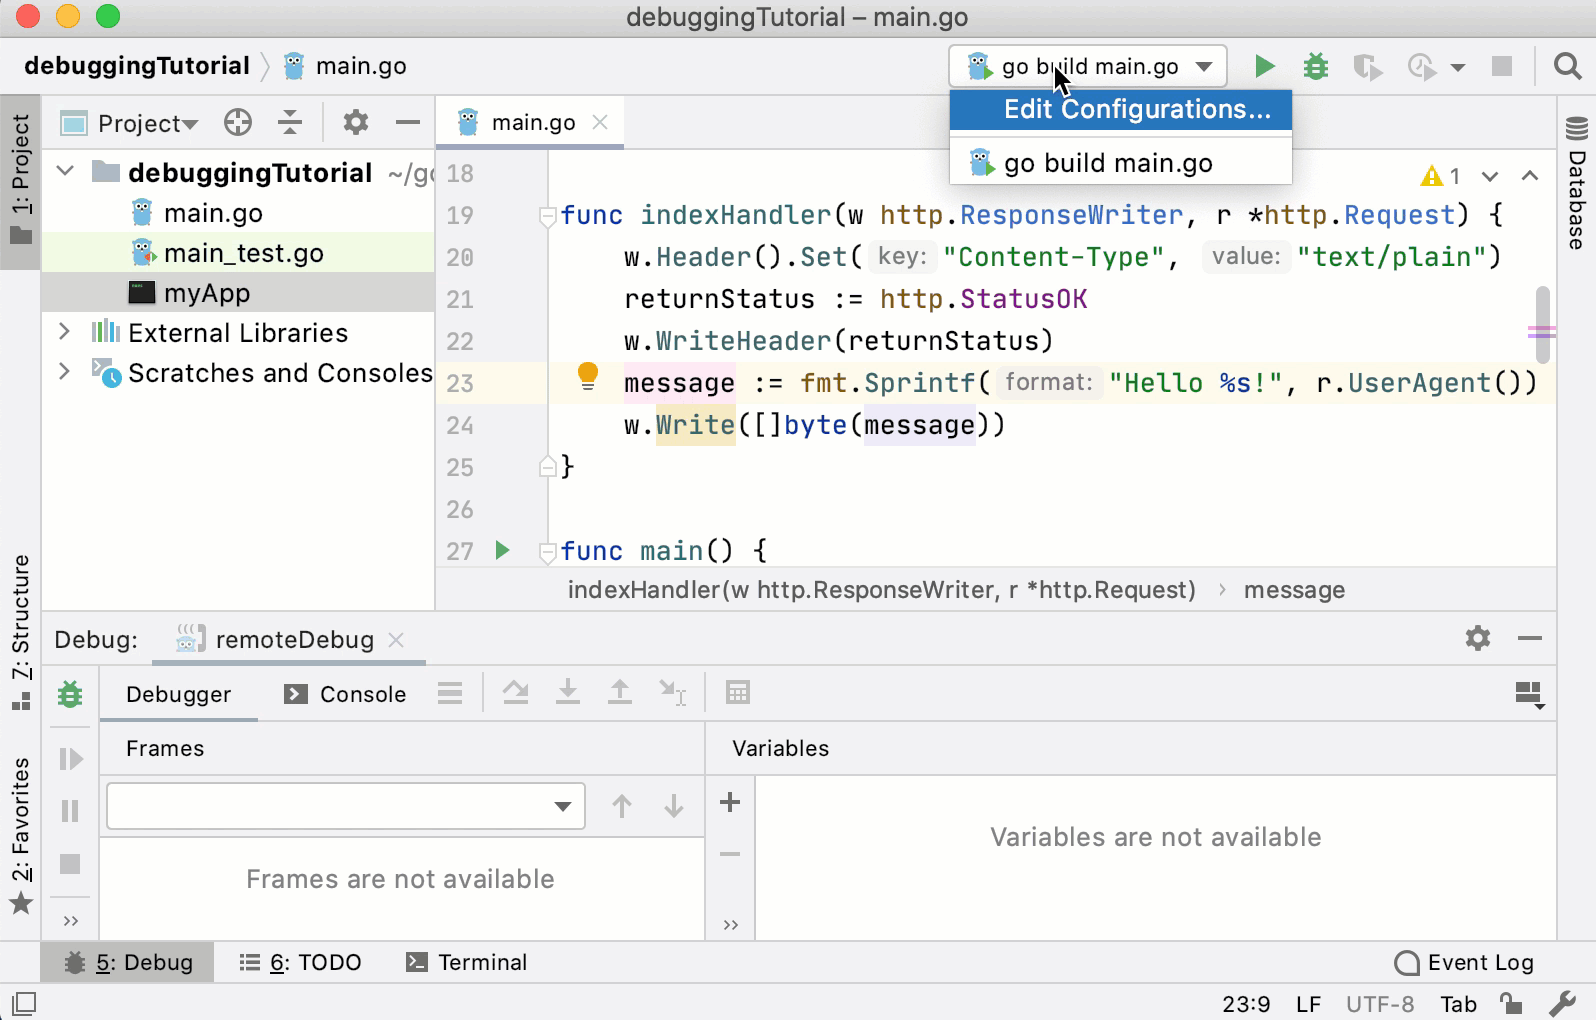
Step 3. Create the Go Remote run/debug configuration on the client computer
Click . Alternatively, click the list of run/debug configurations on the toolbar and select Edit Configurations.
In the Run/Debug Configurations dialog, click the Add button (
 ) and select Go Remote.
 In the Host field, type the host IP address (for example,
192.168.1.33).In the Port field, type the debugger port that you configured on Step 2 (for example,
2345).Click OK.
Step 4. Start the debugging process on the client computer
Click the gutter near the line of code to place the breakpoint. For example, in the provided code example, put the breakpoint on the line 23 (
message := fmt.Sprintf("Hello %s!", r.UserAgent())). Read more about breakpoints in Breakpoints.From the list of run/debug configurations on the toolbar, select the created Go Remote configuration and click the Debug <configuration_name> button (
 ). Alternatively, press Alt+Shift+F9 and select the created Go Remote configuration.
Trigger the event at the breakpoint in your application. If you used the provided code example, open the
http://<host_address>:8080/link in a browser.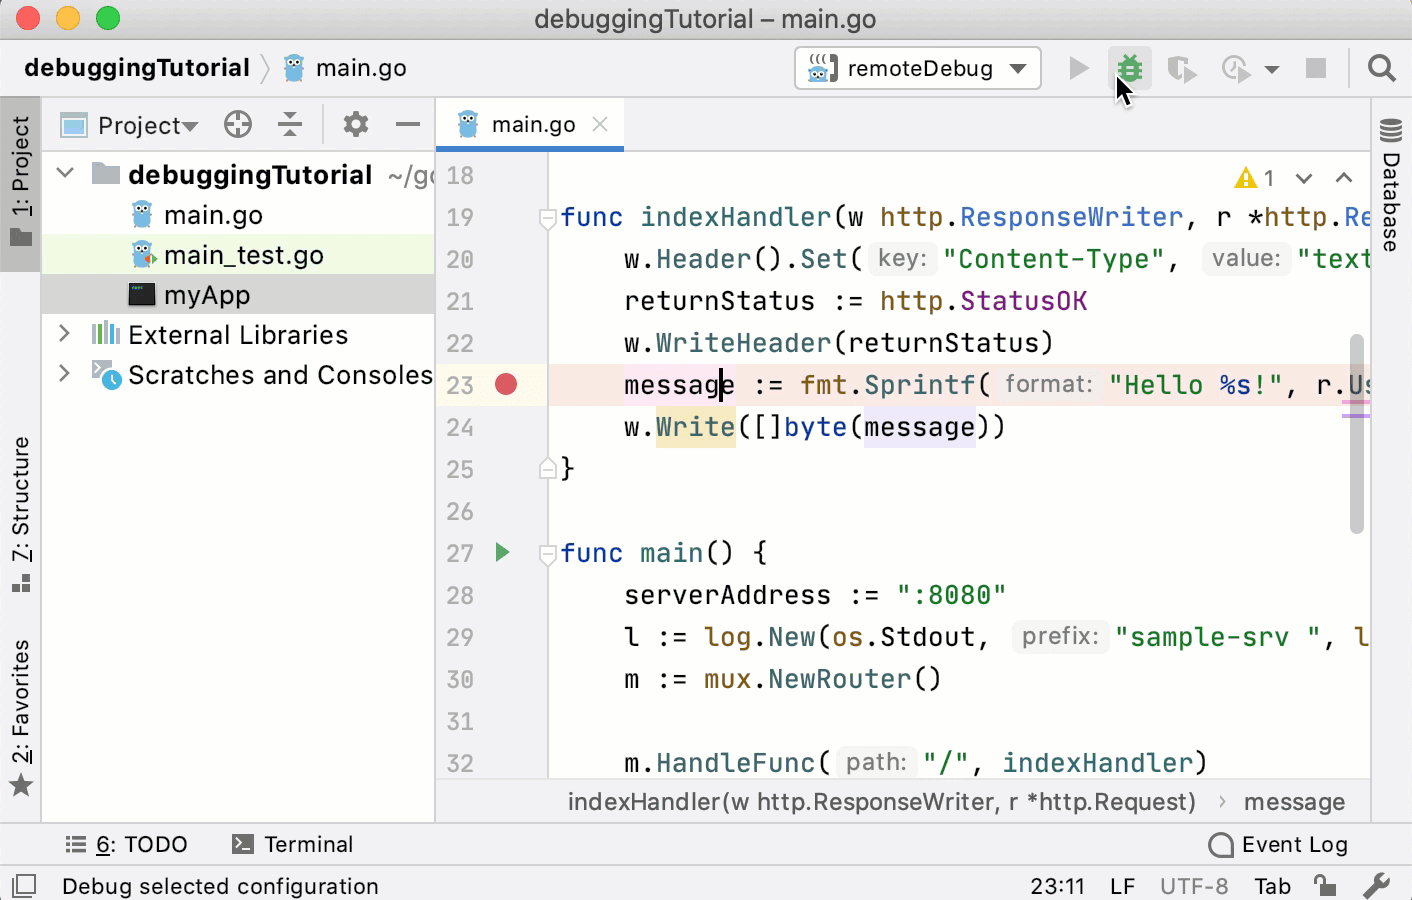
Attach to a process in the Docker container
You can attach the debugger to a Go process that runs in a Docker container. For more information about Docker, see Docker.
For example purposes, you can use the following Dockerfile for this Go application. Save Dockerfile and main.go in $GOPATH/src/debuggingTutorial. Note that Dockerfile uses the debuggingTutorial directory. If you use a different directory for the project, change the directory name in the Dockerfile.
Step 1. Create a Dockerfile configuration
Click . Alternatively, click the list of run/debug configurations on the toolbar and select Edit Configurations.
In the Run/Debug Configurations dialog, click the Add button (
) and select . In the Dockerfile field, click the Browse icon (
 ) and navigate to Dockerfile in the file browser. If you use the example from this section, navigate to this Dockerfile.
In the Container name field, type the container name (for example,
debugging-tutorial)In the Bind ports field, click the Browse icon (
). Click the Add button (). In the Host port column, type 8080. Click the Container port column, type8080. Also, add the same binding for the port40000.
In the Run options field, specify command-line options for Docker. For the provided example in Dockerfile, disable the security profile and add the
SYS_PTRACELinux capability.--security-opt="apparmor=unconfined" --cap-add=SYS_PTRACEClick OK.

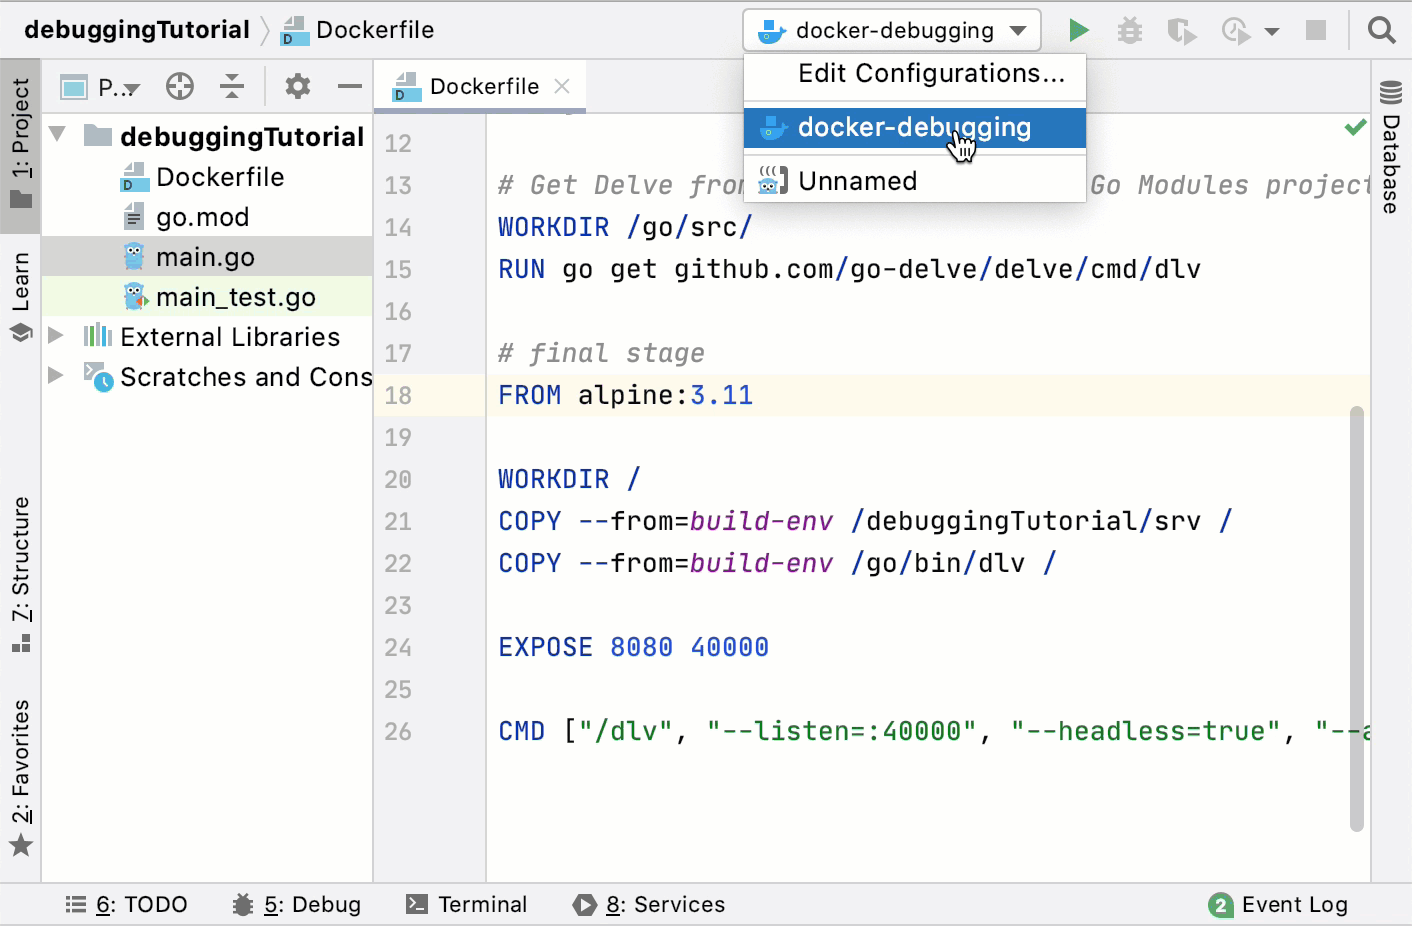
Step 2. Run the Dockerfile configuration
From the list of run/debug configurations on the toolbar, select the created Dockerfile configuration and click the Run <configuration_name> button (
 ).
).
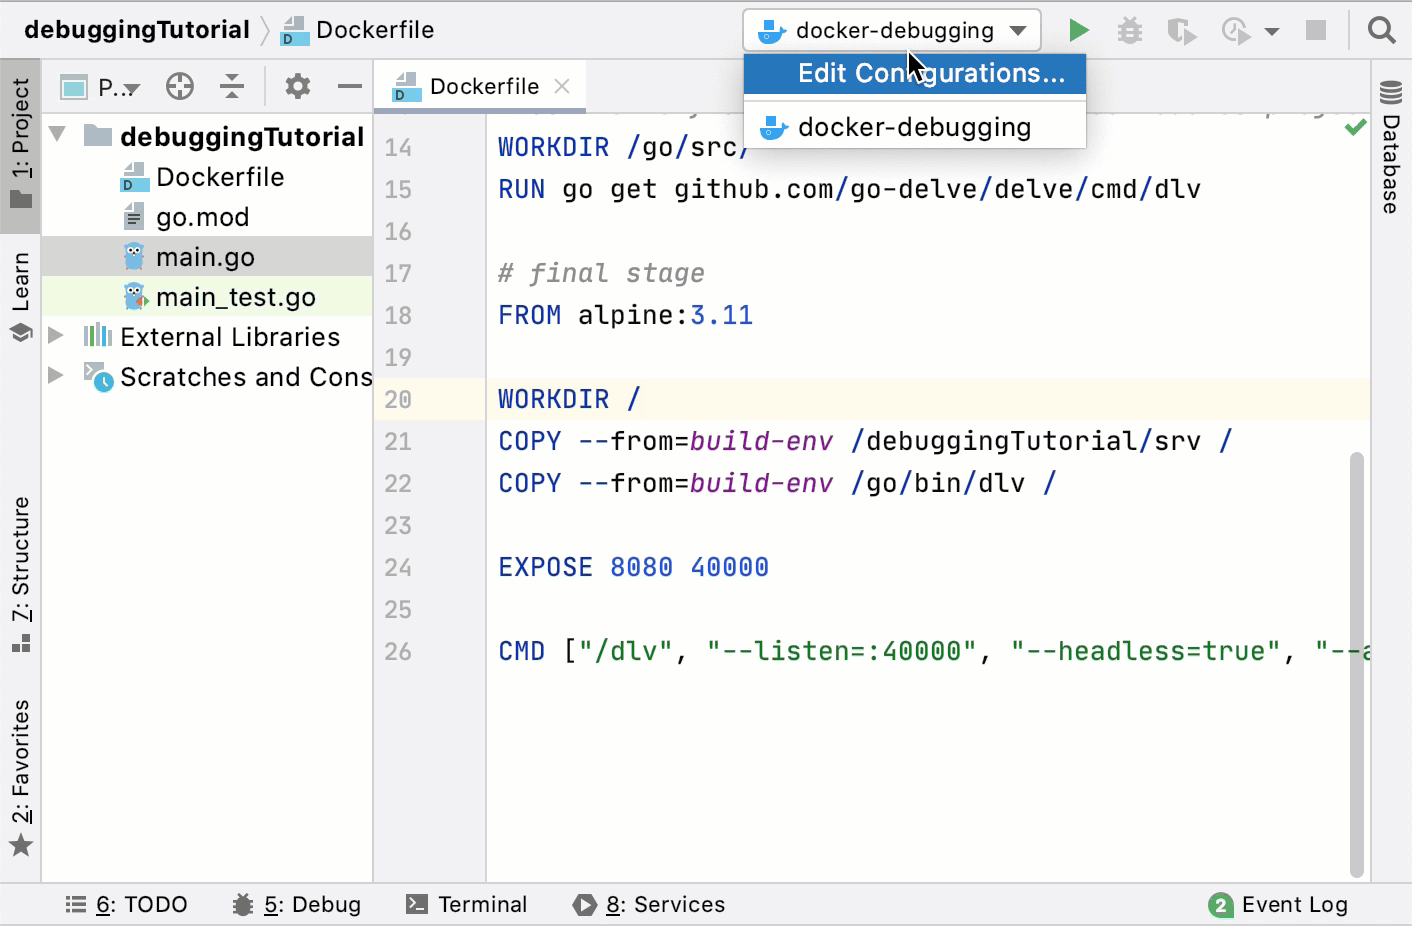
Step 3. Create the Go Remote run/debug configuration
Click . Alternatively, click the list of run/debug configurations on the toolbar and select Edit Configurations.
In the Run/Debug Configurations dialog, click the Add button (
) and select Go Remote. In the Host field, type the host IP address (for example,
localhost).In the Port field, type the debugger port that you configured. In the provided example, it is
40000.Click OK.
Step 4. Start the debugging process
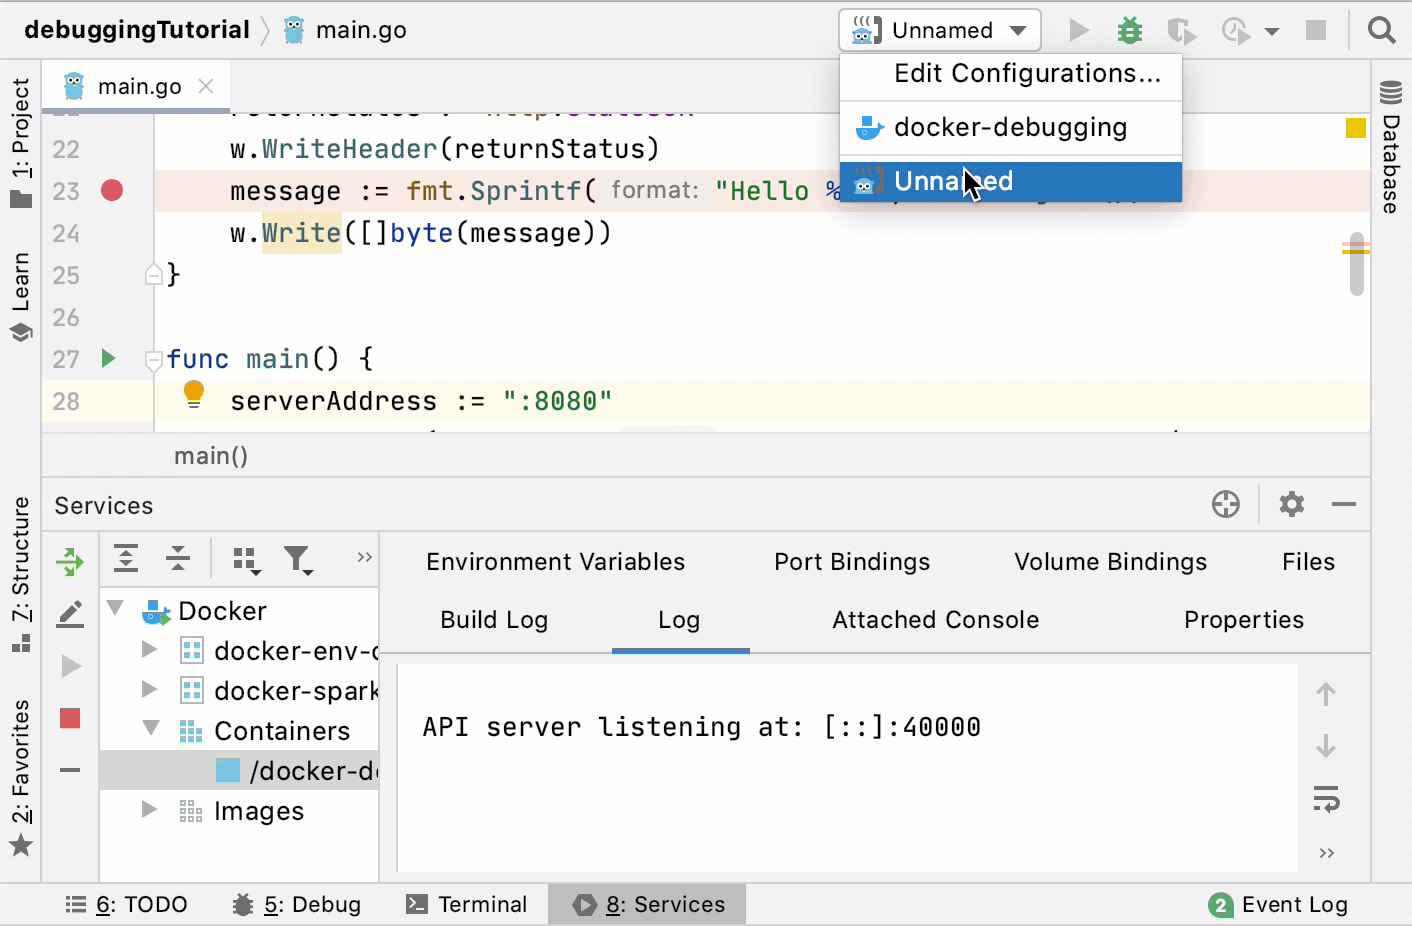
In the Services tool window (), expand . Ensure that the created container is running and listens to the preconfigured debugger port.
Click the gutter near the line of code to place the breakpoint. For example, in the provided code example, put the breakpoint on the line 23 (
message := fmt.Sprintf("Hello %s!", r.UserAgent())). Read more about breakpoints in Breakpoints.From the list of run/debug configurations on the toolbar, select the created Go Remote configuration and click the Debug <configuration_name> button (
). Alternatively, press Alt+Shift+F9, select the created Go Remote configuration.Trigger the event at the breakpoint in your application. If you used the provided code example, open the
http://localhost:8080/link in a browser.