Step through the program
Stepping is the process of controlling step-by-step execution of the program.
GoLand provides a set of stepping actions, which are used depending on your strategy (for example, whether you need to go directly to the next line or enter the methods invoked on your way there).
The stepping buttons are located on the Debug window toolbar.
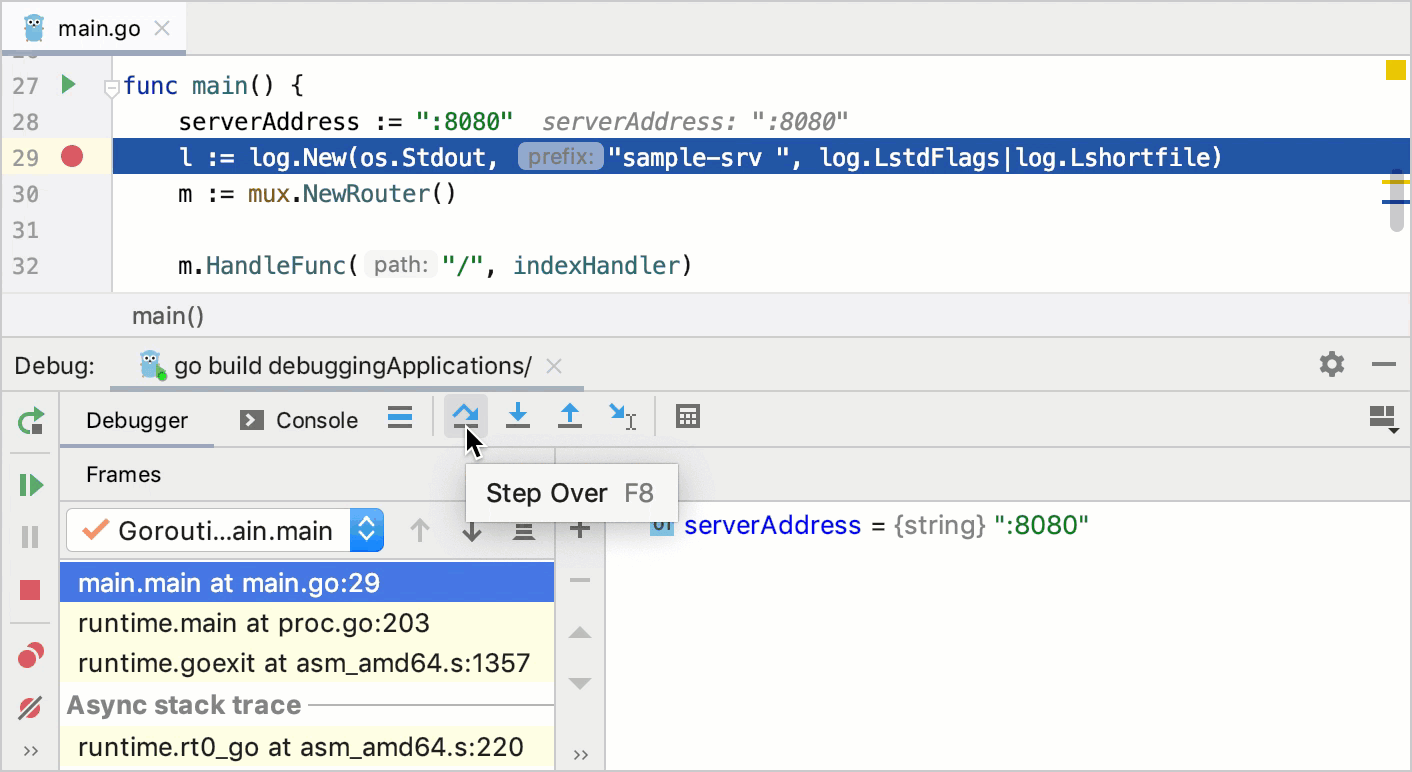
Step over
Steps over the current line of code and takes you to the next line even if the highlighted line has method calls in it. The implementation of the methods is skipped, and you move straight to the next line of the caller method.
Click the Step over button
 or press F8.
In the following example, line 29 is about to be executed. If you step over, the debugger will move straight to line 30 without jumping into the New() function.
If there are breakpoints inside the skipped methods, the debugger will stop at them. To skip any breakpoints on the way, use Force step over.
Step into
Steps into the method to show what happens inside it. Use this option when you are not sure the method is returning a correct result.
Click the Step into button
 or press F7.
In the following example, line 29 is about to be executed. If you step into, the debugger will jump into the implementation of the New function allowing you to examine in detail how its result is produced.
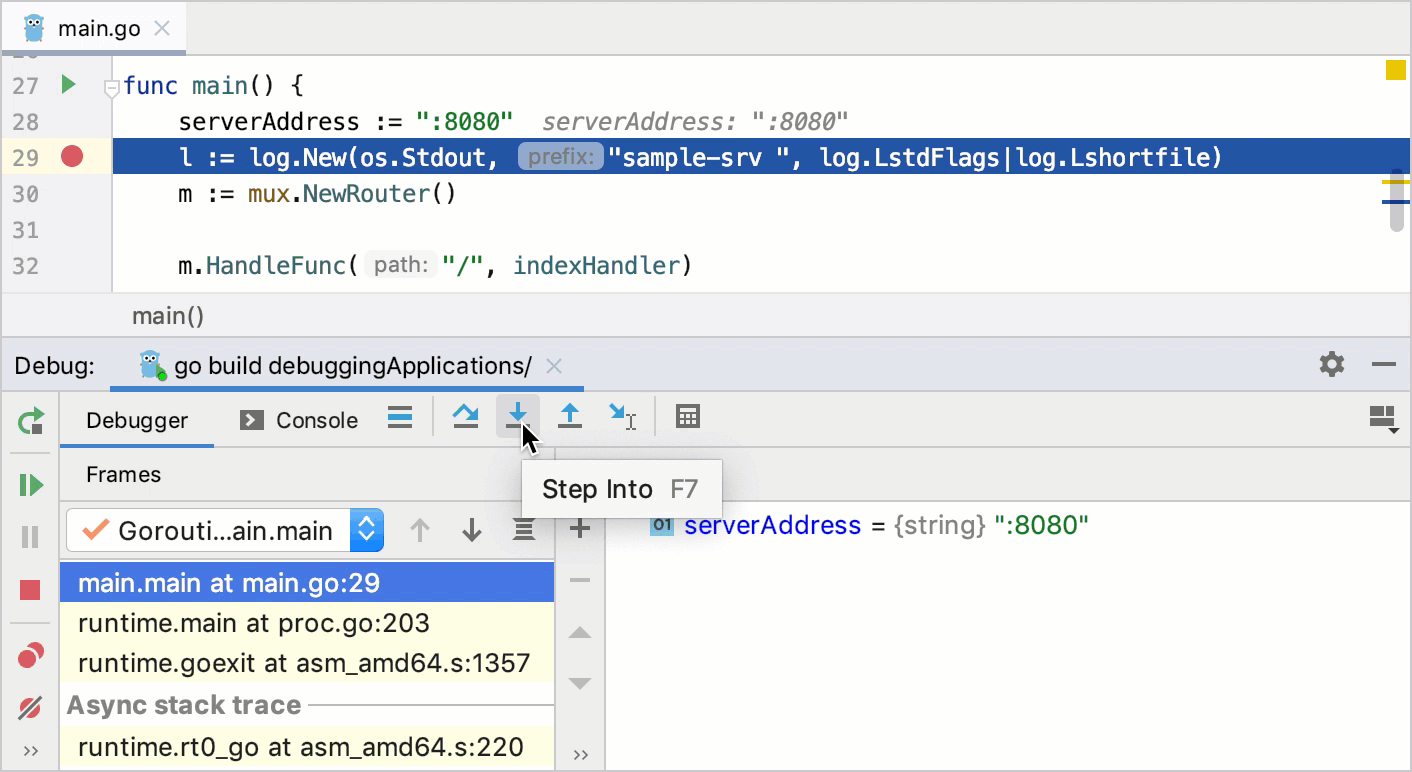
If there are several method calls on the line, GoLand asks you which method to enter. This feature is called Smart step into.
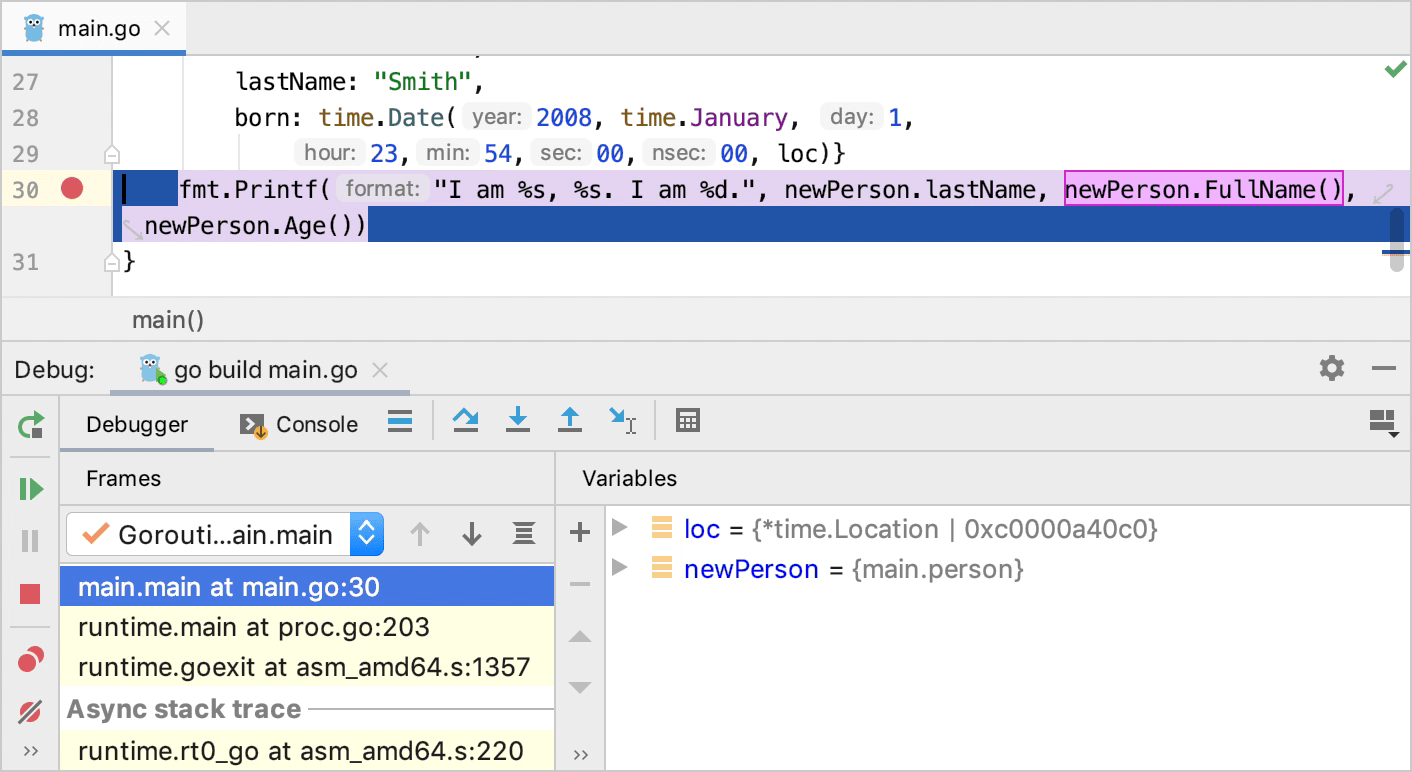
Smart step into
Smart step into is helpful when there are several method calls on a line, and you want to be specific about which method to enter. This feature allows you to select the method call you are interested in.
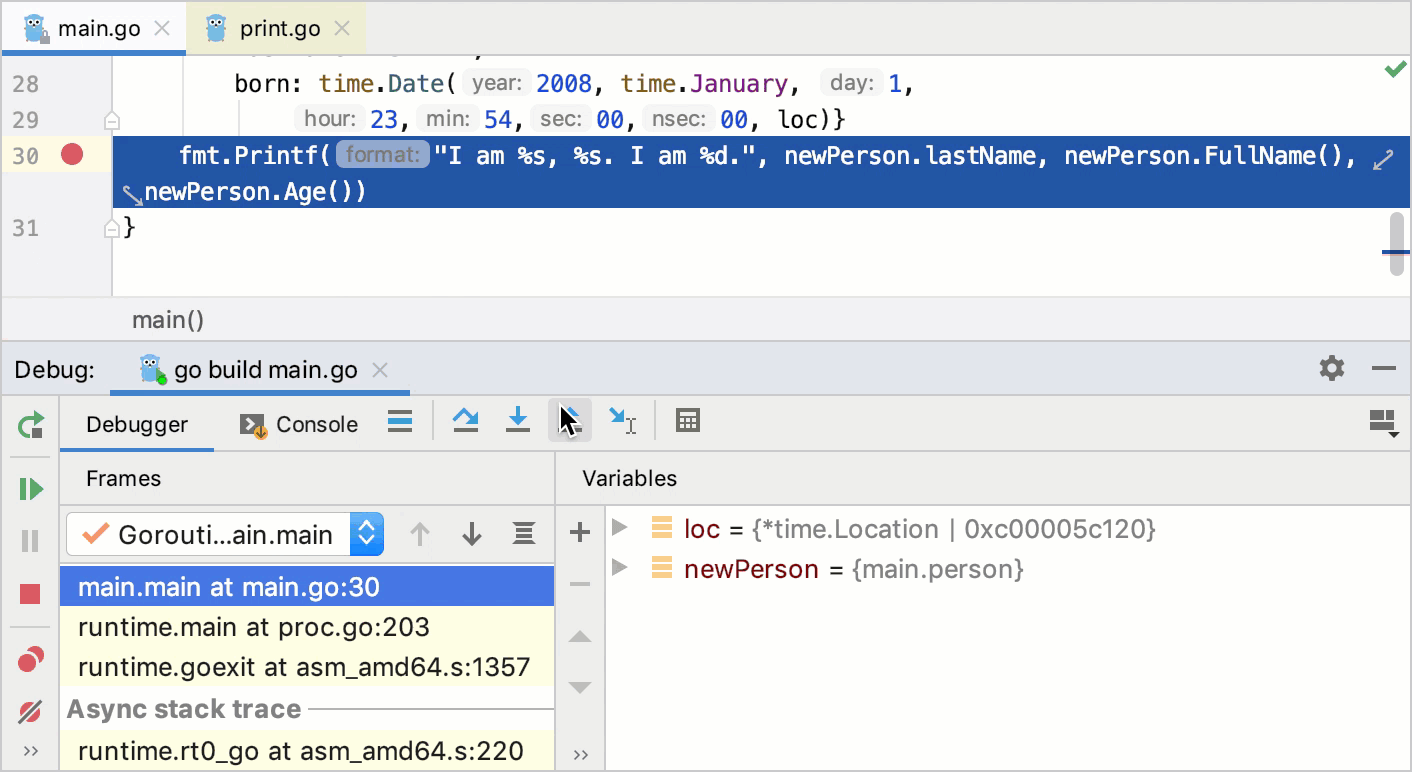
From the main menu, select or press Shift+F7.
Click the method. You can also select it using the arrow keys or tabs and press Enter/ F7.
Step out
Steps out of the current method and takes you to the caller method.
Click the Step out button
 or press Shift+F8.
In the example, stepping out skips all iterations of the loop and takes you straight to the main method (the caller).
Run to cursor
Continues the execution until the position of the caret is reached.
Place the caret at the line where you want the program to pause.
Click the Run to cursor button
 or press Alt+F9.
Also, you can Run to Cursor by clicking the line number in the gutter.
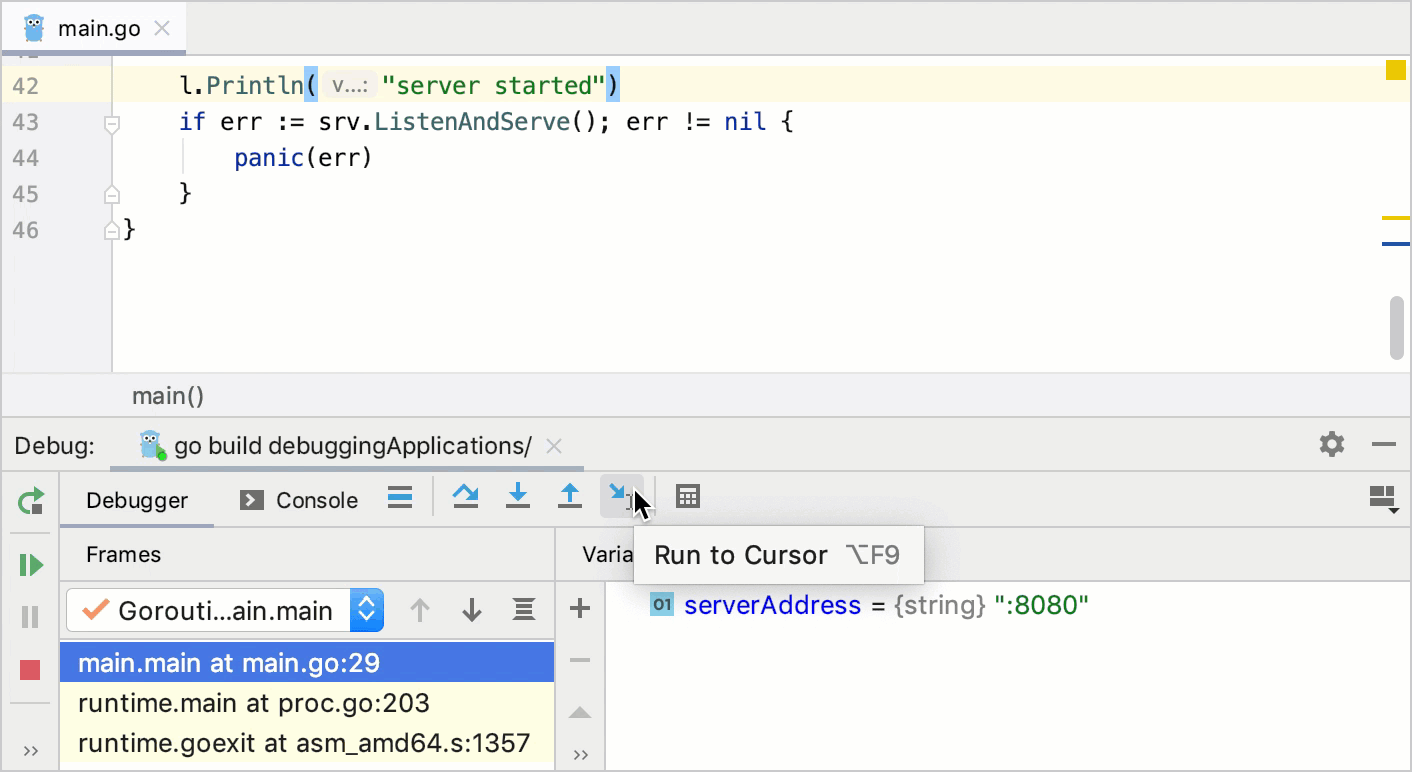
You can configure whether you want Run to Cursor to work on clicking a line number in .
In the example, Run to cursor will continue the execution and stop at line 7 as if there were a breakpoint. If there are breakpoints in the count() method, the program will be suspended there.
To skip any breakpoints on the way, use Force run to cursor.
Force run to cursor
Continues the execution until the position of the caret is reached. All breakpoints on the way are ignored.
Place the caret at the line where you want the program to pause.
From the main menu, select or press Ctrl+Alt+F9.
In the example, Force run to cursor will continue the execution and stop at line 7 as if there were a breakpoint. The breakpoint inside count() will not have any effect.
Force step over
Steps over the current line of code and takes you to the next line even if the highlighted line has method calls in it. If there are breakpoints in the called methods, they are ignored.
From the main menu, select or press Alt+Shift+F8.
When a breakpoint is reached, the Debug tool window becomes active and enables you to get control over the program's execution. For this purpose, you can use the menu commands, or the icons on the stepping toolbar of in the Debug tool window.
Each stepping action advances the execution point to the next execution location, depending on the action you choose.