Mutex profiler
The mutex profiler in Go is based on the pprof package. It tracks contention events for sync.Mutex and sync.RWMutex, showing how much time goroutines spend waiting to acquire a lock. In GoLand, this data is collected using Go’s built-in runtime/pprof mechanisms and is visualized through flame graphs, call trees, and method lists.
Mutex profiling
The mutex profiler helps identify lock contention caused by multiple goroutines competing for shared resources. It shows how often and for how long goroutines are blocked while waiting to acquire a mutex lock.
Example program
The following example simulates multiple goroutines incrementing a shared counter protected by a mutex. Since all goroutines attempt to lock the same mutex, contention quickly builds up:
Although the function correctly counts to n, the heavy contention on the shared mutex causes a significant performance slowdown when many goroutines are running simultaneously.
Create a test for profiling
To measure how much time goroutines spend waiting for the mutex, create a unit test:
Run mutex profiler
Open the _test.go file.
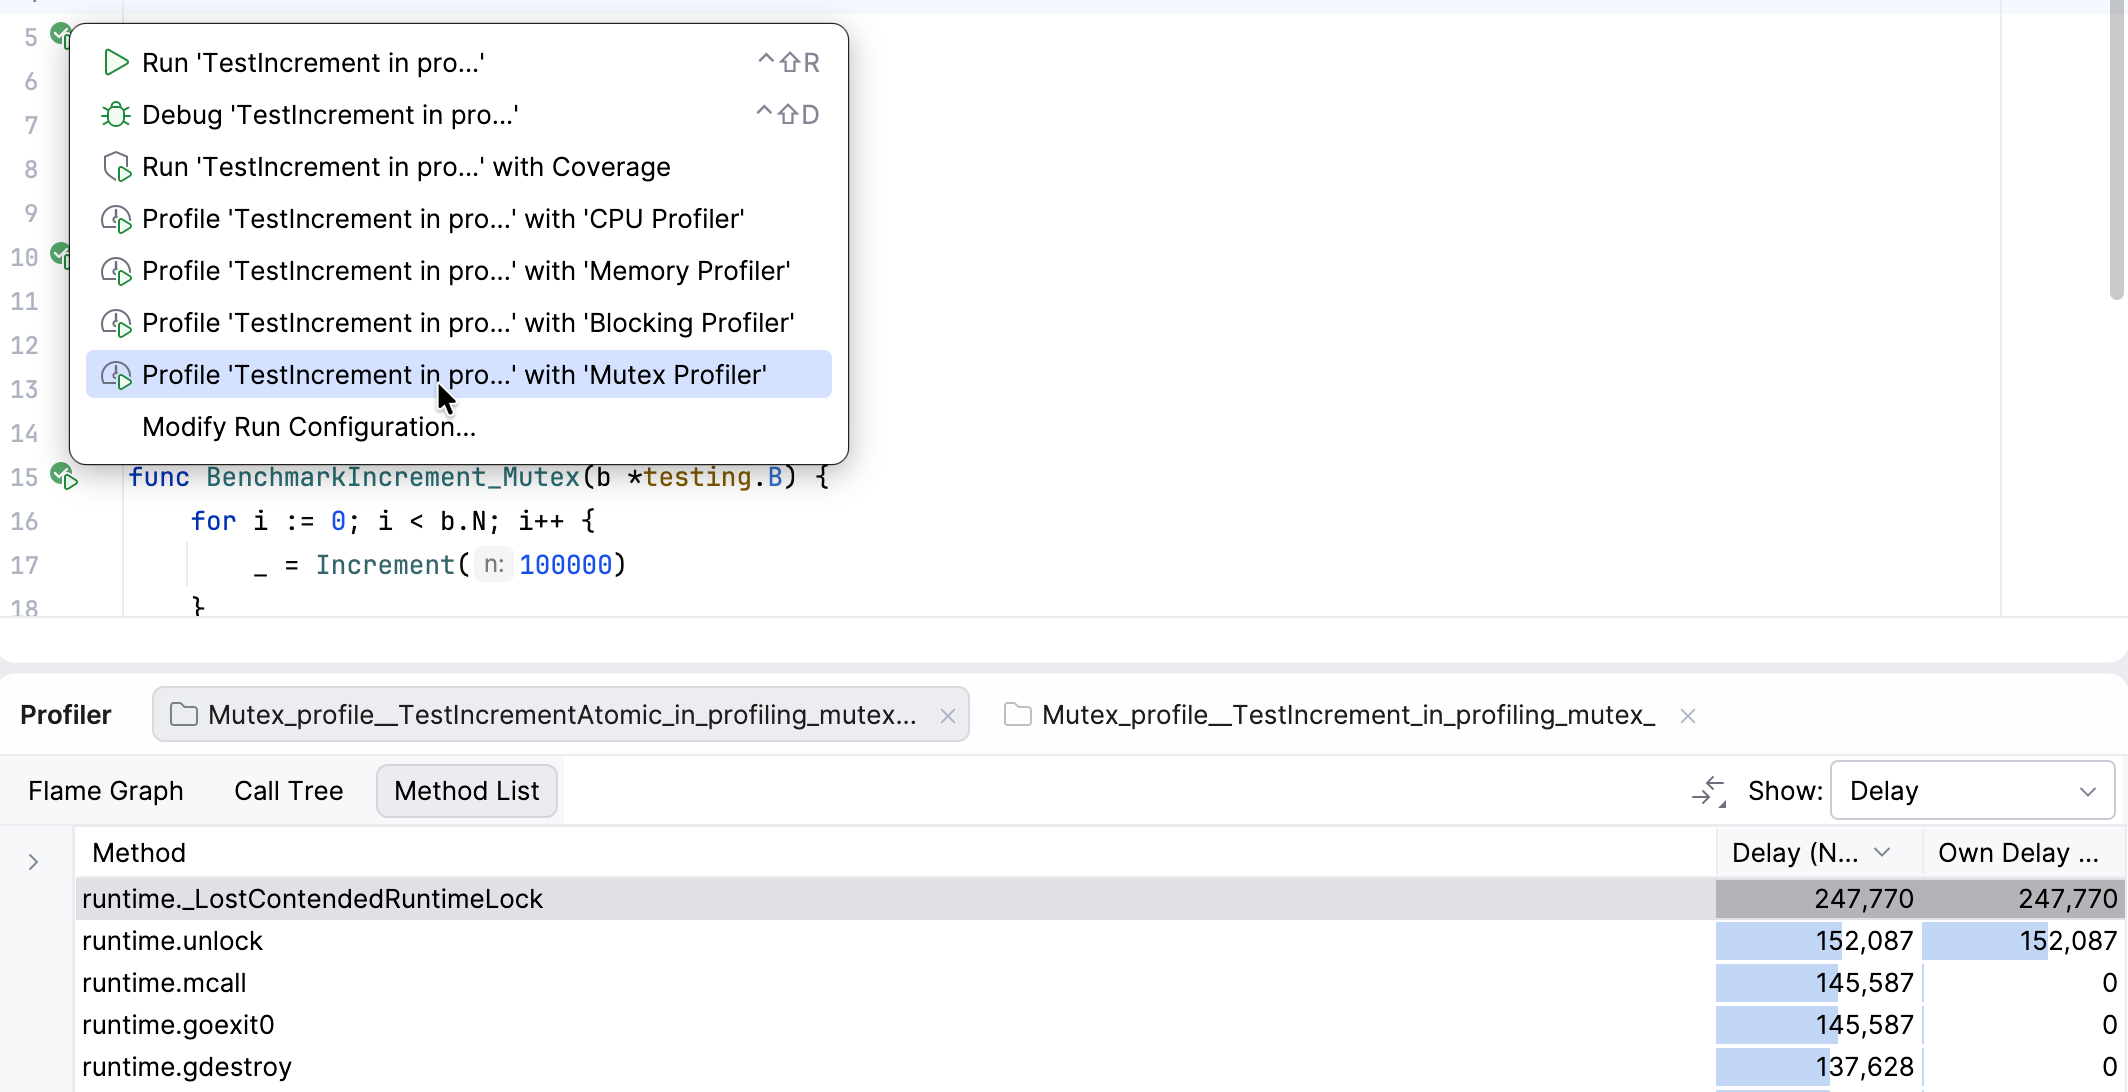
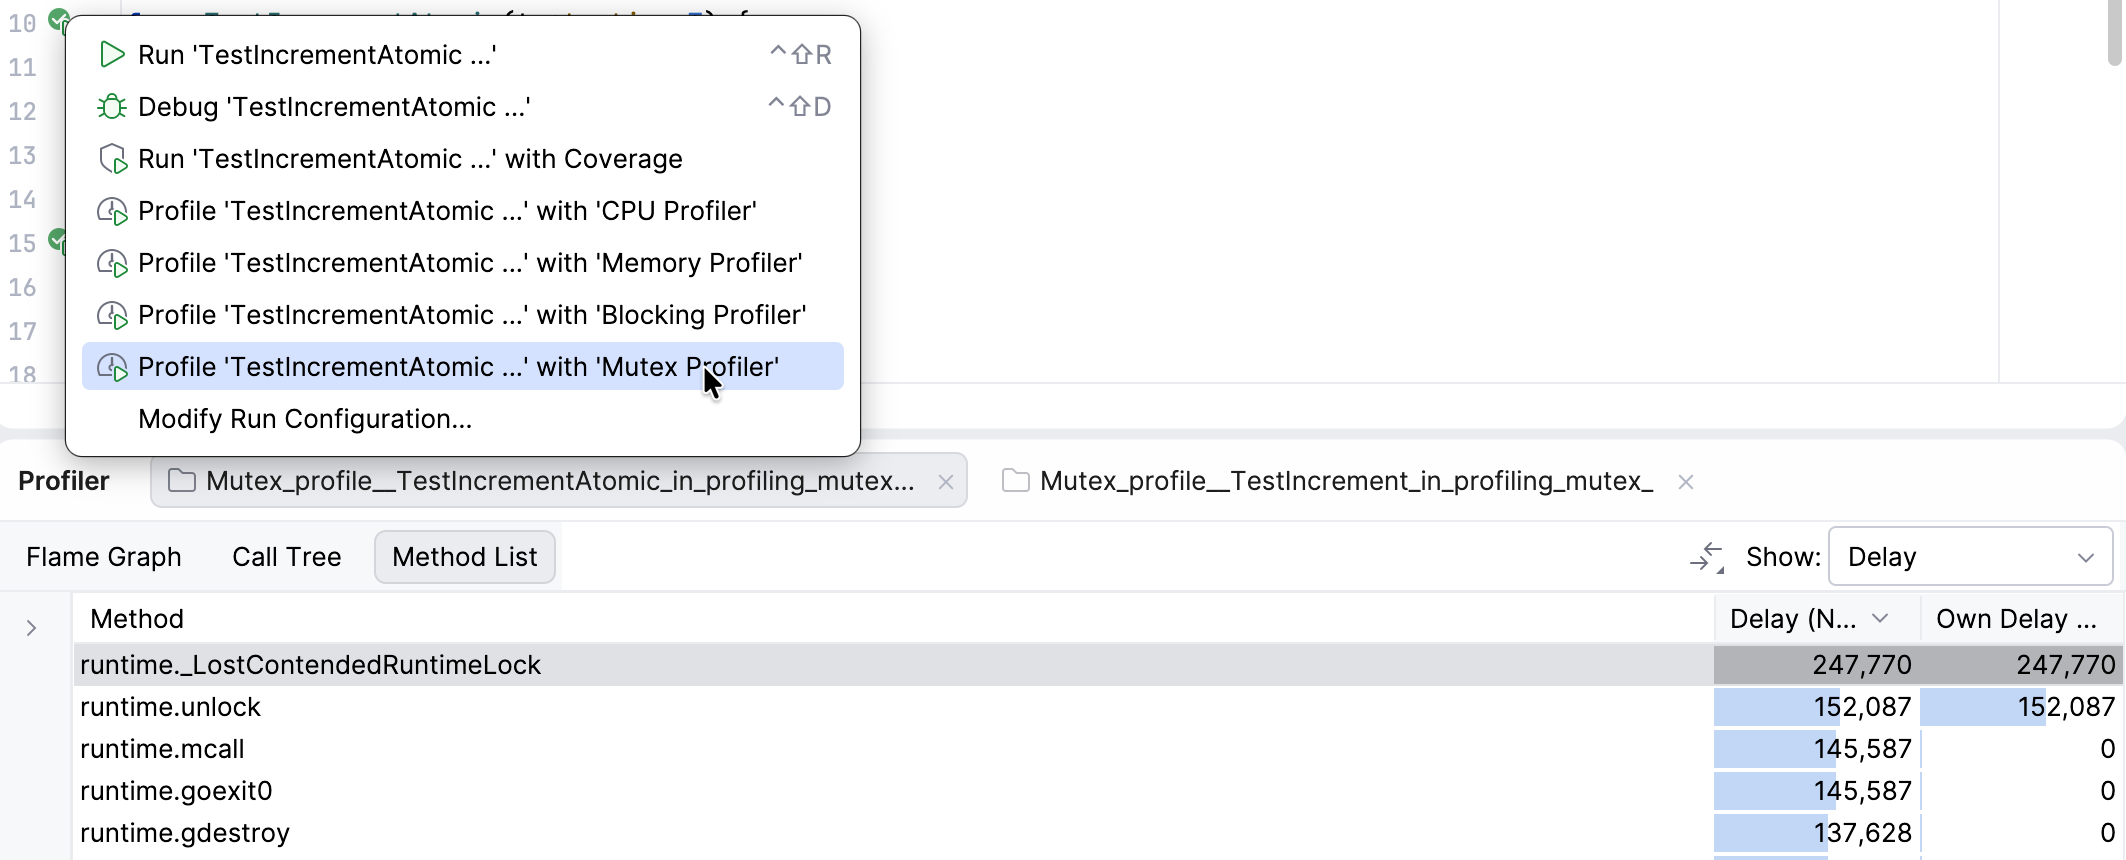
Click the Run icon next to the test function in the gutter.
Select Profile with Mutex Profiler.

Analyze mutex profiling results
GoLand presents mutex profiling data in three views:
Flame graph: displays function calls and the amount of time goroutines spend waiting (not running). Each block represents a function in the call stack. The Y-axis shows stack depth (from bottom to top), while the X-axis displays the stack profile sorted in ascending order — either by the number of delays (Contentions selected) or by the total waiting time (Delay selected).
In the Flame Graph tab, hover over any block to view detailed information.
Call tree: visualizes function calls along with their delay statistics — either by the number of delays (Contentions selected) or by the total waiting time (Delay selected). The data is organized in descending order to highlight the functions contributing most to blocking time. To configure or filter the Call Tree view, use the Presentation Settings button
.
Method list: lists all methods sorted by the number of contentions. The Back Traces tab shows where the selected method was called, while the Merged Callees tab displays call traces that originate from the selected method. Callee List is the method list summarizing the methods down the call hierarchy.
Optimize and compare results
To reduce contention, you can use atomic operations or distribute the workload across multiple locks. The following version uses atomic counters instead of a single mutex:
When you rerun the mutex profiler, the flame graph shows little to no blocking activity, indicating that using atomic operations eliminated lock contention and improved throughput.

Benchmark and compare
Add benchmarks to measure the performance difference between the mutex and atomic versions.
Run benchmarks
Open the benchmark _test.go file.
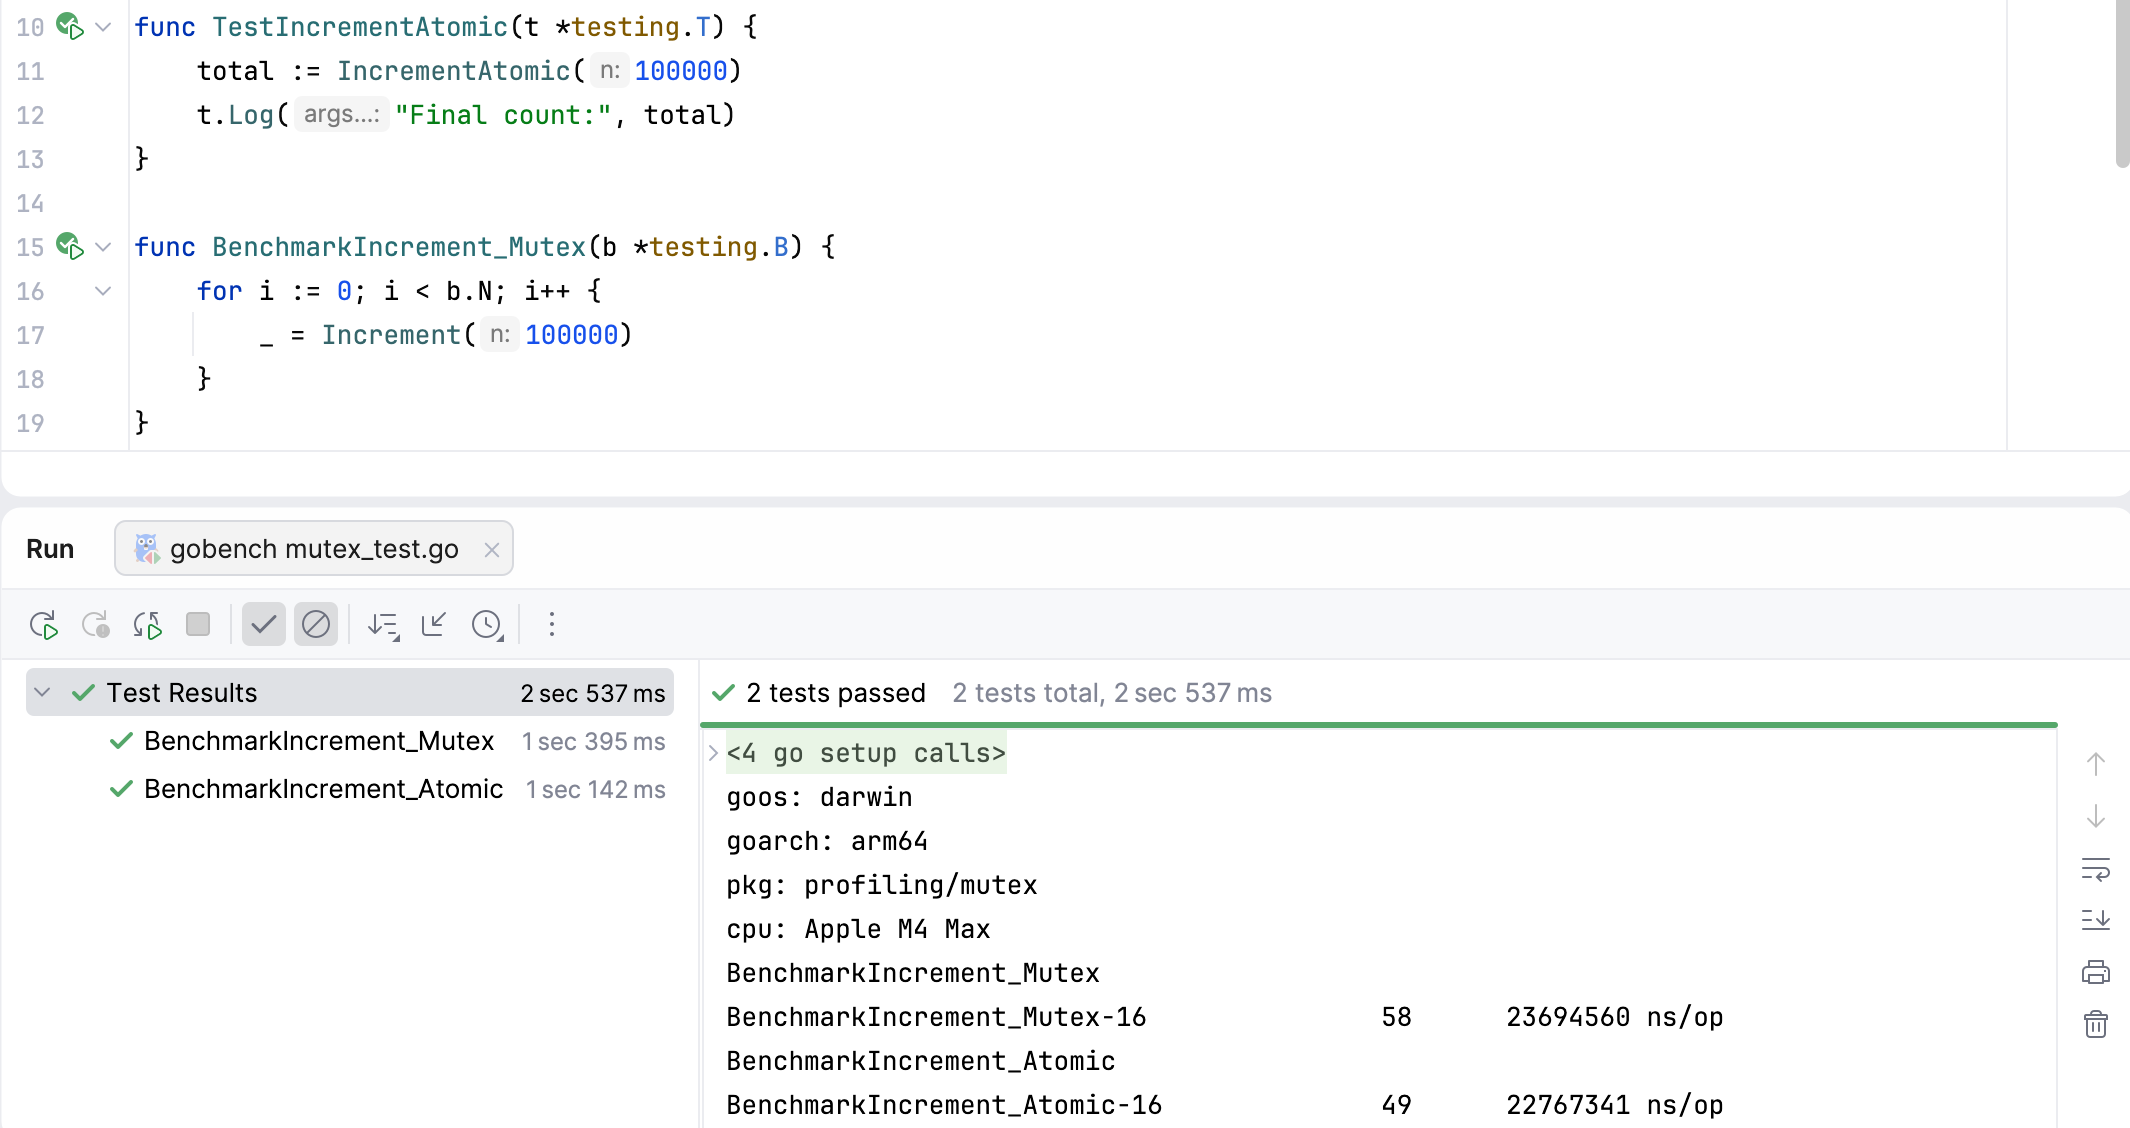
Right-click the test file and navigate to Run | gobench. Alternatively, you can also use a terminal:
go test -bench . -benchmem.
Expected outcome: the atomic version typically completes faster and with fewer allocations, demonstrating higher throughput under high contention. Exact numbers vary by machine and n.