Run and debug Angular applications
Before you start
Download and install Node.js.
Make sure the JavaScript and TypeScript and JavaScript Debugger required plugins are enabled on the Settings | Plugins page, tab Installed. For more information, refer to Managing plugins.
Install the Angular and AngularJS and JavaScript Debugger plugins on the Settings | Plugins page, tab Marketplace, as described in Installing plugins from JetBrains Marketplace.
Run an Angular application
Сlick
 in the gutter next to the
 startscript in package.json, or execute thenpm run startcommand in the Terminal Alt+F12, or double-click thestarttask in the npm tool window ().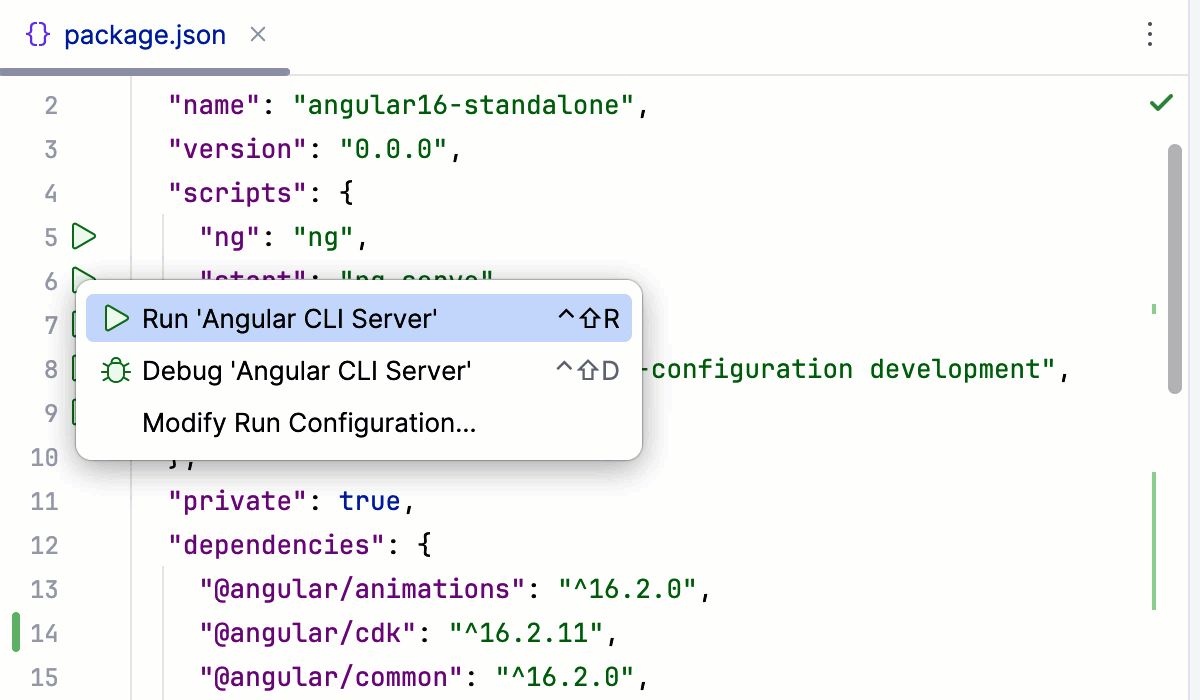
Wait till the application is compiled and the development server is ready.
The Run tool window or the Terminal shows the URL at which your application is running. If your application was generated with @angular/cli, the default URL is http://localhost:4200/. Click this link to view the application.

Run an Angular application via a run/debug configuration
For applications created with Angular CLI in the GoLand New Project wizard as described above, GoLand generates an npm configuration with the default name Angular CLI Server. This configuration runs the ng serve command that launches the development server and starts your application in the development mode.
In other cases, you need to create a run/debug configuration with the actual settings, such as, host, port, etc., manually.
Create an npm run/debug configuration
Go to . Alternatively, select Edit Configurations from the Run widget on the toolbar.

In the Edit Configurations dialog that opens, click the Add button (
 ) on the toolbar and select npm from the list.
 In the Configuration tab of the Run/Debug Configurations: npm dialog that opens, specify the location of the package.json, the Node.js runtime, and the package manager to use.
In the Command field, select run from the list and then select the script to run from the Scripts list. Most likely it will be the default
startscript but you can configure another one in your package.json, for example, to run the application on a custom port.
Optionally:
To open the application in the browser, update the configuration as follows: in the Browser / Live Edit tab, select the After launch checkbox, select the browser to open the application in, and specify the URL address at which the application wil run.
If you are going to debug the application, select Google Chrome or another Chromium-based browser.

Run an application
From the list in the Run widget on the toolbar, select a run configuration of the type npm. This can be the autogenerated Angular CLI Server configuration or a custom one that you created yourself as described above.
Click
 .
.
Wait till the application is compiled and the development server is ready.
The Run tool window or the Terminal shows the URL at which your application is running. If your application was generated with @angular/cli, the default URL is http://localhost:4200/. Click this link to view the application.
Alternatively, enable GoLand to open the application on start as described above.
Debug an Angular application
You can start a debugging session either by launching a run/debug configuration or from the Run tool window that shows the URL at which your application is running in the development mode.
Start debugging via a run/debug configuration
To debug your Angular application, you need two run/debug configurations:
An npm configuration to start your application in the development mode, as described above.
A JavaScript Debug configuration to attach the debugger to the application that is running in the development mode.
You can create a JavaScript Debug configuration within the npm configuration to launch them at once, as described in Run and debug an Angular application with an npm run/debug configuration.
Alternatively, launch an npm and a JavaScript Debug run/debug configurations separately, as described in Start debugging with a JavaScript Debug run/debug configuration.
Run and debug an Angular application with a single npm run/debug configuration
Set the breakpoints in your code.
Create an npm configuration as described above.
In the Configuration tab of the Run/Debug Configurations: npm dialog that opens, specify the location of the package.json, the Node.js runtime, and the package manager to use.
In the Command field, select run from the list and then select the script to run from the Scripts list. Most likely it will be the default
startscript but you can configure another one in your package.json, for example, to run the application on a custom port.In the Browser / Live Edit tab, select the After launch checkbox, select Google Chrome or another Chromium-based browser from the list, select the with JavaScript debugger checkbox, and then specify the URL at which your application will run.

Click Run.
To re-run the configuration, select it from the list in the Run widget and click
next to it.GoLand runs the application in the development mode and at the same time launches a debugging session.

When the first breakpoint is hit, switch to the Debug tool window and proceed as usual: step through the program, stop and resume program execution, examine it when suspended, explore the call stack and variables, set watches, evaluate variables, view actual HTML DOM, and so on.
To ignore source maps and step through the actually executed code, press
 on the toolbar of the Debug tool window.
Start debugging with a JavaScript Debug run/debug configuration
Set the breakpoints in your code.
Start the application in the development mode as described above and wait till the application is compiled and the development server is ready.
The Run tool window or the Terminal shows the URL at which your application is running. Copy this URL to specify it later in the JavaScript Debug configuration.

Create a JavaScript Debug configuration. To do that, go to in the main menu, click
, and select JavaScript Debug from the list.If you generated your application with Angular CLI, as described above, GoLand has already created a JavaScript Debug run/debug configuration with the default name Debug Application and the default URL
http://localhost:4200. Select this run/debug configuration from the list under the JavaScript Debug node.
In the Run/Debug Configurations: JavaScript Debug dialog that opens, specify the name of the configuration and the URL address at which the application is running in the development mode. You can copy this URL in the Run tool window or in the Terminal, as described above.

Click Debug.
To re-run the configuration, select it from the list in the Run widget and click
 next to it.
When the first breakpoint is hit, switch to the Debug tool window and proceed as usual: step through the program, stop and resume program execution, examine it when suspended, explore the call stack and variables, set watches, evaluate variables, view actual HTML DOM, and so on.
To ignore source maps and step through the actually executed code, press
on the toolbar of the Debug tool window.
Start debugging from the Run tool window or from the built-in Terminal
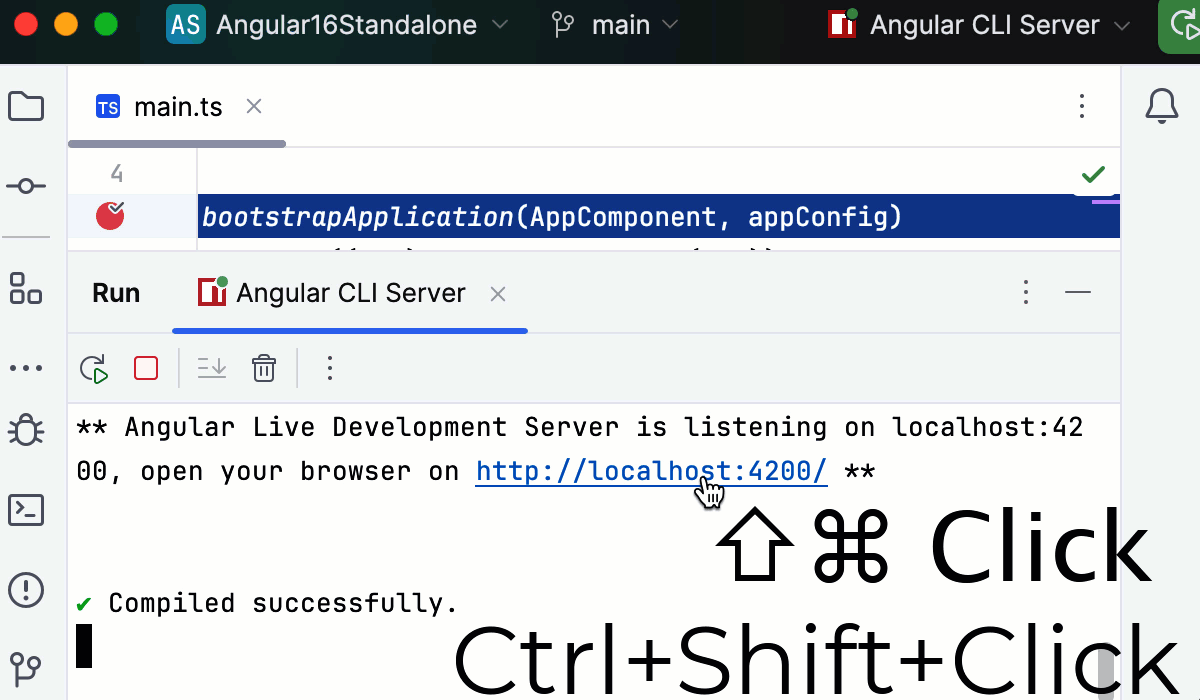
If your application is running in the development mode on localhost, in particular, if it was generated with Angular CLI, you can launch a debugging session right from the >Run tool window or from the built-in Terminal.
Set the breakpoints in your code.
Start the application in the development mode as described above and wait till the application is compiled and the development server is ready.
The Run tool window or the Terminal shows the URL at which your application is running. If your application was generated with @angular/cli, the default URL is http://localhost:4200/. Hold Ctrl+Shift and click this URL link. GoLand starts a debugging session with an automatically generated Angular Application configuration of the type JavaScript Debug.
Alternatively, select the autogenerated Angular Application configuration from the list and click the Debug button
next to the list.If you launched your application in the development mode from the New Terminal, you can just click the Start debugging in browser button next to the link.

By default, the button is not shown. To have it displayed, open the Settings dialog (Ctrl+Alt+S) , go to , and select the Show 'Start Debugging in Browser' button for localhost links in the Terminal checkbox in the JavaScript and TypeScript area.
When the first breakpoint is hit, switch to the Debug tool window and proceed as usual: step through the program, stop and resume program execution, examine it when suspended, explore the call stack and variables, set watches, evaluate variables, view actual HTML DOM, and so on.
To ignore source maps and step through the actually executed code, press ![]() on the toolbar of the Debug tool window.
on the toolbar of the Debug tool window.
Troubleshooting for Node.js 17+
If you are using Node.js version 17 or later, during a debugging session you may face network connectivity issues that result in problems with attaching the debugger or with loading sourcemaps.
The workaround is to pass --host 127.0.0.1 to the server by updating the start script in your package.json as follows: