Troubleshooting
If you stumble upon a problem while working with IDE Services, make sure to contact the IDE Services support team. If possible, we recommend including the following information in your report:
Screenshots or a screencast demonstrating the problem in the user interface
Logs from the Toolbox App and your IDE
A tbe_diagnostics.json file from your IDE
Server-side logs
Logs and diagnostic data
How to collect Toolbox App logs?
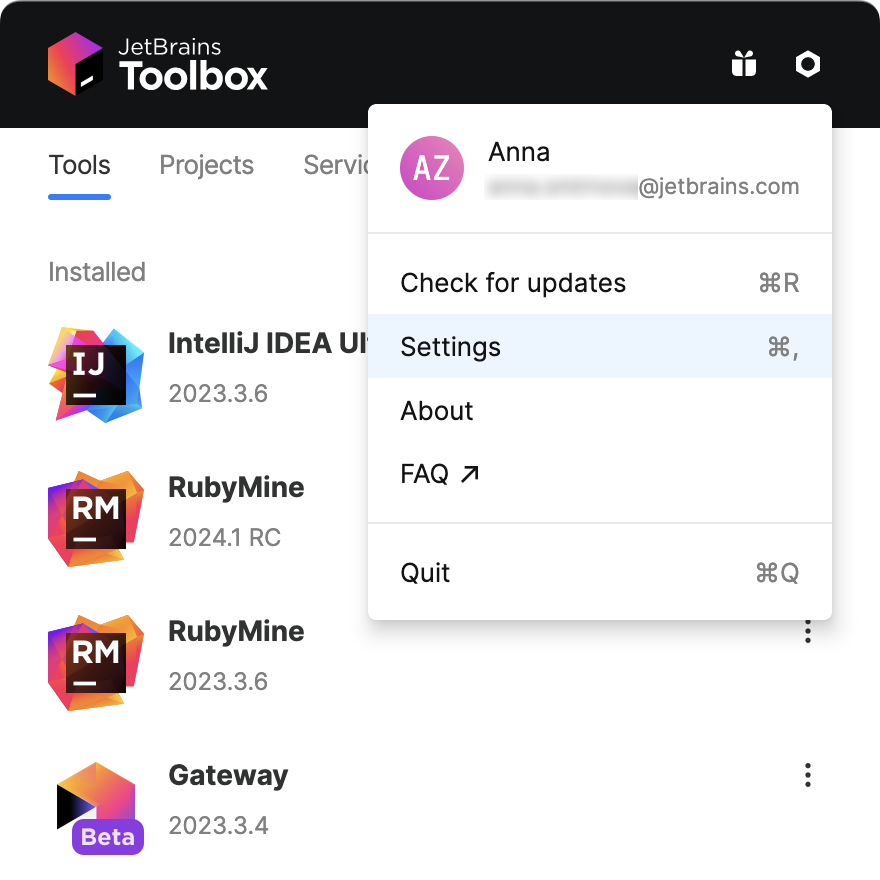
In the Toolbox App, click the locknut icon in the upper right corner and select Settings Ctrl+Alt+S.

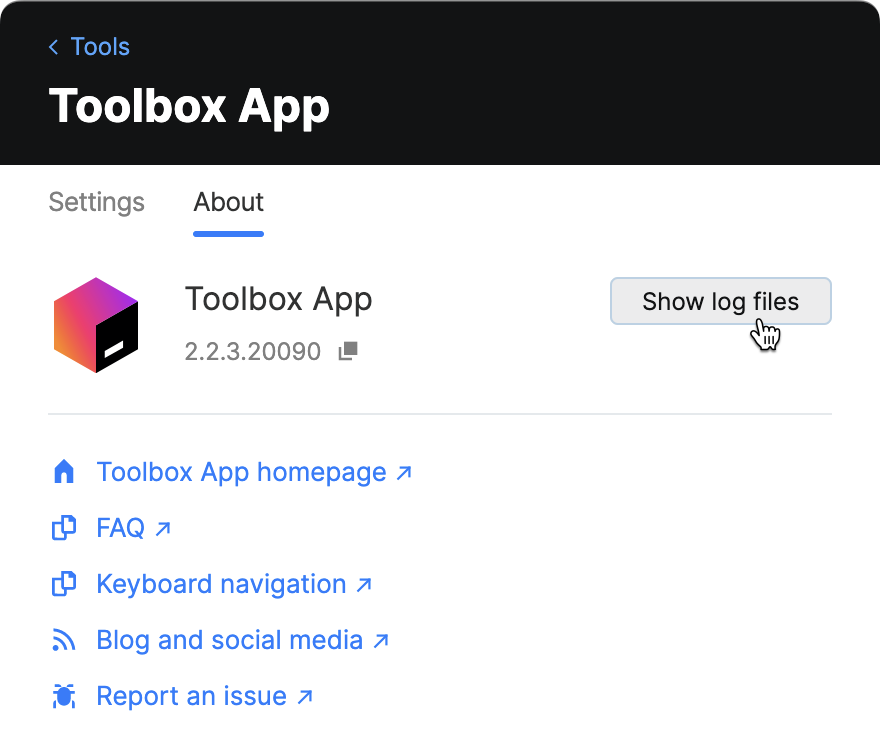
Navigate to the About tab and click the Show log files button.

As an alternative, you can find Toolbox App logs in your file system:
macOS:
~/Library/Logs/JetBrains/Toolbox/Windows:
<SYSTEM_DRIVE>\Users\<USER_ACCOUNT_NAME>\AppData\Local\JetBrains\Toolbox\logsLinux:
~/.local/share/JetBrains/Toolbox/logs/
How to collect IDE logs?
The log file is called idea.log and is rotated based on its size. When submitting an issue, it's recommended to zip and attach the most recent log files.
Navigate to the product log file from the IDE
From the main menu, select Help and choose one of the following menu items:
Show Log in Explorer (for Windows and Linux)
Show Log in Finder (for macOS)
As an alternative, you can find IDE logs in your file system:
macOS:
~/Library/Logs/JetBrains/<IDE_NAME_AND_VERSION>Windows:
%LOCALAPPDATA%\JetBrains\<IDE_NAME_AND_VERSION>\logLinux:
~/.cache/JetBrains/<IDE_NAME_AND_VERSION>/log
How to collect IDE Services diagnostic data in IDEs?
In your IDE, press Shift twice to open the Search Everywhere dialog.
Start typing
Collect JetBrains IDE Services Diagnostics Dataand select the action from the list.
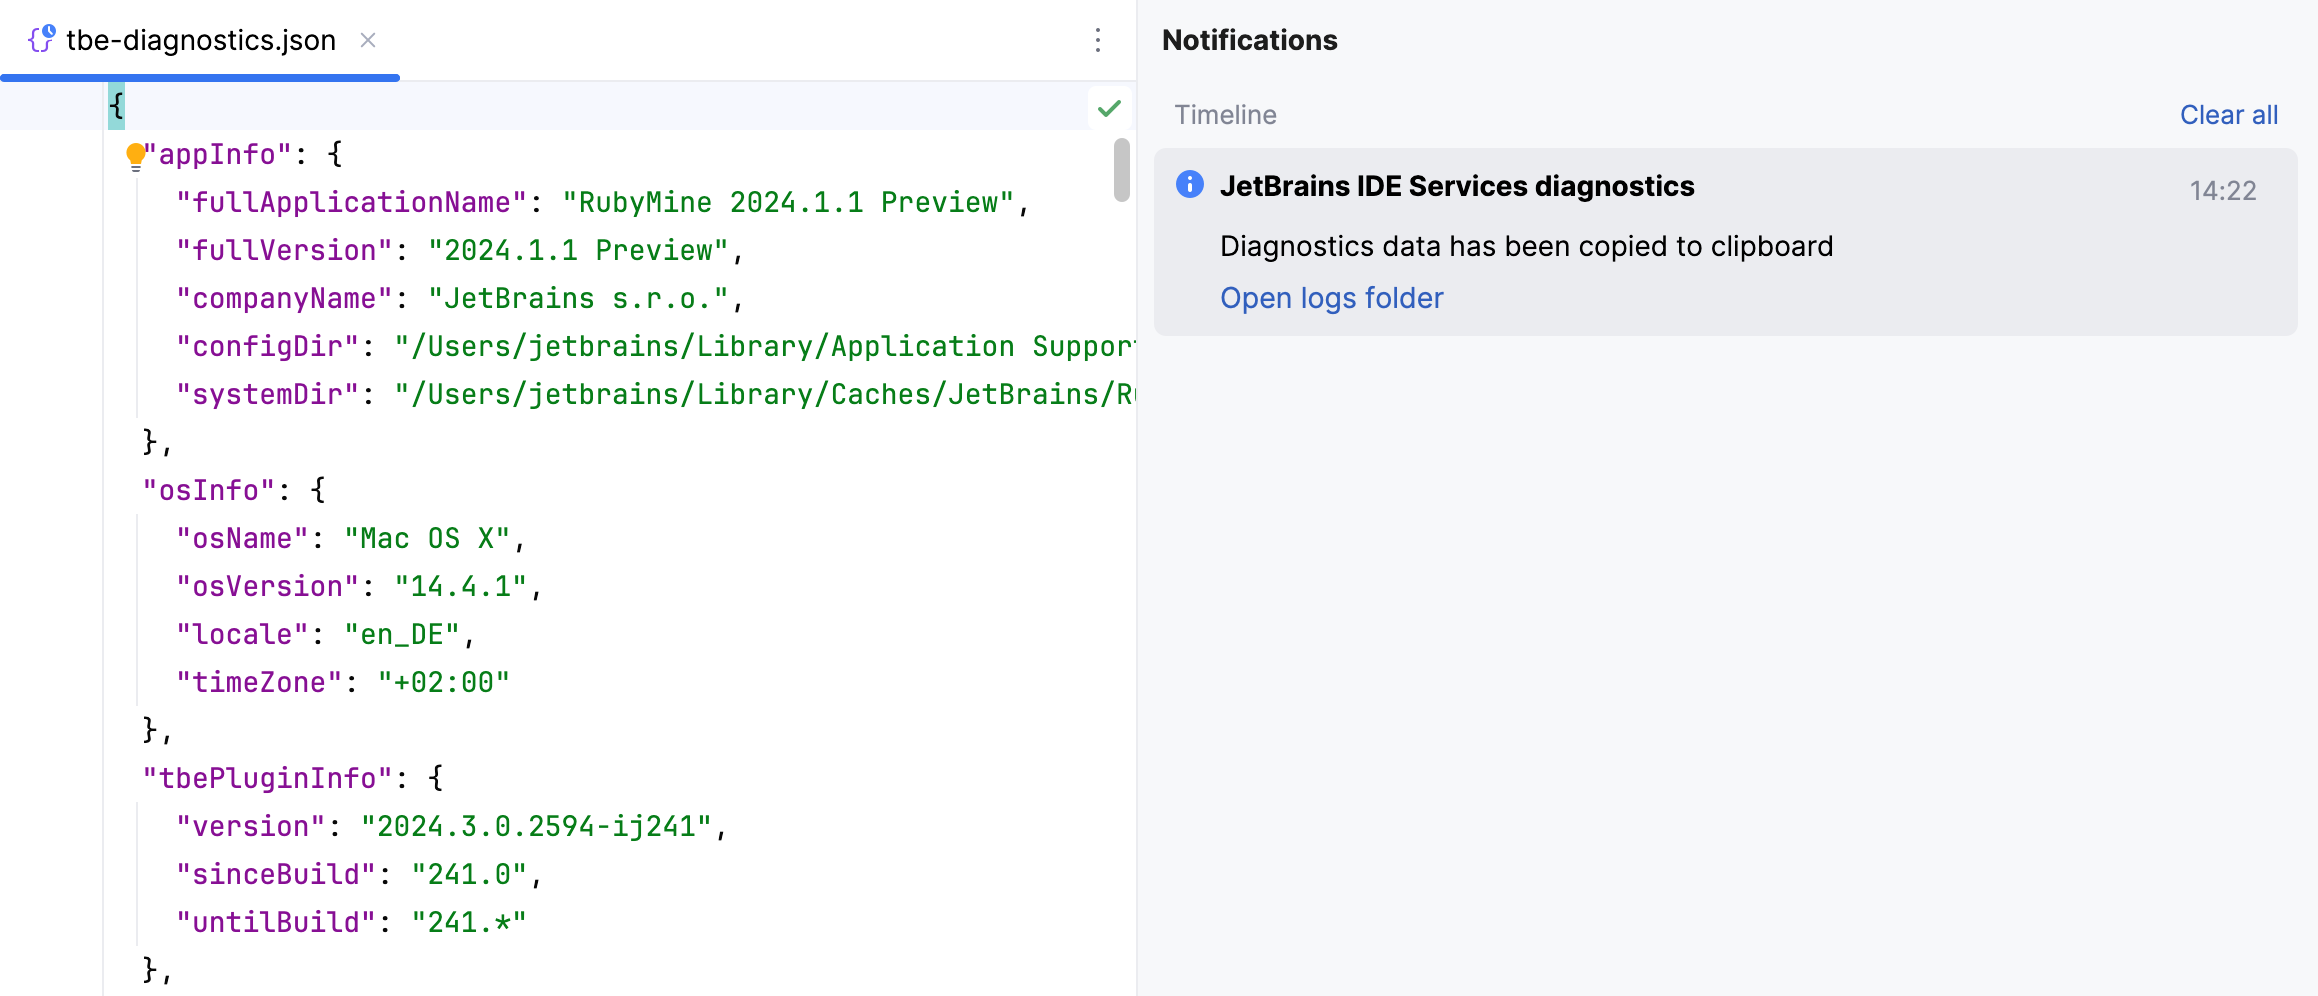
Your IDE will create a scratch tbe-diagnostics.json file, open it in the editor, and copy its contents to the clipboard.

How to collect server-side logs?
Depending on the deployment option in use, provide the support team with the following information:
Cloud deployment (AWS, GoogleCloud, Azure)
The cloud log processor output for the necessary time period
Kubernetes (on premises)
The time-series log offload from your centralized logging solution (Grafana, Prometheus, Datadog, and so on)
If no logging solution is present, run the following command to collect logs:
kubectl logs <IDE_Services_pods>
Docker (on premises)
The Stream container output exported to a file
Alternatively, run the following command:
docker logs <container_id>To obtain the container ID, run the following command:
docker ps
How to change the application's logging level?
The support team may ask you to change the logging level of your application to gain more insights.
In your server configuration file, change the logging configuration as follows:
logging level: root: INFO # can be changed to WARN/DEBUG/TRACElogging level: root: INFO # can be changed to WARN/DEBUG/TRACE