Compile and build applications with IntelliJ IDEA
The IntelliJ IDEA compilation and building process compiles source files and brings together external libraries, properties files, and configurations to produce a living application. IntelliJ IDEA uses a compiler that works according to the Java specification.
You can compile a single file, use the incremental build for a module or a project, and rebuild a project from scratch.
If you have a pure Java or a Kotlin project we recommend that you use IntelliJ IDEA to build your project since IntelliJ IDEA supports the incremental build which significantly speeds up the building process.
However, IntelliJ IDEA native builder might not correctly build the Gradle or Maven project if its build script file uses custom plugins or tasks. In this case, the build delegation to Gradle or Maven can help you build your project correctly.
Compile a single file or class
Open the needed file in the editor and go to (Ctrl+Shift+F9) in the main menu.
Alternatively, in the Project tool window, right-click the class you need and from the context menu, select Recompile 'class name'.
If errors occur during the compilation process, IntelliJ IDEA will display them in the Review compilation and build output along with warning messages.
Change the compilation output locations
When you compile your source code, IntelliJ IDEA automatically creates an output directory that contains compiled .class files.

Inside the output directory, IntelliJ IDEA also creates subdirectories for each of your modules.
The default paths for subdirectories are as follows:
Sources: <ProjectFolder>/out/production/<ModuleName>
Tests: <ProjectFolder>/out/test/<ModuleName>
At the project level, you can change the <ProjectFolder>/out part of the output path. If you do so (say, specify some <OutputFolder> instead of <ProjectFolder>/out) but don't redefine the paths at the module level, the compilation results will go to <OutputFolder>/production/<ModuleName> and <OutputFolder>/test/<ModuleName>.
At the module level, you can specify any desirable compilation output location for the module sources and tests individually.
Specify compilation output folders
Open the Project Structure dialog (File | Project Structure Ctrl+Alt+Shift+S).
In Project Settings, select Project and in the Project compiler output field, specify the corresponding path.

For modules, select Modules, the module you need and the Paths tab. Change the location of the output folder under the Compiler output section.

Build
When you execute the Build ![]() command, IntelliJ IDEA compiles all the classes inside your build target and places them inside the output directory.
command, IntelliJ IDEA compiles all the classes inside your build target and places them inside the output directory.
When you change any class inside the build target and then execute the build action, IntelliJ IDEA performs the incremental build that compiles only the changed classes. IntelliJ IDEA also recursively builds the classes' dependencies.
Build a module, or a project
Select a module or a project you want to compile and go to (Ctrl+F9).
IntelliJ IDEA displays the compilation results in the Review compilation and build output.
If you add a module dependency to your primary module and build the module, IntelliJ IDEA builds the dependent module as well and displays it in the output directory alongside the primary one. If the dependent module has its own module dependencies, then IntelliJ IDEA compiles all of them recursively starting with the least dependent module.

The way the module dependencies are ordered may be very important for the compilation to succeed. If any two JAR files contain classes with the same name, the IntelliJ IDEA compiler will use the classes from the first JAR file it locates in the classpath.
For more information, refer to Module dependencies.
Rebuild
When you execute a rebuild command, IntelliJ IDEA cleans out the entire output directory, deletes the build caches and builds a project, or a module from scratch. It might be helpful when the classpath entries have changed. For example, SDKs or libraries that the project uses are added, removed or altered.
Rebuild a module, or a project
In the main menu, go to for the entire project or for the module rebuild.
IntelliJ IDEA displays the build results in the Review compilation and build output.
Background compilation (auto-build)
You can configure IntelliJ IDEA to build your project automatically, every time you make changes to it. The results of the background compilation are displayed in the Problems tool window.
Configure the background compilation
Press Ctrl+Alt+S to open settings and then select .
On the Compiler page, select Build project automatically.
Now when you make changes in the class files, IntelliJ IDEA automatically performs the incremental build of the project.
The automatic build also gets triggered when you save the file (Ctrl+S) or when you have the Save files automatically if application is idle for N sec. option selected in the System settings dialog.
Compile before running
By default, when you run an application, IntelliJ IDEA compiles the module in which the classes you are trying to run are located.
If you want to change that behavior, you can do so in the Run/Debug Configurations dialog.
Configure a run/debug configuration
In the main menu, go to .
In the dialog that opens, create a new or open an existing run configuration.
Click the Modify options link.
In the Add Run Options list, under the Before Launch section, select Add before launch task. The list of tasks becomes available and the Build will be selected. Click
 to disable it.
If you need to add a new configuration action, click
 and from the list that opens, select the desired option.
For example, if you select Build Project then IntelliJ IDEA will build the whole project before the run. In this case, the dependencies that were not included in the build with the Build action, will be accounted for. If you select the Build, no error check option, IntelliJ IDEA will run the application even if there are errors in the compilation results.

Review compilation and build output
IntelliJ IDEA reports compilation and building results in the Build tool window, which displays messages about errors and warnings as well as successful steps of compilation.

If you configured an auto-build, then IntelliJ IDEA uses the Problems tool window for messages. The window is available even if the build was executed successfully. To open it, click Auto-build on the status bar.

Double-click a message to jump to the problem in the source code. If you need to adjust the compiler settings, click ![]() .
.
Package an application into a JAR
When the code is compiled and ready, you can package your application in a Java archive (JAR) to share it with other developers. A built Java archive is called an artifact.
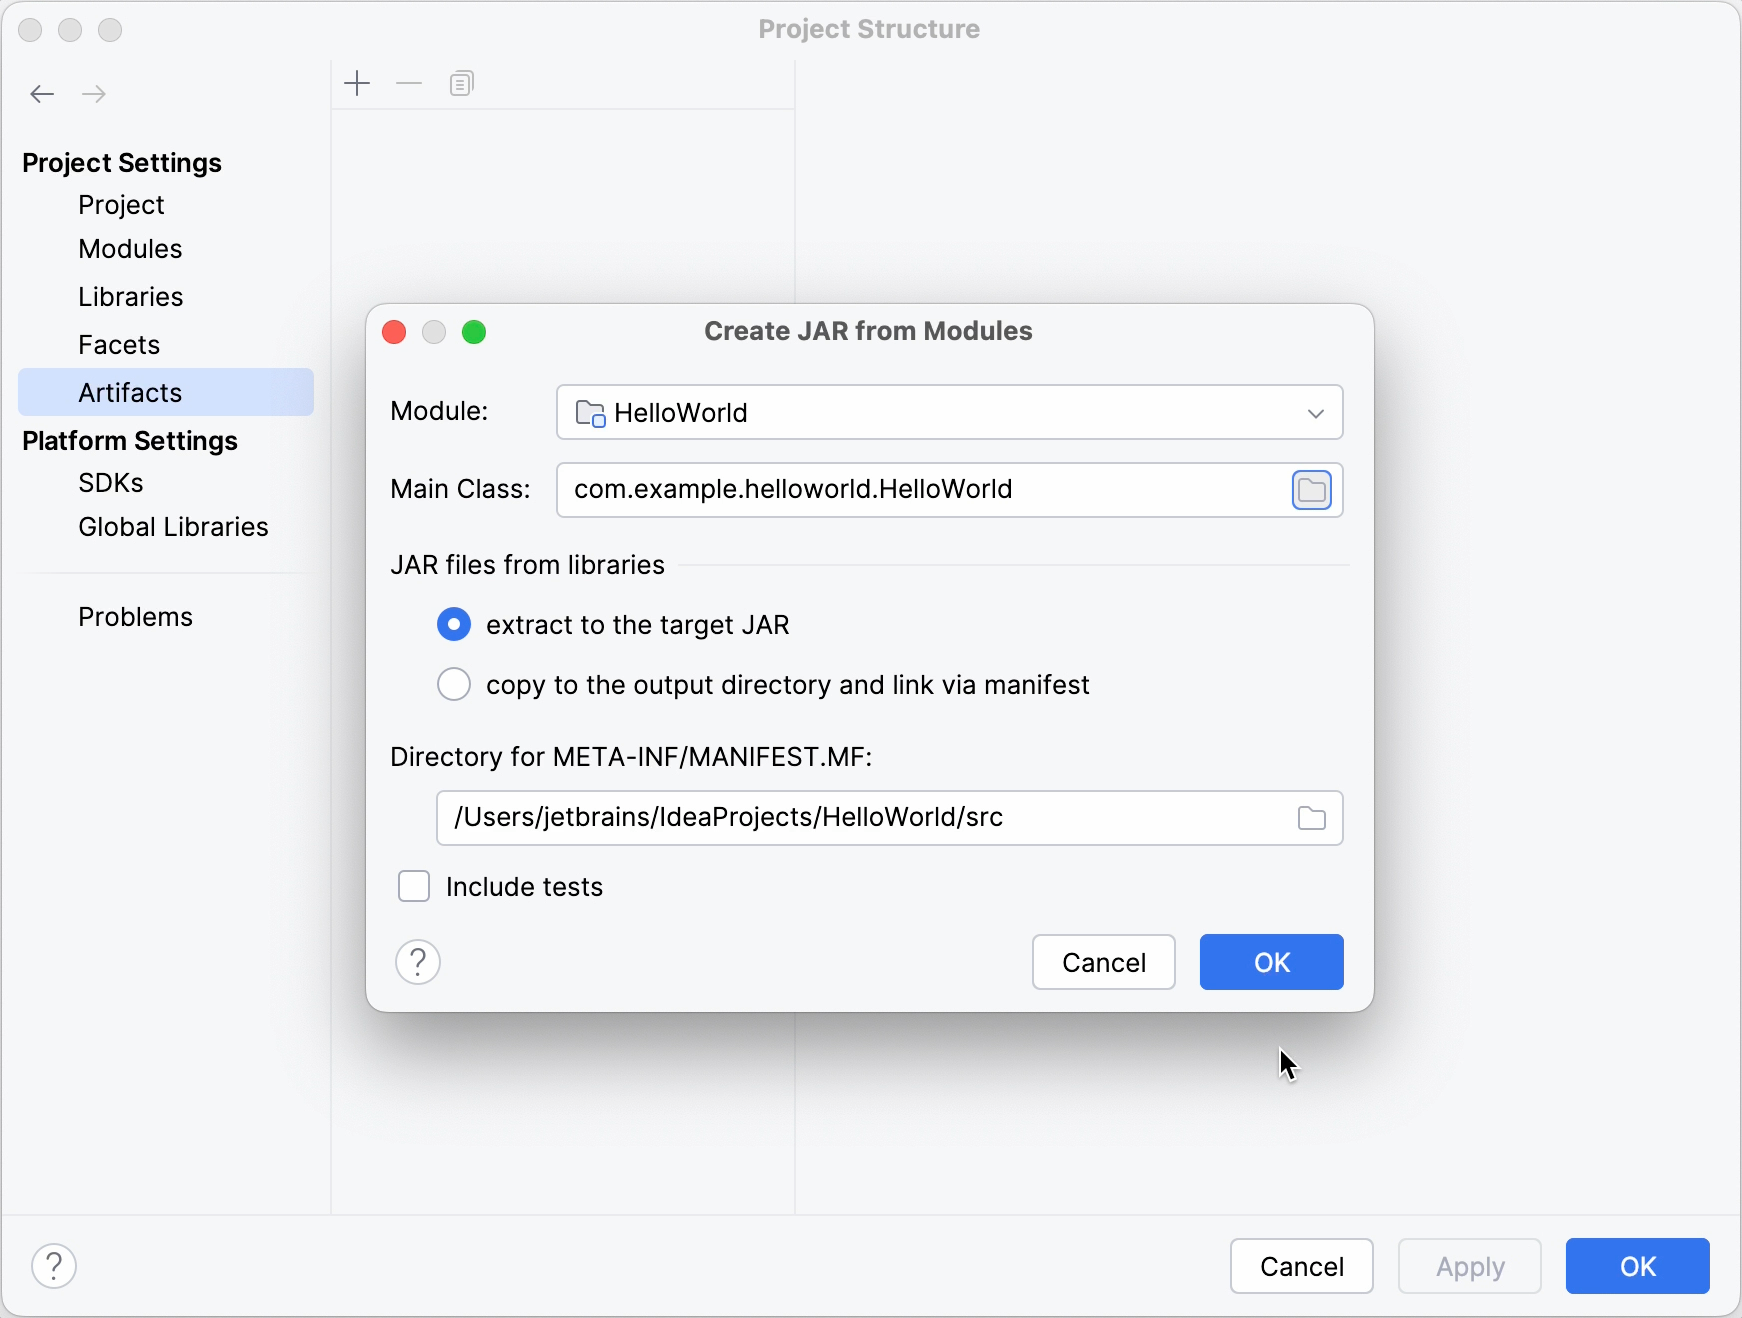
Create an artifact configuration for the JAR
In the main menu, go to File | Project Structure Ctrl+Alt+Shift+S and click Artifacts.
Click
, point to JAR, and select From modules with dependencies.To the right of the Main Class field, click
 and select the main class in the dialog that opens (for example, HelloWorld (com.example.helloworld)).
IntelliJ IDEA creates the artifact configuration and shows its settings in the right-hand part of the Project Structure dialog.
Apply the changes and close the dialog.
Build the JAR artifact
In the main menu, go to Build | Build Artifacts.
Point to the created .jar (HelloWorld:jar) and select Build.
If you now look at the out/artifacts folder, you'll find your .jar file there.

When you're building a project, resources stored in the Resources root are copied into the compilation output folder by default. If necessary, you can specify another directory within the output folder to place resources.
Add other files to a JAR artifact
You can add other files to a JAR artifact. For example, you can add some image files, configuration files, and JAR files.
Add a file to a JAR artifact
In the main menu, go to File | Project Structure Ctrl+Alt+Shift+S and click Artifacts.
Under Output Layout, click
.From the context menu, select File.
In the dialog that opens, locate the file, add it and click OK.
In the main menu, go to Build | Build Artifacts.
Point to the created .jar and select Build.
The built JAR artifact includes the added files.
Run a packaged JAR
To run a Java application packaged in a JAR, IntelliJ IDEA allows you to create a dedicated run configuration.
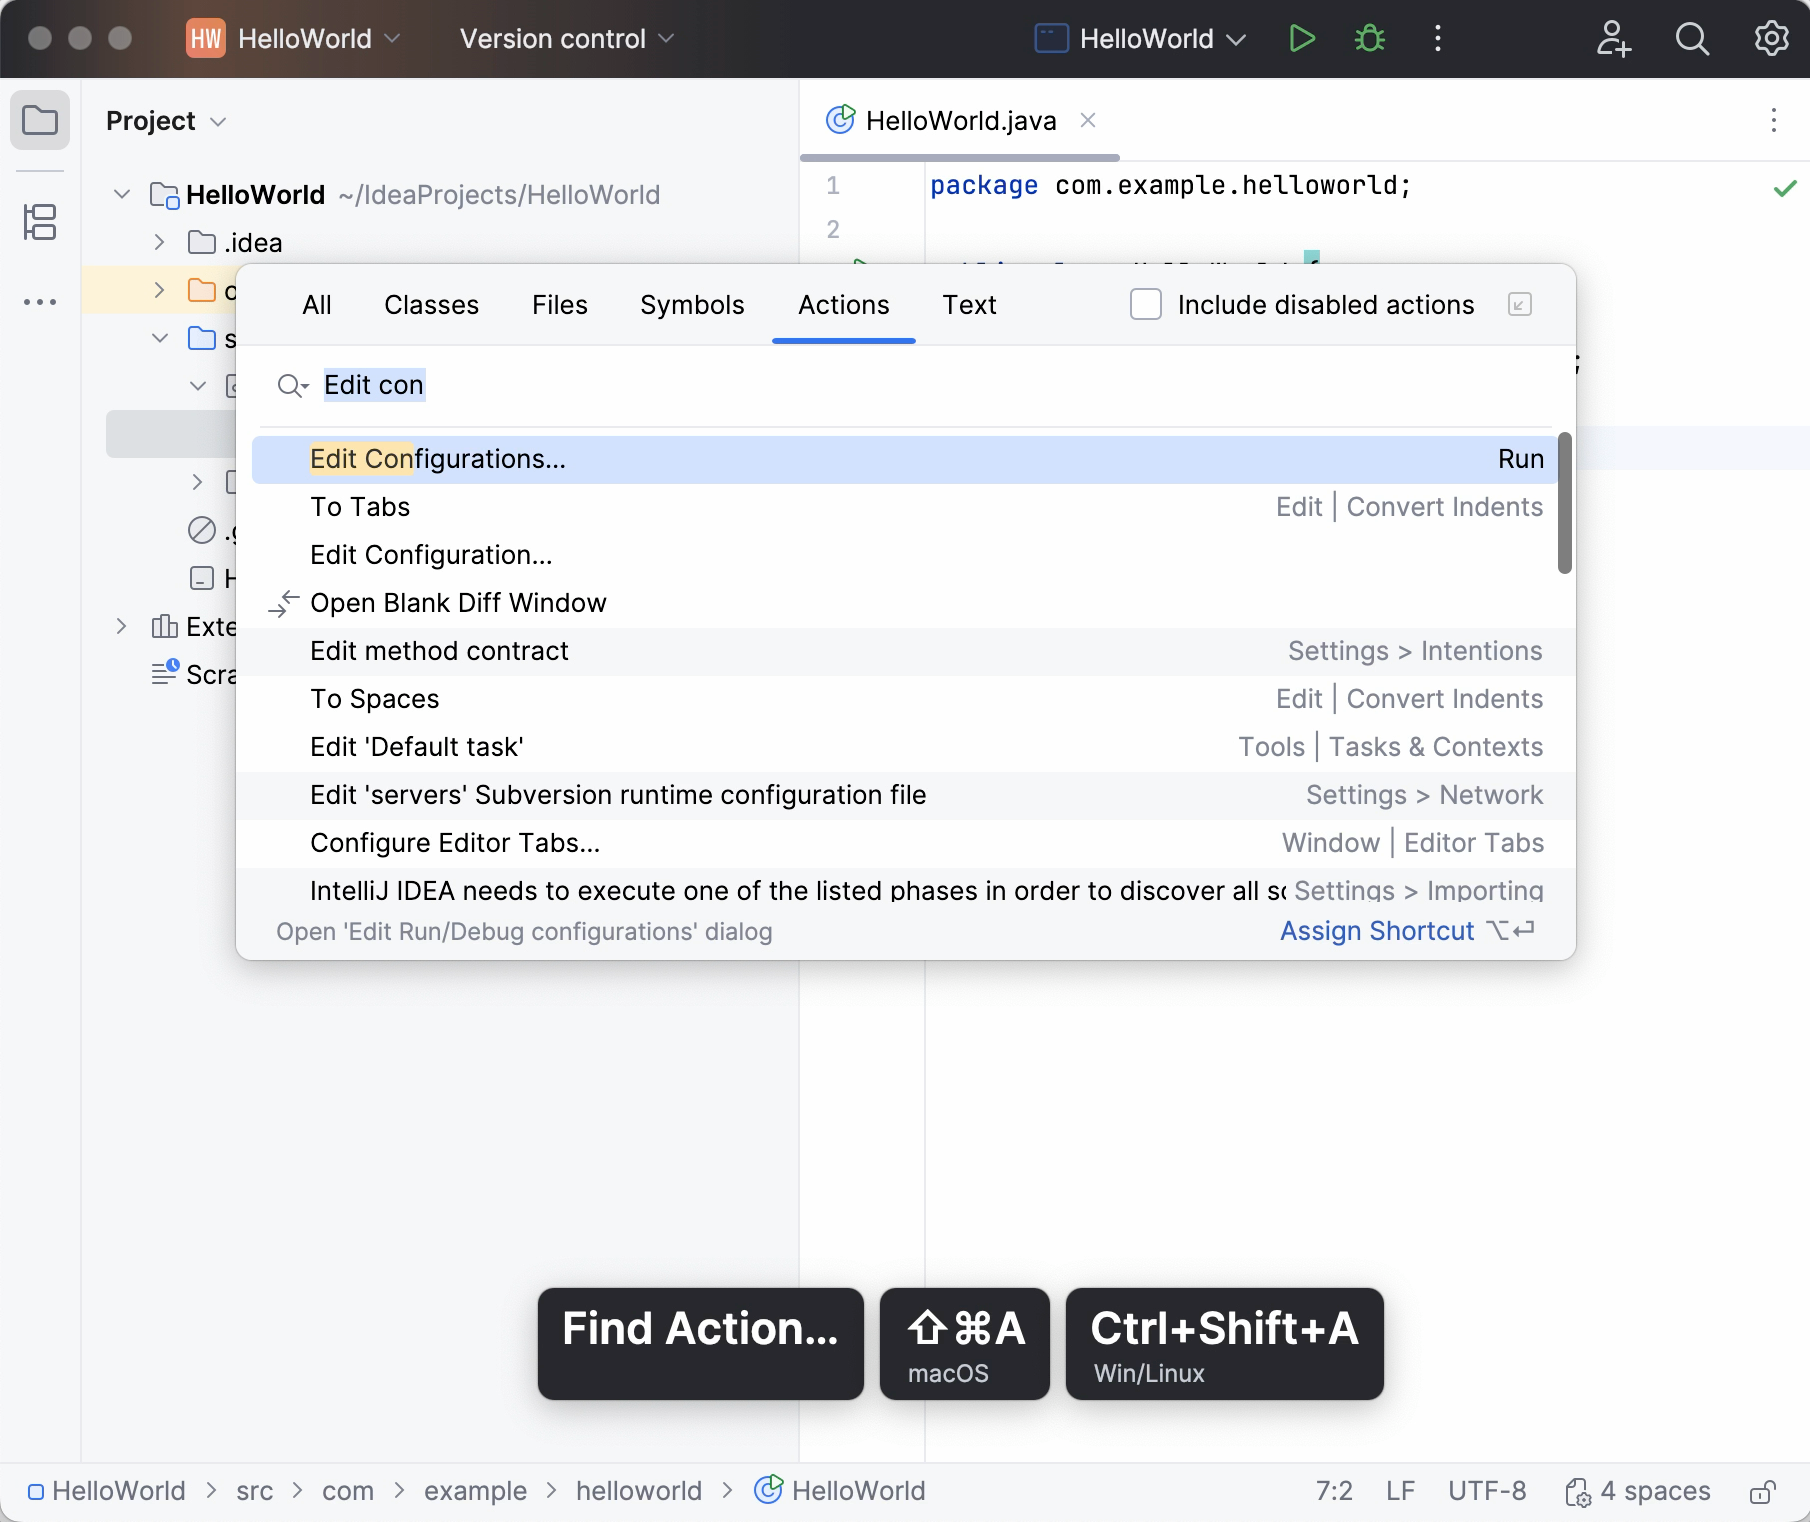
Create a run configuration
Press Ctrl+Shift+A, find and run the Edit Configurations action.
In the Run/Debug Configurations dialog, click
and select JAR Application.Add a name for the new configuration.
In the Path to JAR field, click
and specify the path to the JAR file on your computer.Under Before launch, click
, select in the dialog that opens.Doing this means that the JAR is built automatically every time you execute the run configuration.
Run configurations allow you to define how you want to run your application, with which arguments and options. You can have multiple run configurations for the same application, each with its own settings.
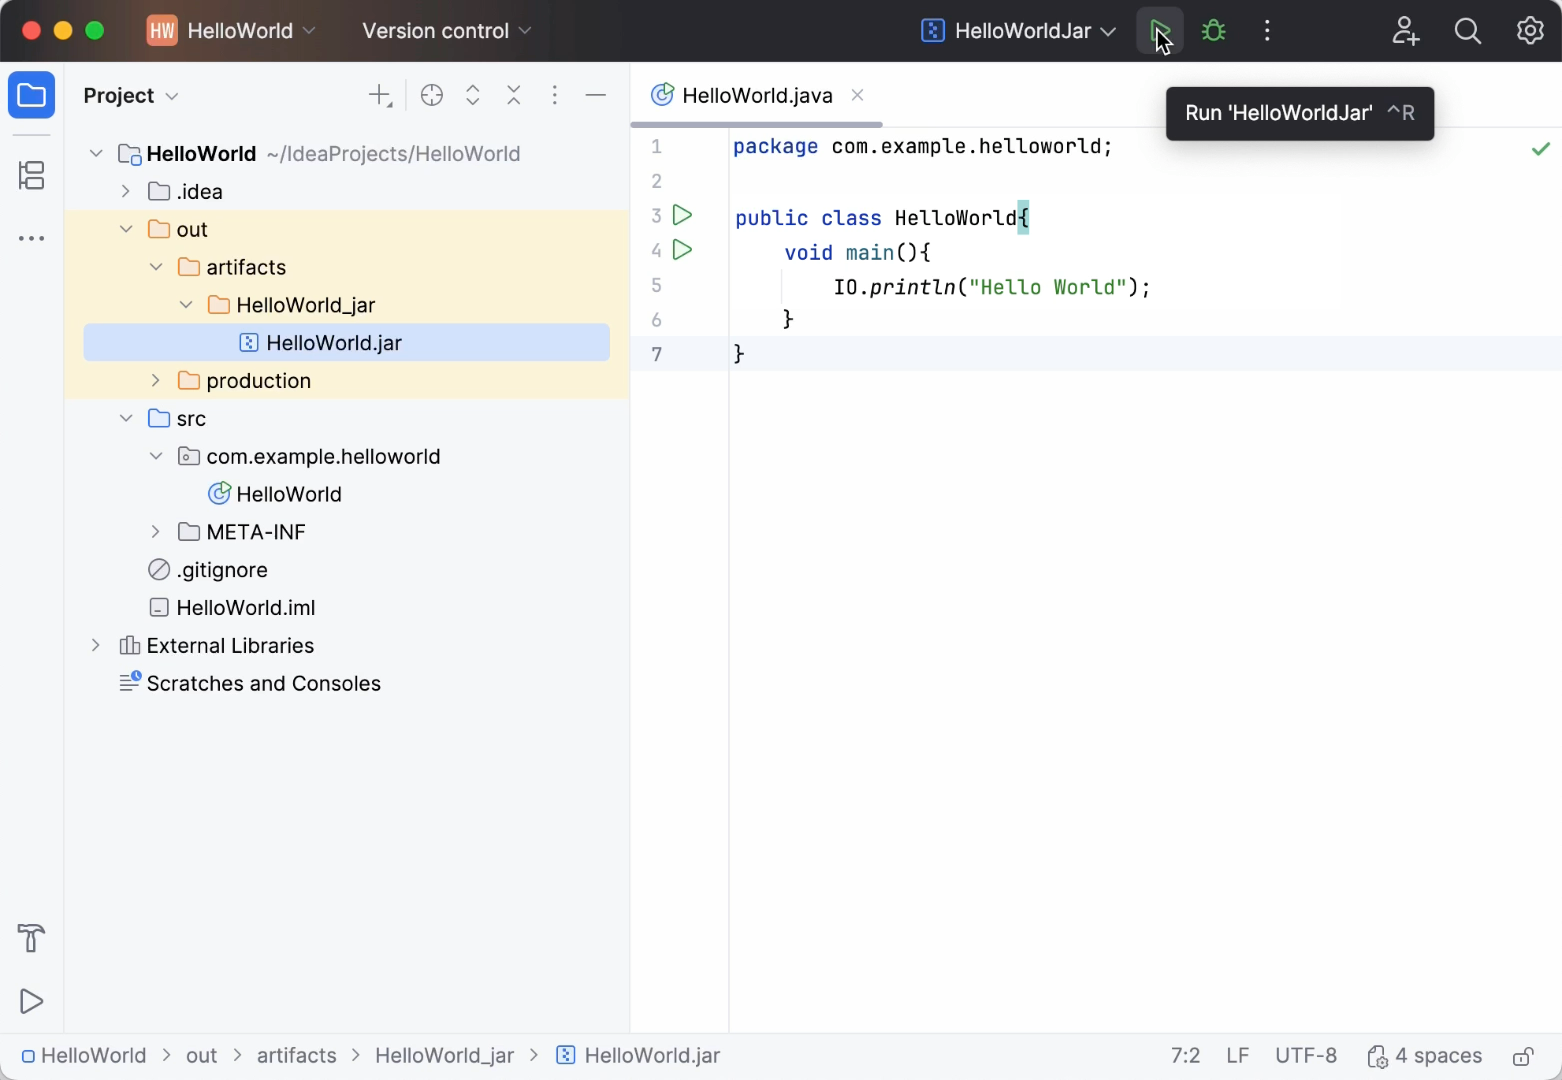
Execute the run configuration
On the toolbar, select the created configuration and click
 to the right of the run configuration selector. Alternatively, press Shift+F10 if you prefer shortcuts.
As before, the Run tool window opens and shows you the application output.
If the process has exited successfully, then the application is packaged correctly.