Monitor debugger overhead
Every time you evaluate an expression or step over the code, IntelliJ IDEA uses the same resources as the debugged application, and this may drastically impact the overall performance in particular cases. For example, breakpoints with heavy conditions may significantly increase the time required for a line of code to complete.
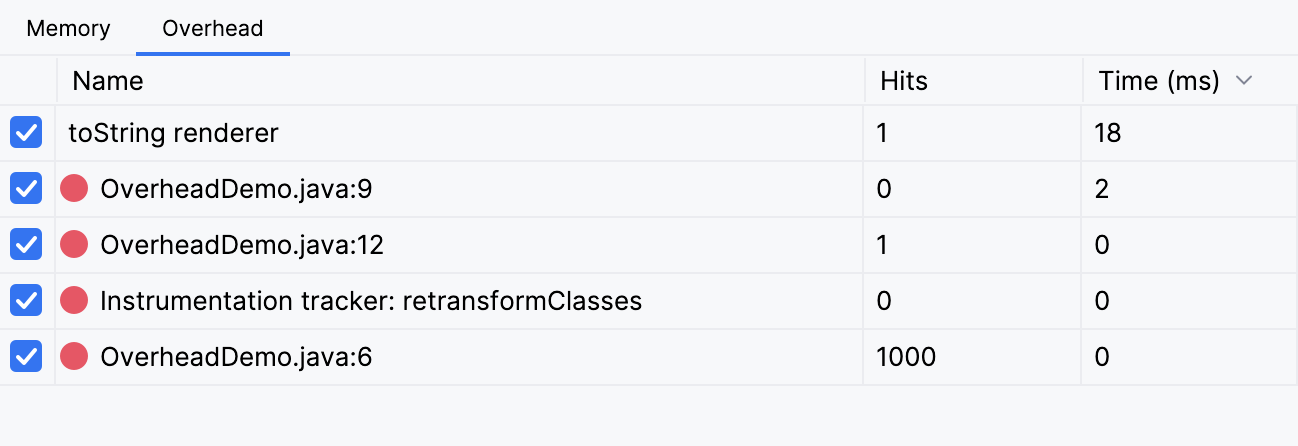
If the performance of the debugged application is not satisfactory, use the Overhead tab to find out which debugger features eat up most resources.
Hide/show overhead information
To hide or show the Overhead tab, click
in the top-right corner of the Debug tool window, then click Overhead.
The Overhead tab provides you with the information about the number of hits and processor time used by each debugger feature. The view is updated dynamically, so you don't have to suspend your application to see the results.

Disable debugger features
If you see that a feature is consuming too much CPU time, you can disable it right in the Overhead tab.
Clear the checkbox next to the feature you want to disable.

Optimize conditional breakpoints
Breakpoints that use conditions can cause significant overhead when hit too frequently.
When this happens, you can substitute the conditional breakpoint with an if statement and a regular breakpoint inside.
Conditions in code are evaluated much faster, which can significantly improve the performance of the debugged application.