The basics: Getting to know how the program behaves through debugging
Stepping through the code
The simplest case for debugging is seeing how the program behaves given a certain input, either because of a bug, or just to understand the code. In this case, using a simple breakpoint (called a line breakpoint) that will suspend the JVM (or thread, see Breakpoint properties) and then stepping through the code is our bread and butter.
Basic stepping
The four basic options we will constantly use when stepping are:
- Step over F8 Step over a line of code.
- Step into F7 Step into a method called from this line of code.
- Step out Shift+F8 Step out of a method back to the calling code.
- Resume Program F9 Resume debugging and stop at the next breakpoint.
IntelliJ IDEA will step into most code with two exceptions, described below.
Stepping, skipping and force step into
Code can be configured to be skipped in stepping. Some of it, like, for example, any com.sun.* classes is skipped by default. This is defined in .
The motivation behind this is to reduce noise and skip unrelated code. Class loading, for example, is almost always unrelated to our application code, so is a lot of third-party code, especially frameworks.
We can change the configuration to skip more or less, and we also have an overriding mechanism at runtime to step into "skipped code". That is what the Force Step Into option is for.
Debugging without source code
If we don't have the source to specific code, IntelliJ IDEA will still decompile the class and show our steps in the decompiled source. This is very helpful, but note that the generated decompiled class may look different from the original, and if the lines do not match, debugging in decompiled code may be confusing. Always try to obtain the source code of the classes you want to step into.
Debugging code that was compiled without the debug flag
Code that was compiled without the debug flag cannot be debugged. There is no way to step into this code. When the debugger encounters such code during a debugging session, it will step over that part of code.
Line breakpoints are also not possible to define and hit. However, this is where the Method Breakpoint might save us, as we can still define in IntelliJ IDEA a breakpoint to stop before entry or exit from a specific method, even if the method itself was compiled without the debug flag.
When viewing the state, since the actual variables within the method cannot be inspected, we will see a warning message instead.

Inspecting the state of the program
Once running is suspended, we can inspect the state of the application. Based on the thread and the position we are in that thread, IntelliJ IDEA will show us the various variables and fields in scope and their values. This is good enough for almost all cases, but sometimes we want to tailor the way we inspect the state to very specific needs.
Watching a value throughout the session
If we want to know the value of a particular expression in every frame or thread, and across many suspended breakpoints, we can set a watch on an expression.Rendering a type
Usually, the default rendering of a value into a displayed string is good enough. When it's not, in most cases it is because toString() was not overridden. This is simply a hint to us that we should implement toString() for this class.
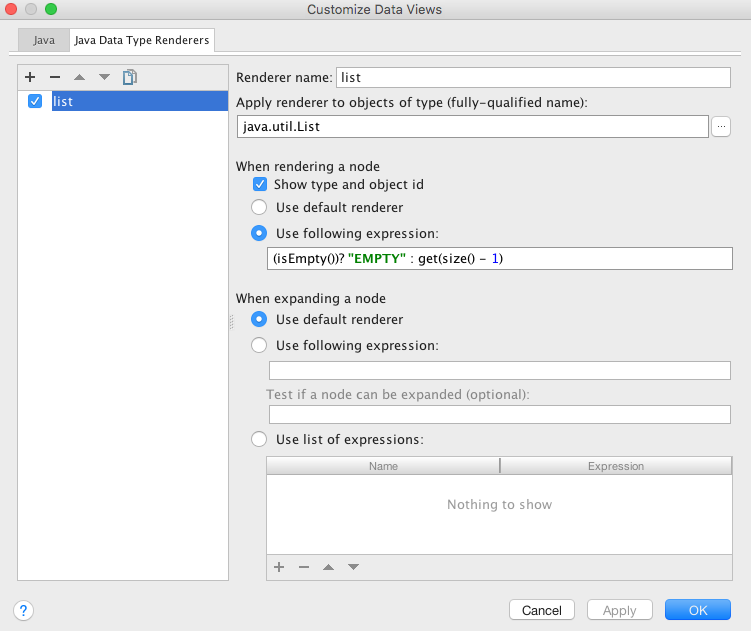
Sometimes though, implementing toString() is not possible, or we will be better off with a specific Type Renderer for our purposes. For example, assume we're dealing with lists as queues: in all those lists, all we want to see is whether the list is empty, and if not, we want to see the last element of that list. Different lists will have different implementations and renderers. The renderer of an ArrayList for example, will show you only the first 100 elements. That will both contain lots of unneeded details and also may not contain what is really important for us. To help us, IntelliJ IDEA allows us to easily override the Type Renderer.
We choose to render any java.util.List object to show the "EMPTY" string when empty or the last element when it has one.

Evaluating an expression
Evaluating Expressions allows us to inspect values and evaluate specific expressions. For example, evaluating parts of a condition to figure out why a certain complex condition gave an unexpected result. The expression can also contain calling methods, testing out scenarios and using parameter values that did not exist in the actual debugging session. These kind of "what-if" scenarios are easily done by Evaluating Expression. This really allows us to closely inspect the behaviour of certain methods or expressions.
During the debugging session, we can also evaluate expressions in the editor itself simply by hovering on them. 
Detecting unexpected parameter value or call to method
This section covers what to do if we know where things have already gone wrong, but don't know why.Exploring the call frames
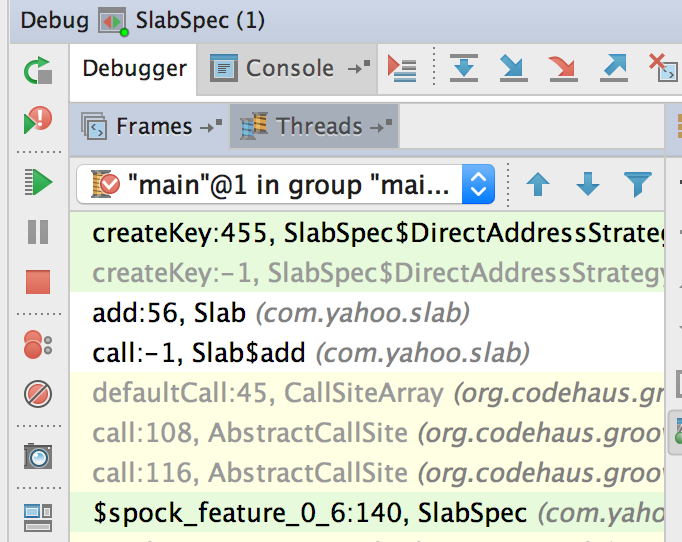
A Line Breakpoint should be enough for most cases of detecting the cause behind an unexpected call or call with unexpected parameter values to a method. If we're not sure where it's being called from, we can put the breakpoint inside the method. When the VM is suspended, click on the previous call frames to view the call stack and inspect the state in each scope to see how we got here.

Drop frames: replaying the execution
If we want to step back through that method call to get more information by stepping, we can use the Drop Frame feature. This will allow us to go back up the stack and re-execute the code. It's a useful feature, but also potentially dangerous: we must be aware that re-executing the code will execute the same instructions twice, and if those instructions modify state we might end up in a corrupted state, and certainly in a scenario that would not happen in a normal run under the same conditions. To make the impact of Drop Frame obvious, consider this simple demo.
public class DropFrameDemo {
    private static int state = 0;

    public static void main(final String[] args) {
        modifyStateBasedOnParameter(state);
        modifyStateBasedOnStaticField();
    }

    // dropping frame within this method,
    // and executing again will print state = 2
    private static void modifyStateBasedOnStaticField() {
        state++;
        System.out.println("state = " + state);
    }

    // dropping frame from within this method,
    // and executing again will print state = 1
    private static void modifyStateBasedOnParameter(final int parameter) {
        state = parameter + 1;
        System.out.println("state = " + state);
    }
}
Breaking inside modifyStateBasedOnParameter() will not impact the state because IntelliJ IDEA remembers the parameter values passed in to that frame and will not recalculate those. However, breaking inside modifyStateBasedOnStaticField() will make the state field equal '2'. A value which is impossible under a normal run of main().
Breakpoint by method
An alternative to having a line breakpoint defined within the problematic method is to define a Method Breakpoint. This type of breakpoint is not attached to a source code line number, but to the entry and exit of a call to a method. It is especially useful in two main cases:
- When a method is defined by an interface and we want to breakpoint in all implementations of it.
- When we don't have the source code, only a decompiled version, and we still want to inspect the ins and outs of a method call, without any confusing differences in line numbers between the compiled class and the decompiled source code.
Detecting unexpected object state
This could be viewed as something that went wrong before the access method to that field. That is why all the above approaches can help detect the problem. Sometimes though, especially if the field was accessible by more than just the getter and setter, it's not easy to find what flow started the problem. For that scenario, IntelliJ IDEA provides us with another useful option.Breakpoint by field access
A Field Watchpoint is really another type of breakpoint. It is a breakpoint at any point we either read from or write to a specific field. This is especially useful in cases where the field is being accessed all over the code, or we're not sure about all the places it is being accessed from.
This is another case of the test giving a clue to the developer. If possible, we should try controlling the access to that field by an access modifier and using getters and setters to make it easier to manage.
Detecting unexpected exception thrown
Analysing stacktrace
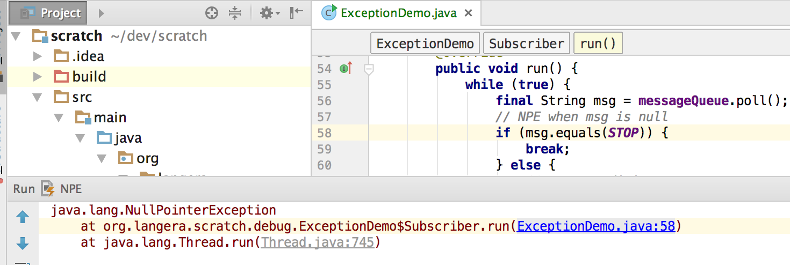
Although not strictly a debugging feature, when we want to investigate why an exception was thrown, we can analyse the exception stack trace and quickly get to the line of code that generated that exception. From there the combination of Line Breakpoint and Stepping is usually enough to figure out what is wrong.

Sometimes however, the exception is wrapped in another exception or caught and swallowed by the catch block. All we see are its side effects (perhaps a log) but not its stack trace. For that we have a special type of breakpoint.
Breakpoint when exception get thrown
We can define an Exception Breakpoint for a specific type ofException, or any type, and the breakpoint will be triggered whenever the matching exception is thrown. This is extremely useful in cases where we don't know where the exception is generated from or even what is its specific type.