Run/debug configurations
IntelliJ IDEA uses run/debug configurations to run, debug, and test your code. Each configuration is a named set of startup properties that define what to execute and what parameters and environment should be used.
There are two types of run/debug configurations:
Temporary — created every time you are running a class that does not have a permanent configuration. It provides the bare minimum that allows a class with the
main()method to run.Permanent — created explicitly from a template or by saving a temporary configuration. Permanent configurations remain as part of your project until you remove them.
Whenever you run, debug, or test your code, IntelliJ IDEA either uses an existing permanent run/debug configuration or creates a new temporary one.
Permanent configurations have opaque icons while the icons of temporary configurations are semi-transparent. The red cross over the configuration icon indicates an error in configuration settings.
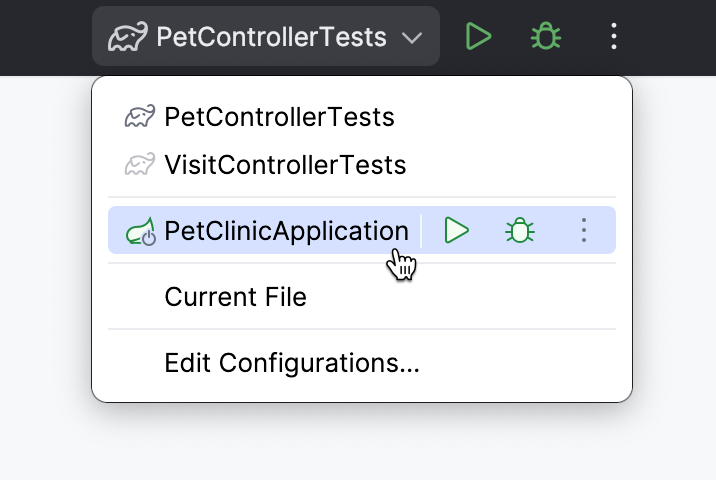
The maximum number of temporary configurations is 5. The older ones are automatically deleted when new ones are added. If necessary, you can increase this limit in .
Create permanent run/debug configurations
IntelliJ IDEA provides the following ways to create a permanent run/debug configuration:
When there is an executable class or method, you can create a permanent run/debug configuration right from the editor.
Create from a template or copy an existing configuration.
Create a permanent run/debug configuration from an executable method or class
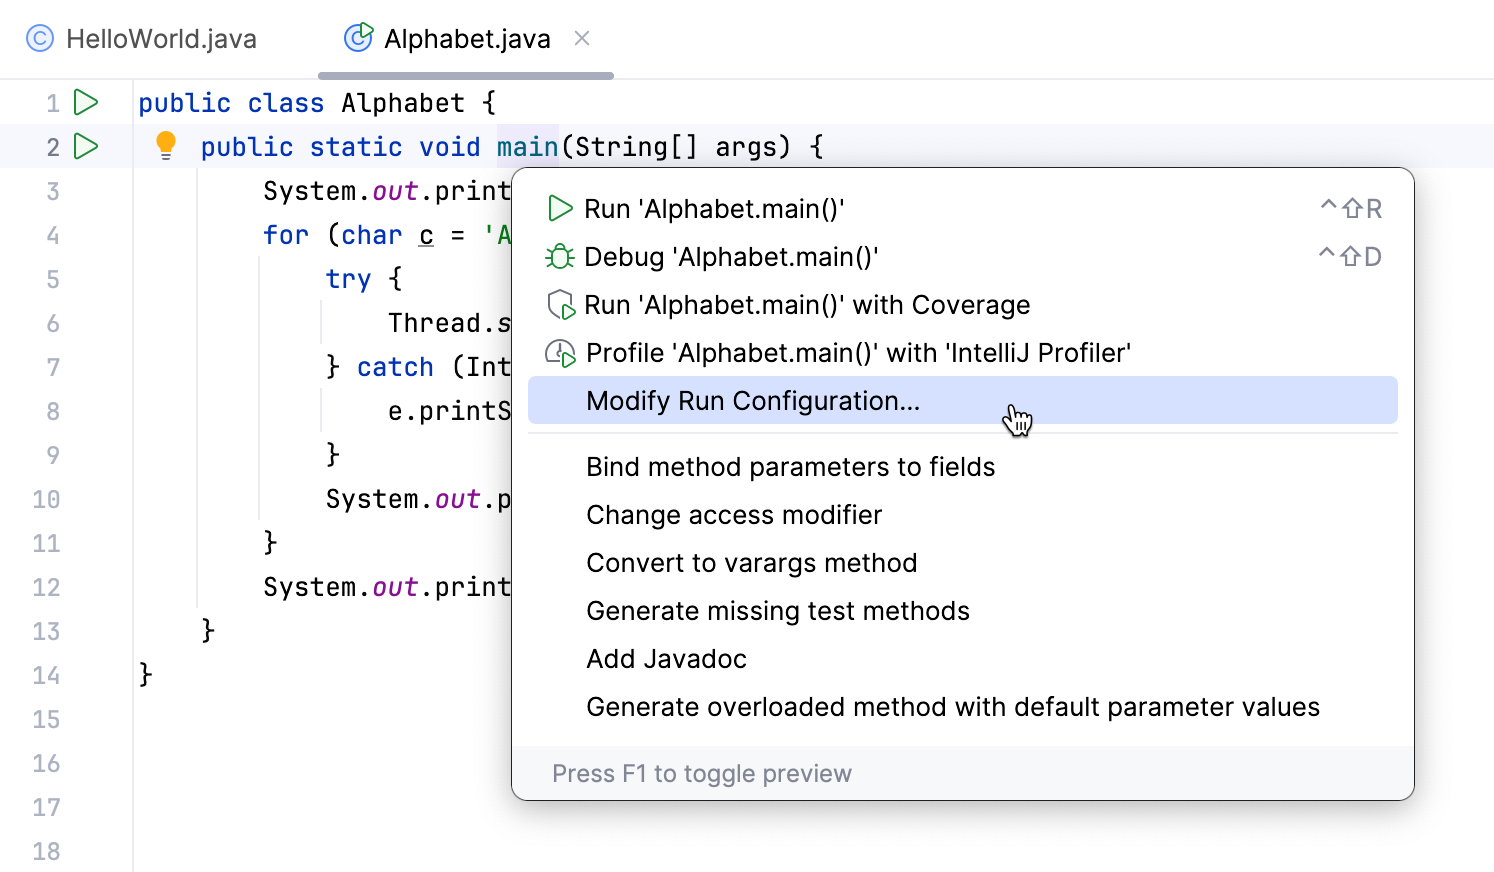
Place the caret at the declaration of an executable method or class (for example, a class with the
main()method or a test suite) and press Alt+Enter.From the menu that opens, select Modify Run Configuration.
IntelliJ IDEA creates a permanent run/debug configuration of the corresponding type and opens a dialog in which you can set configuration parameters.
Set up the run/debug configuration parameters. For the detailed description of the template, see List of run/debug configurations.
Save a temporary configuration as permanent
Select a temporary configuration in the run widget, click
and select Save Configuration.
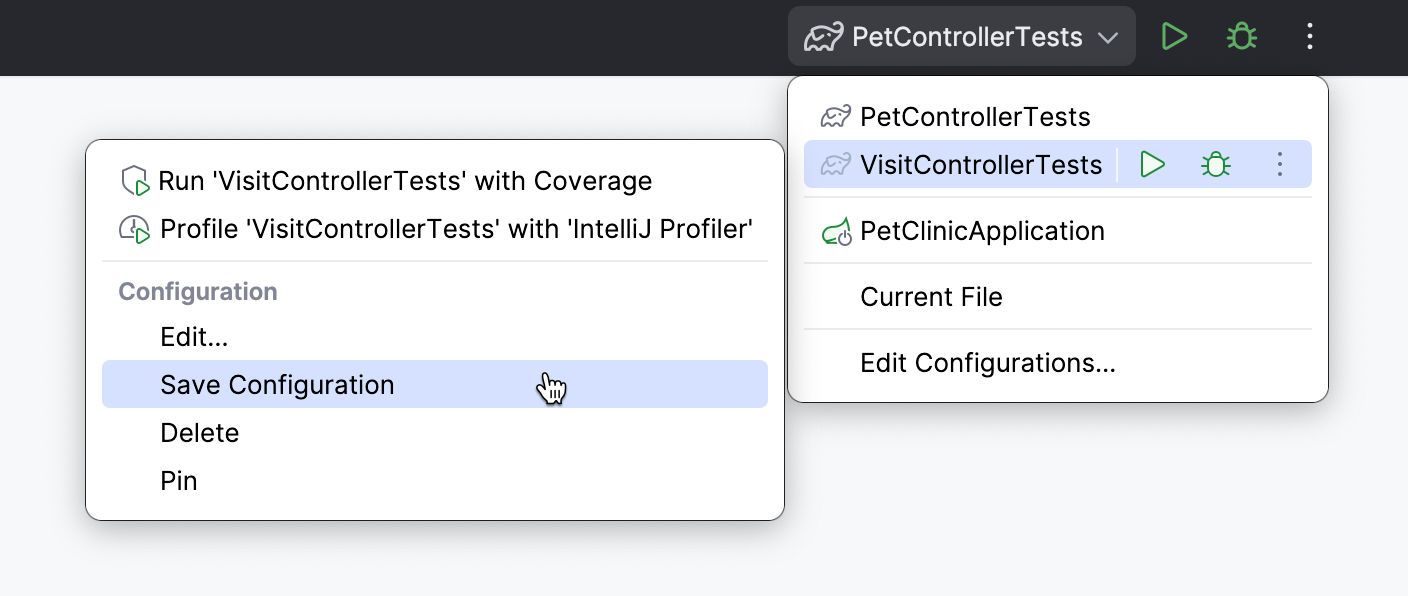
Alternatively, select a temporary configuration in the Run/debug configurations dialog and click
on the toolbar.
IntelliJ IDEA provides run/debug configuration templates for different languages, tools, and frameworks. The list of available templates varies depending on the installed and enabled plugins.
Create a run/debug configuration from a template
Go to . Alternatively, press Alt+Shift+F10, then 0.
In the Run/Debug Configurations dialog, click
on the toolbar or press Alt+Insert. The list shows the run/debug configuration templates. Select a template, for example, Application. This configuration compiles and runs your Java program – similar to when you use the
javacandjavacommands.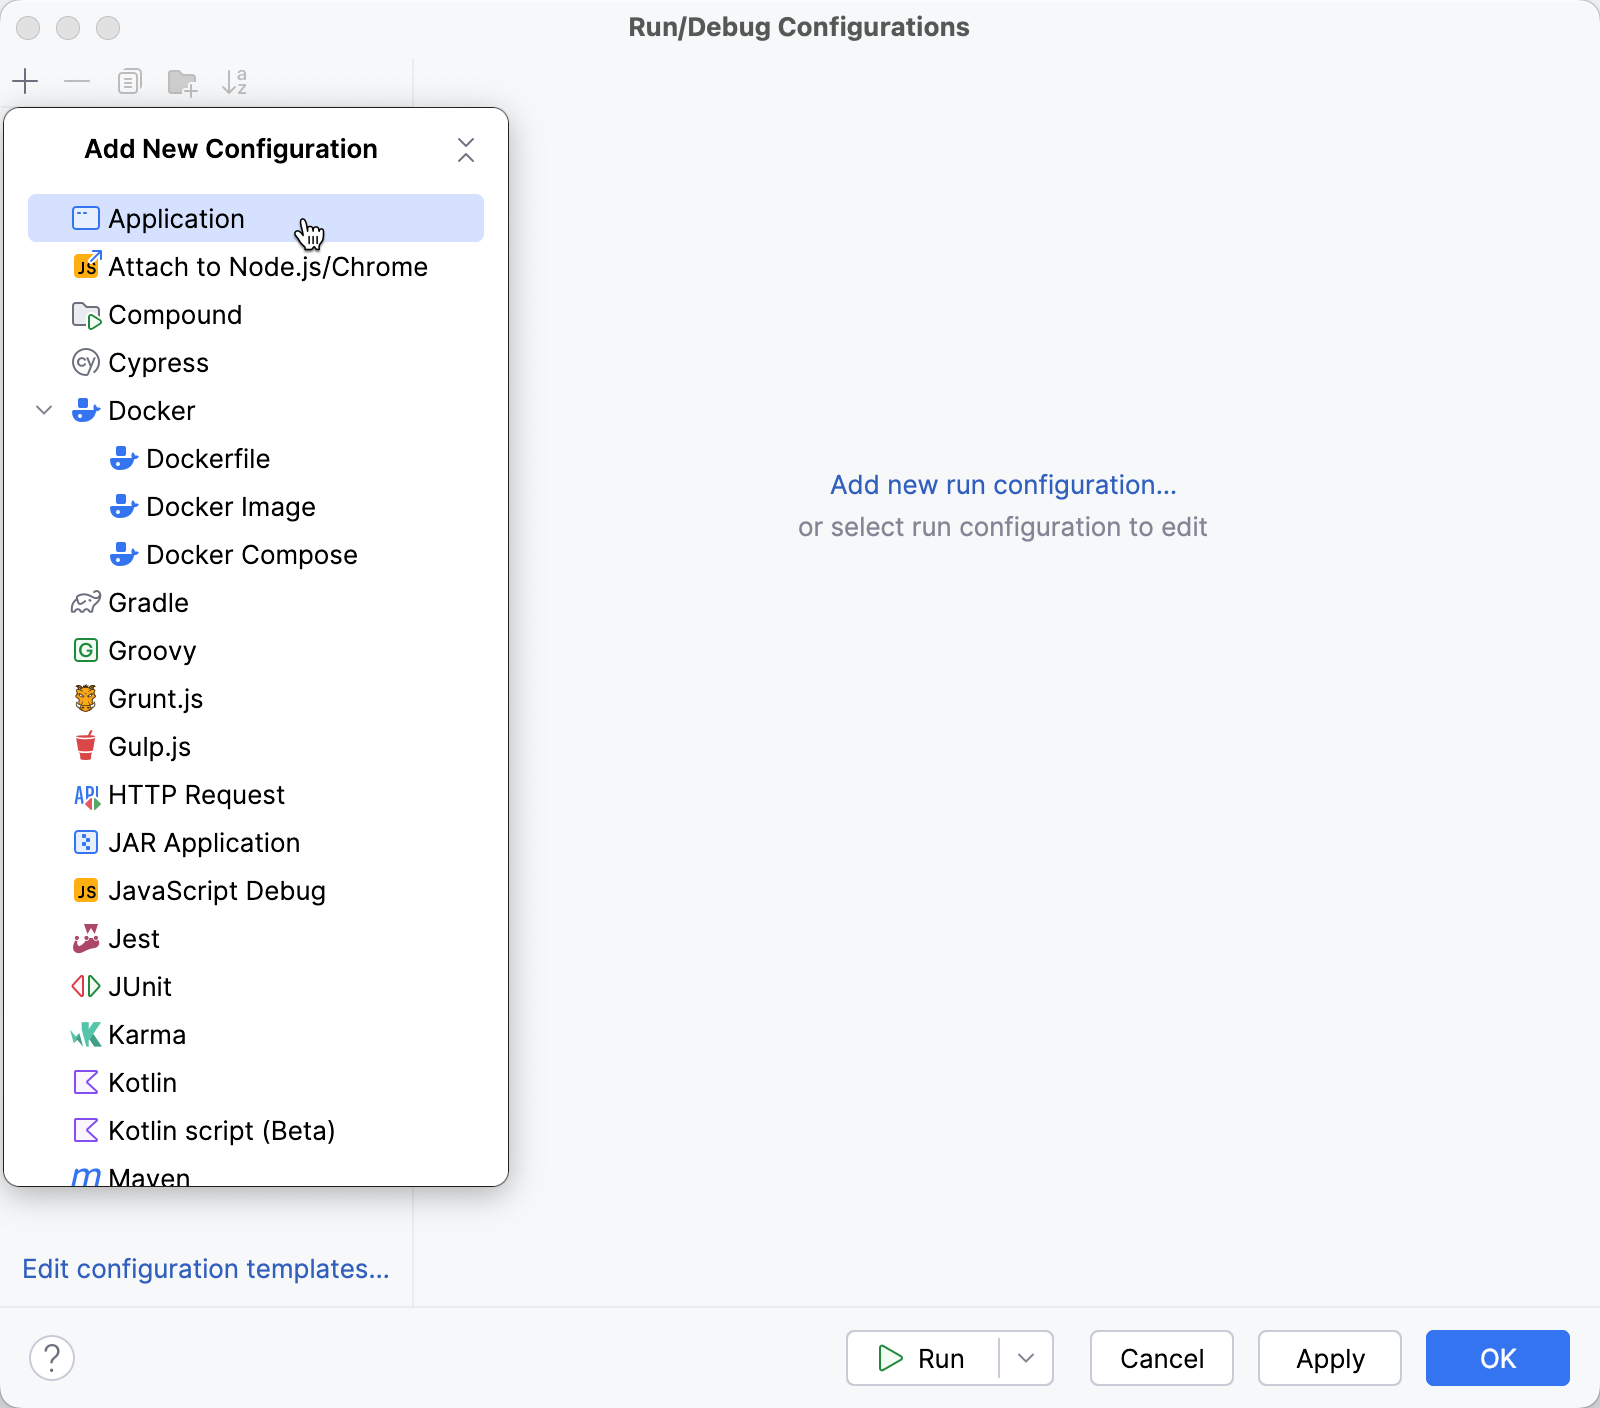
Specify the run/debug configuration name in the Name field. This name will be used to identify the run/debug configuration in lists and menus.
Specify the configuration options.
For more information, refer to Run/debug configuration: Application (to run a simple Java application) or List of run/debug configuration templates (for other run configurations).
You can either run the configuration right away or save the configuration to run it later.
To save the run configuration for later, click OK.
To run the configuration right away, click Run.
Launch a run configuration
You can launch existing run configurations in one of the following ways:
If the run configuration is already selected in the Run widget, click
next to it or press Shift+F10.
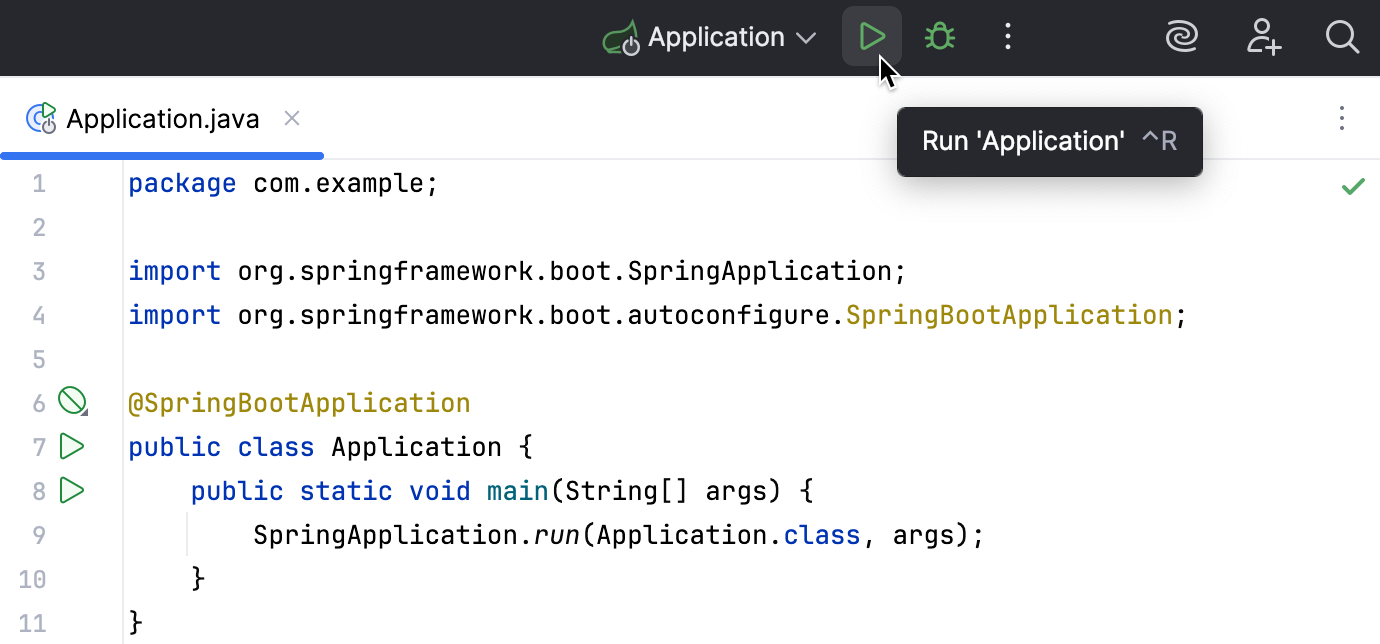
If you want to select another run configuration, click the Run widget. In the menu that opens, click
next to the run configuration you want to launch.
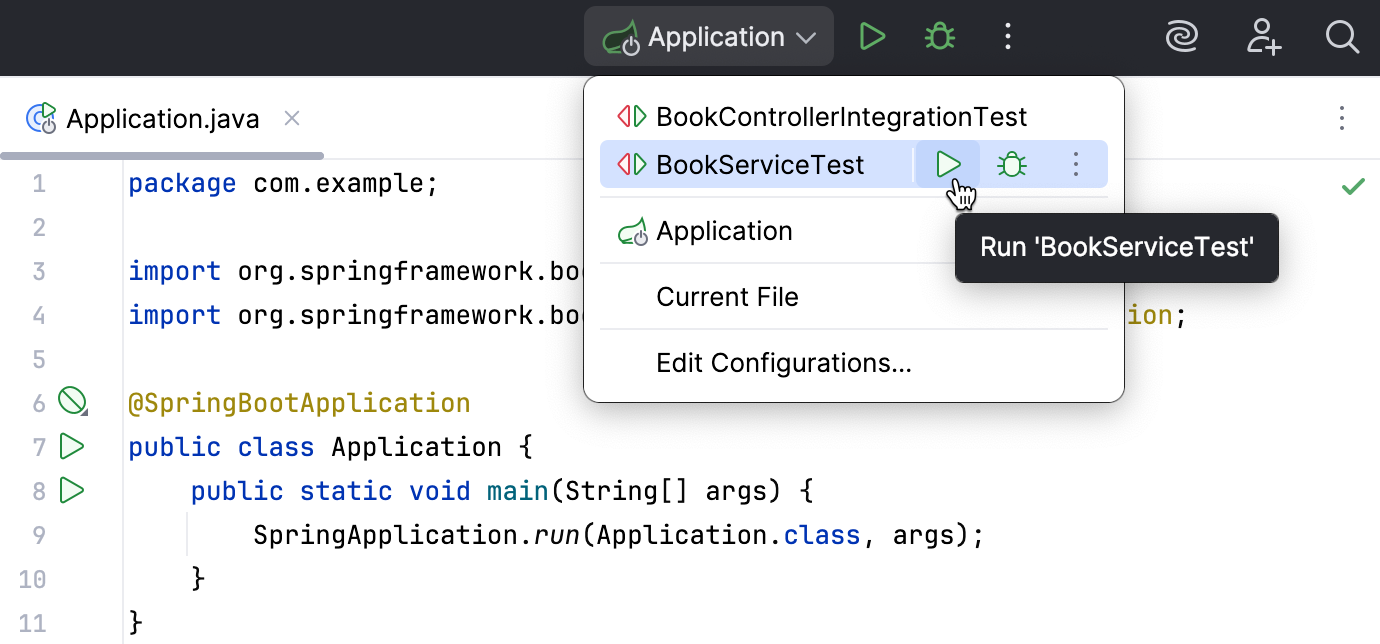
Press Alt+Shift+F10. In the menu that opens, click the run configuration you want to launch.
Share run/debug configurations
You might want to share your run/debug configurations so that your teammates could run the application using the same configuration or enable them to remotely attach to the process you are running.
IntelliJ IDEA provides a mechanism to store your run/debug configurations as project files and share them through VCS. The same mechanism can also be used when you want to send your configuration as a file to someone else, create a local backup of your run/debug configurations, or import them from a file.
Legacy .ipr-based projects do not support individual run/debug configurations. With legacy projects, you can only share all configurations at once by adding the .ipr file to the VCS.
Go to . Alternatively, press Alt+Shift+F10, then 0.
Select the run/debug configuration you want to share, enable the Store as project file option, and specify the location where the configuration file will be stored.
You can configure any location unless compatibility with IntelliJ IDEA 2019.3 and earlier is required. For compatibility with these versions, store the file in the suggested location.
(Optional) If the .idea directory is added to VCS ignored files, the .idea/runConfigurations subfolder will be ignored, too. If the project uses Git, you can share .idea/runConfigurations and leave .idea ignored by modifying .gitignore as follows:
/.idea/* !/.idea/runConfigurations
Run/debug configuration templates
All run/debug configurations are based on templates, which implement the startup logic, define the list of parameters and their default values. The list of available templates is predefined in the installation and can only be extended via plugins. However, you can edit default parameter values in each template to facilitate the setup of new run/debug configurations.
Configure the default values for a template
Go to . Alternatively, press Alt+Shift+F10, then 0.
In the left-hand pane of the run/debug configuration dialog, click Edit configuration templates.
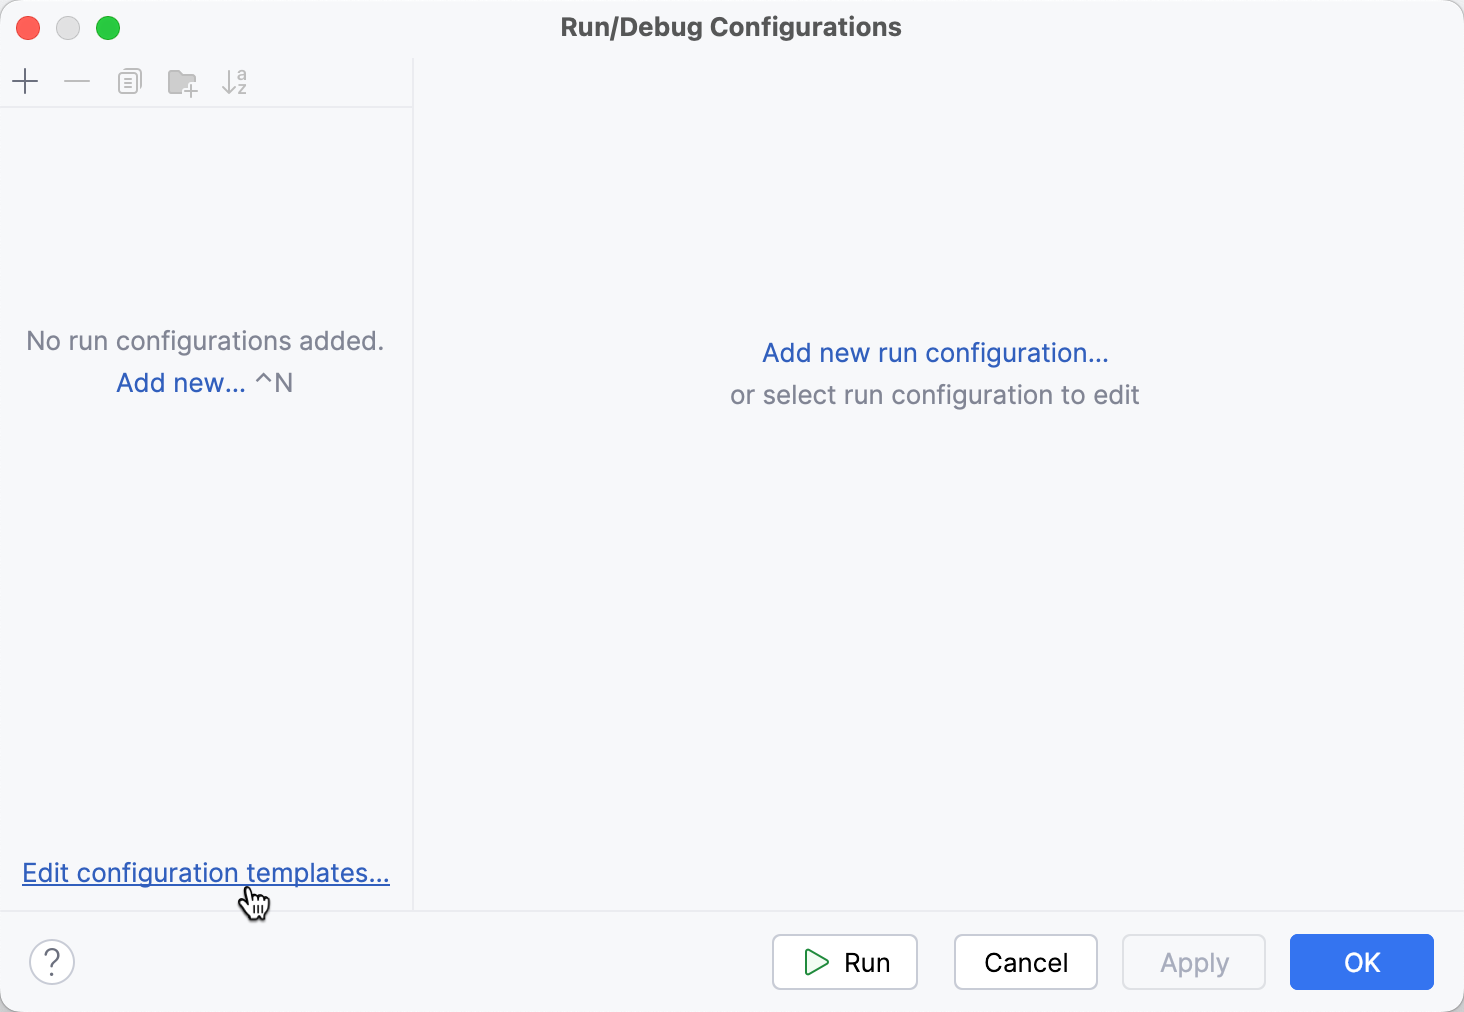
In the Run/Debug Configuration Templates dialog that opens, select a configuration type.
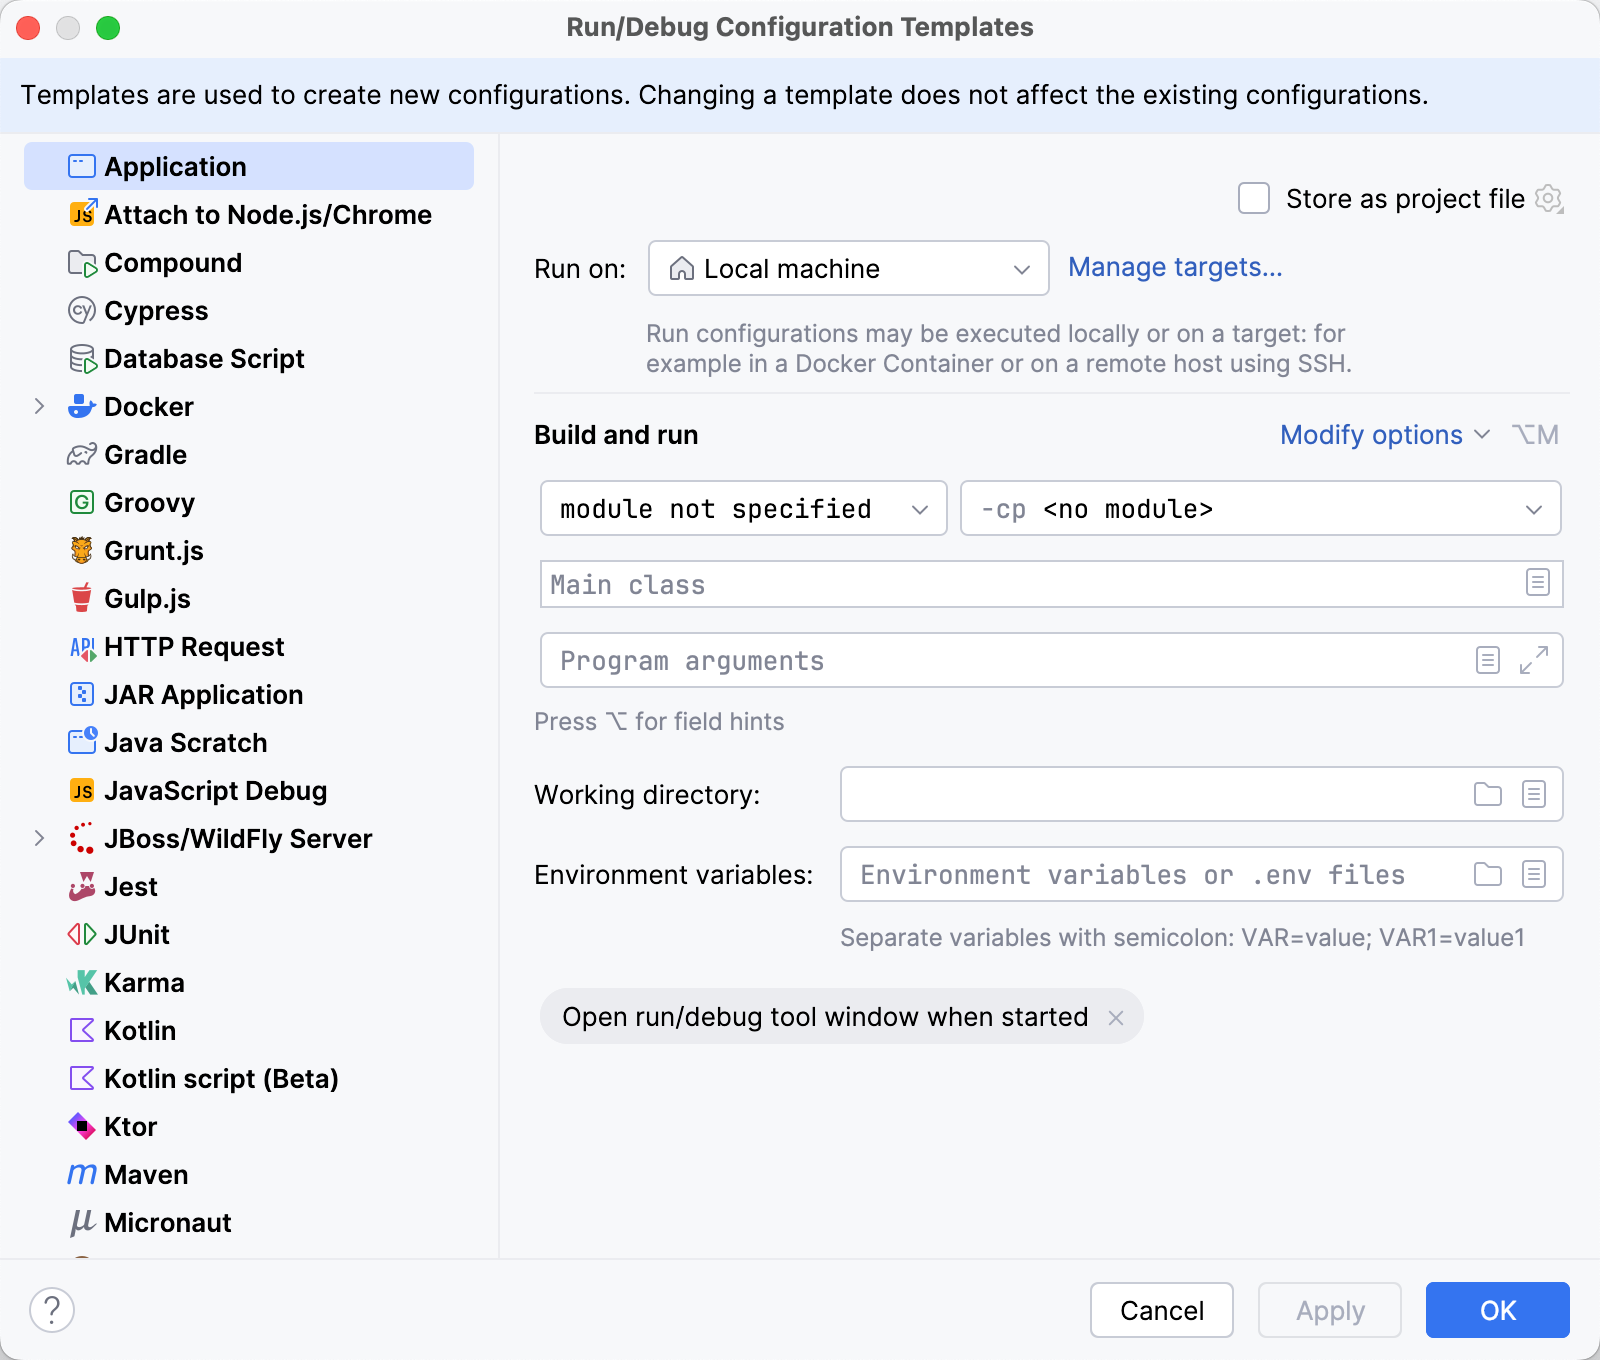
Specify the desired default parameters and click OK to save the template.
Run/debug configuration folders
When there are many run/debug configurations of the same type, you can group them in folders for easier access.
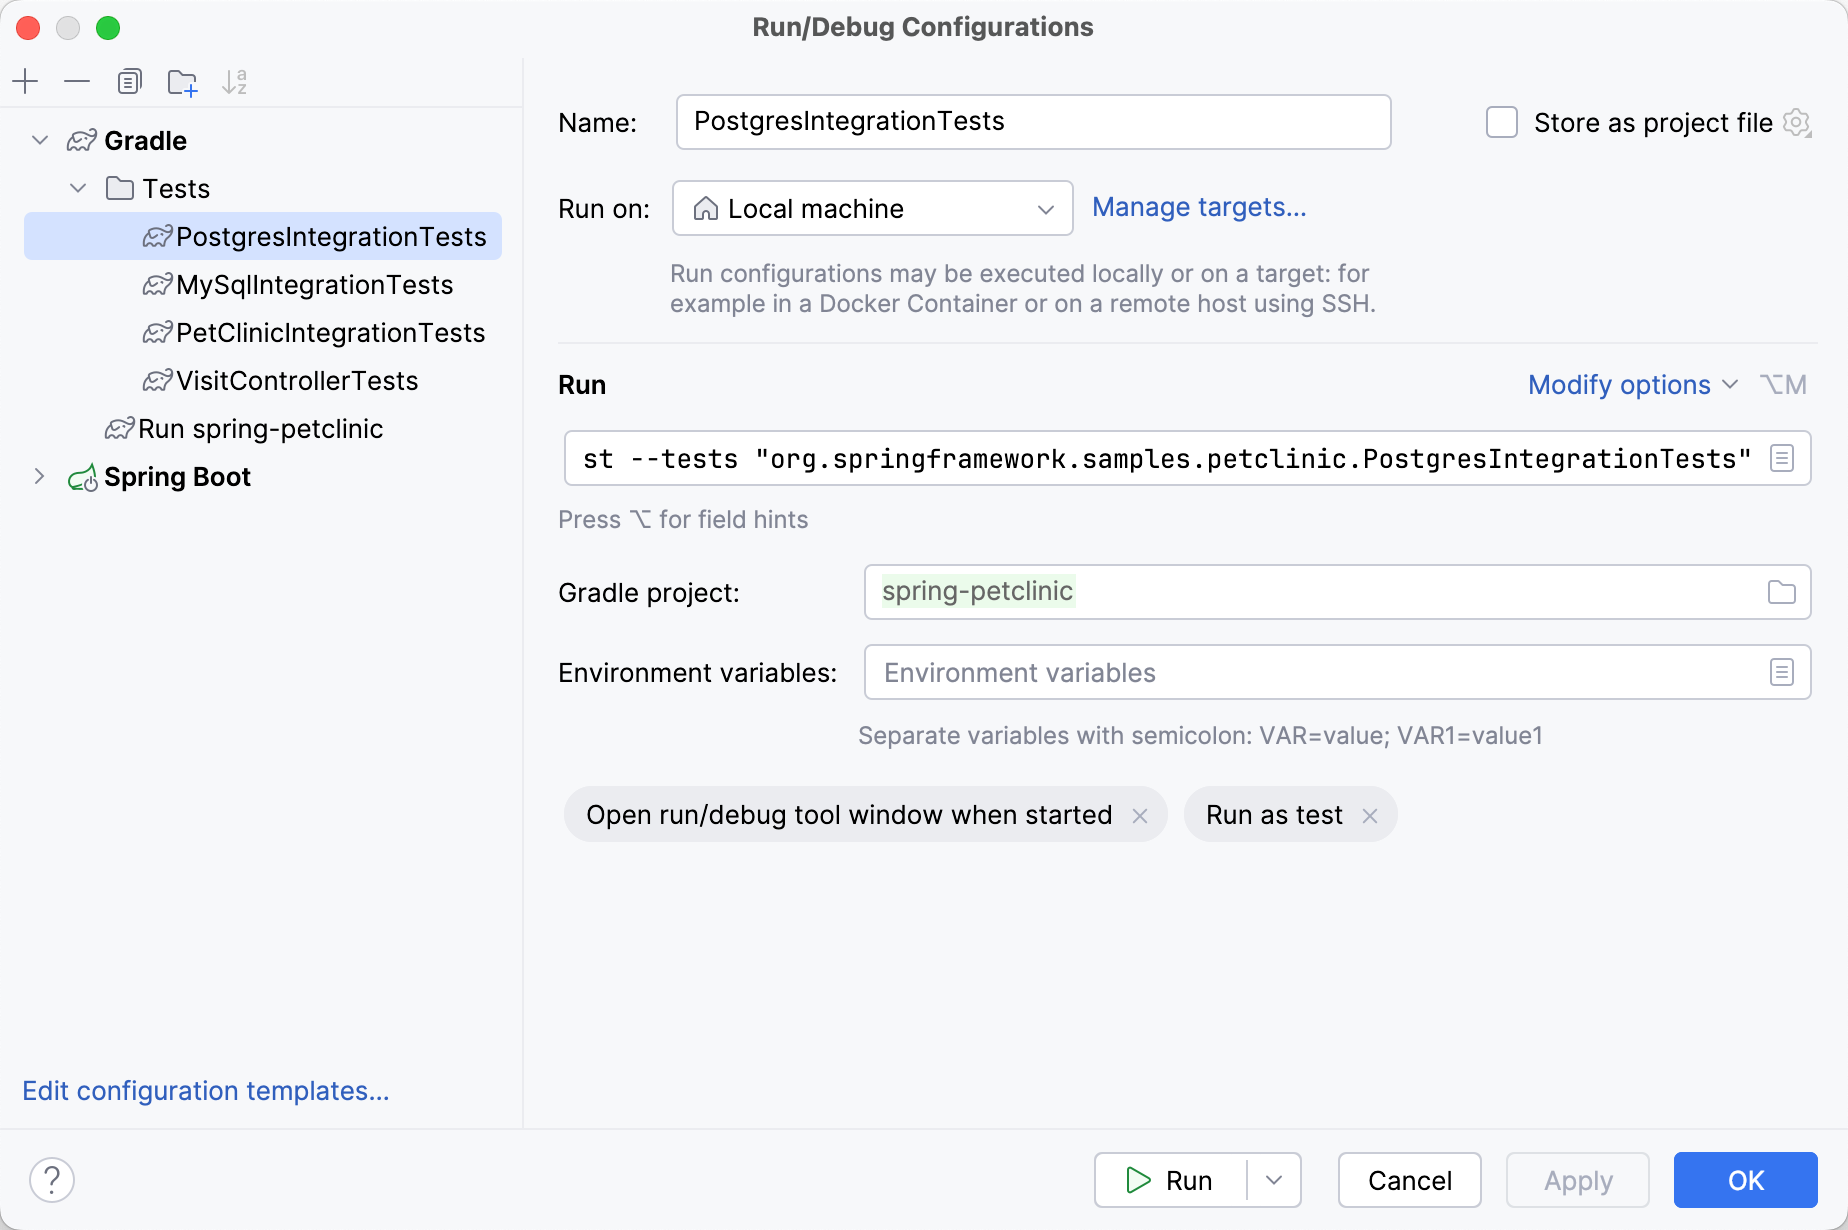
Create a folder for run/debug configurations
Go to . Alternatively, press Alt+Shift+F10, then 0.
Select the run/debug configurations that you want to move to a folder and click
.
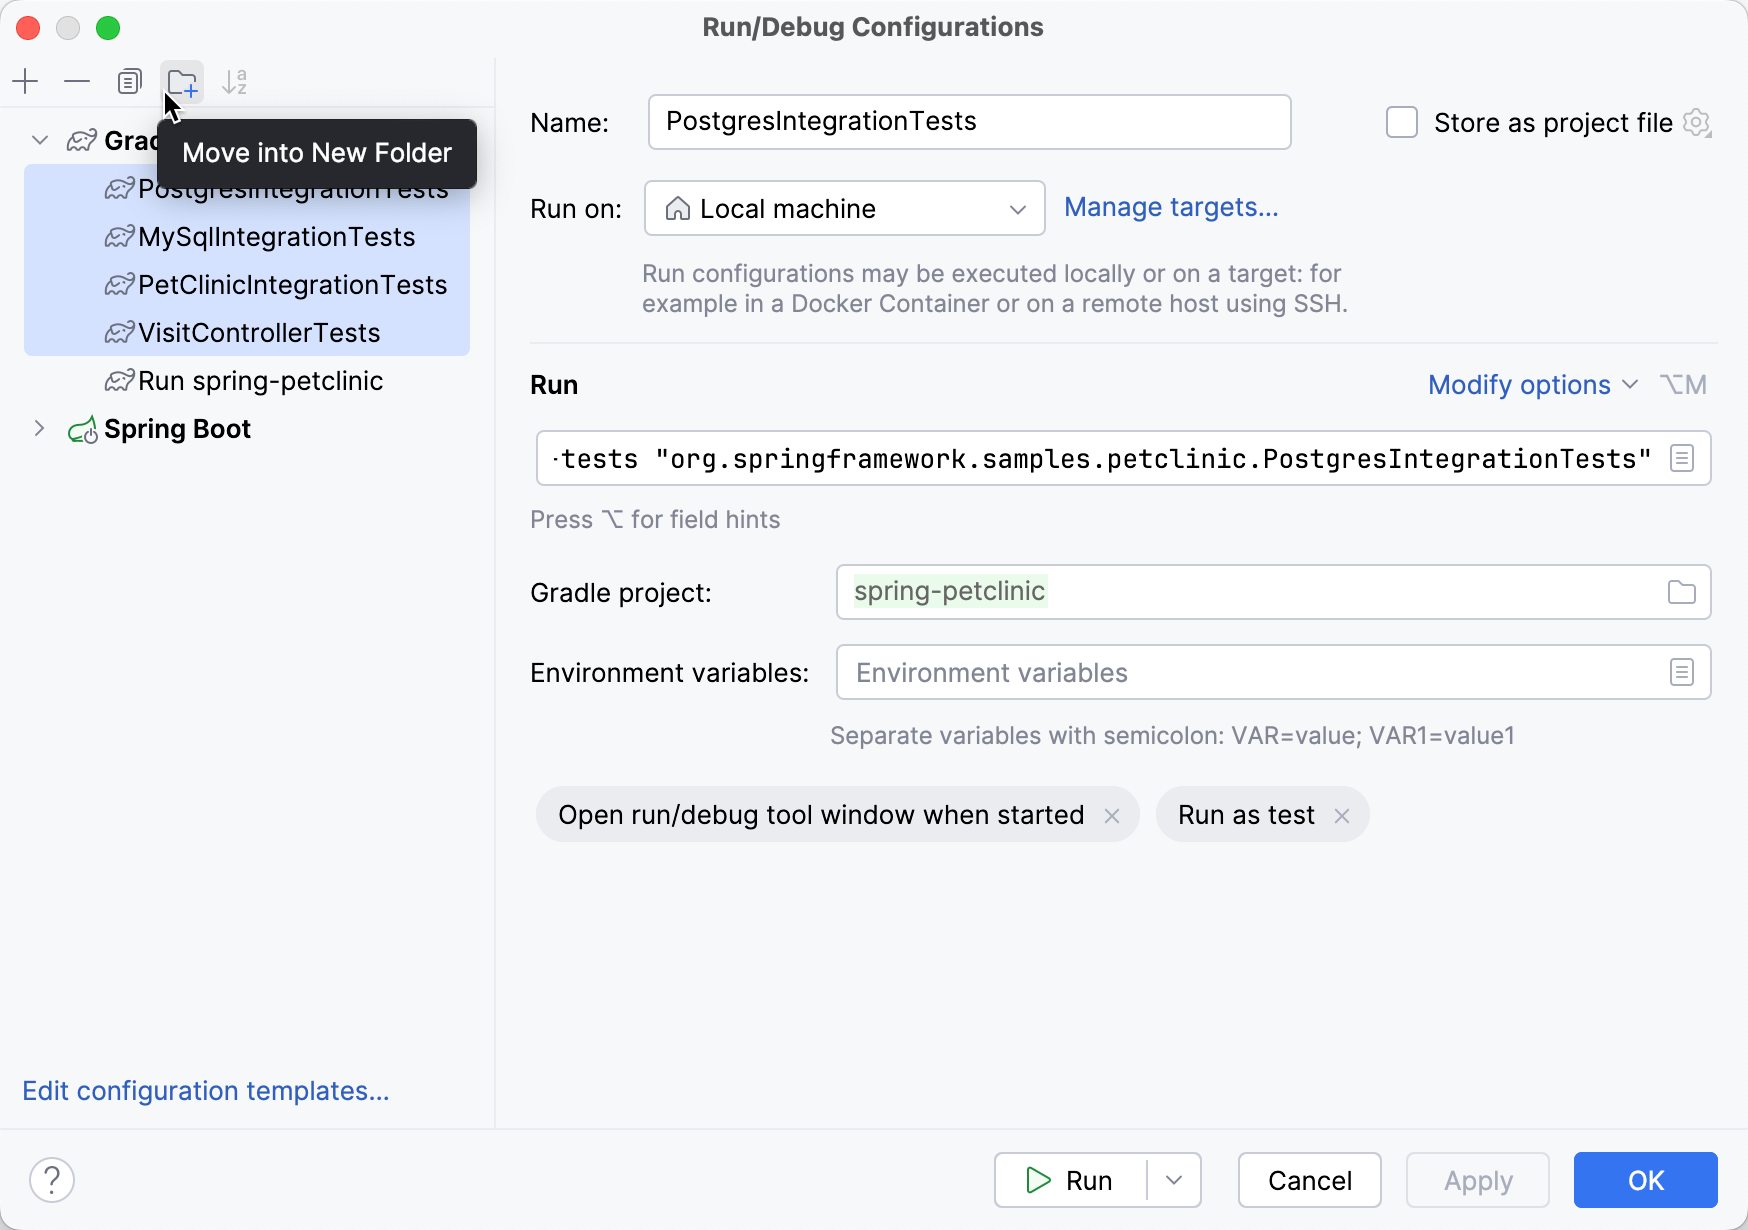
Give the folder a name.
When you no longer need a folder, you can delete it Delete. The run/debug configurations grouped under this folder will be moved under the root of the corresponding run/debug configuration type.