IntelliJ IDEA 2017.2 Help

Run/Debug Configuration: JSR45 Compatible Server

This feature is supported in the Ultimate edition only.

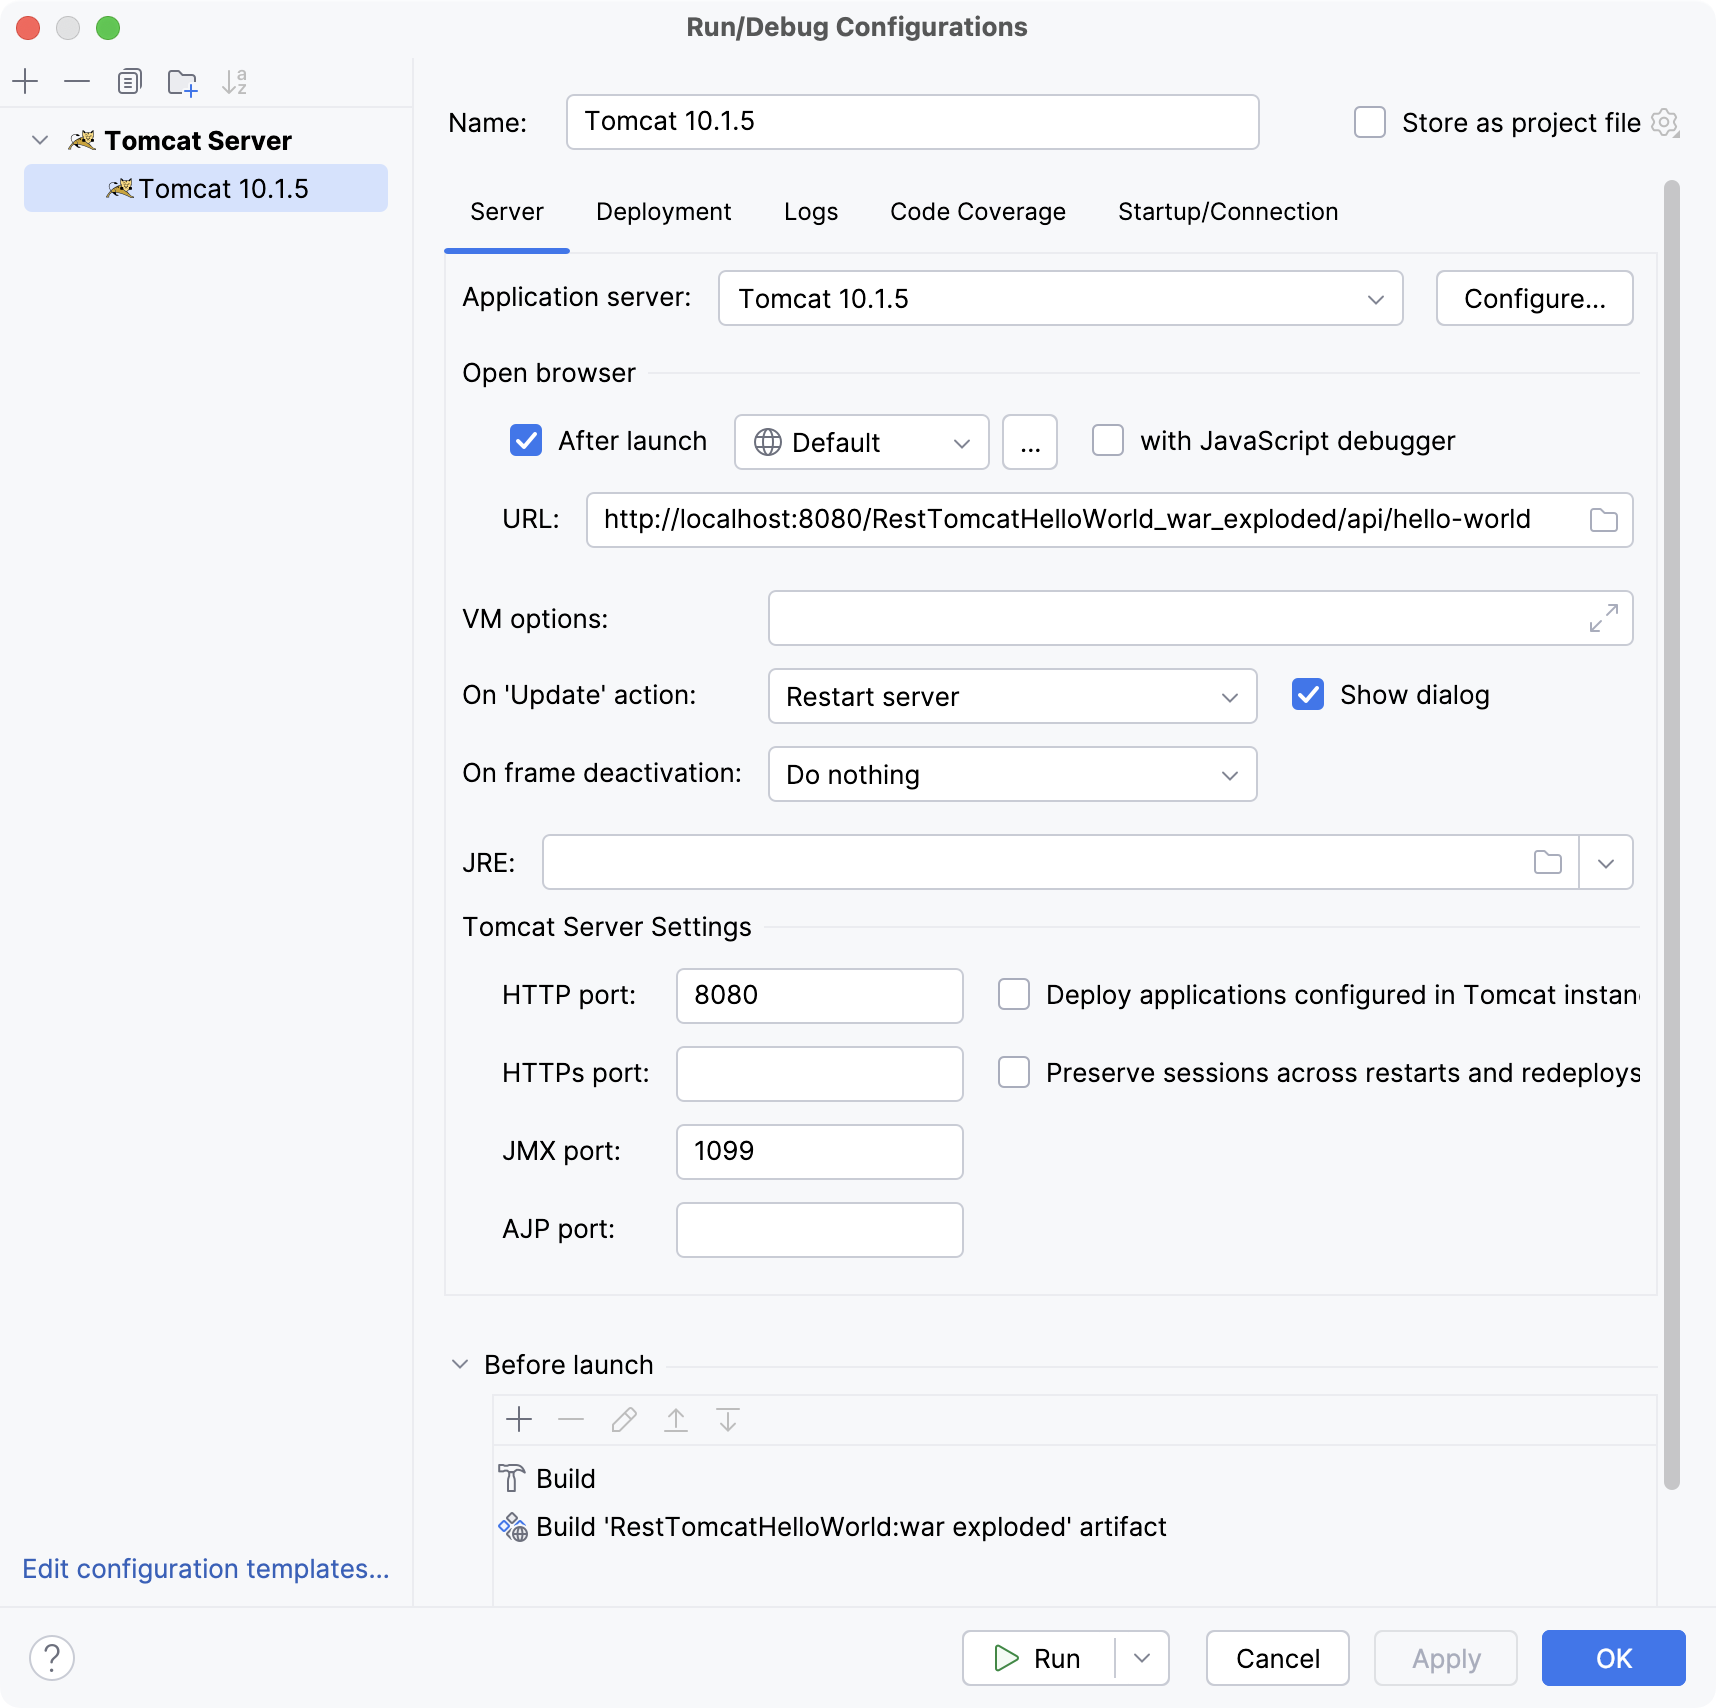
Use this dialog to create or edit run/debug configurations for JSR45-compatible application servers.

Generally, you may want to use this type of run/debug configuration under the following conditions:

  • The server you are going to work with supports JSR-45.
  • IntelliJ IDEA doesn't provide a dedicated plugin for integration with this server.

On this page:

Server tab

ItemLocal/RemoteDescription
Application ServerBoth Select the server configuration to be used.

If the run/debug configuration is intended for working with a remote server, the same server version should be configured locally and associated with the run/debug configuration.

Click Configure to create a new server configuration or edit an existing one. (The Application Servers dialog will open.)

Start browserBothSelect this check box to run the default Web browser to study your application output there.
With JavaScript debuggerBoth If this check box is selected, the Web browser is started with the JavaScript debugger enabled.

JavaScript debugging is available for Firefox only. Note that when you debug your JavaScript in Firefox for the first time, the JetBrains Firefox extension will be installed.

Startup pageBothIn this field, specify the URL the browser should go to when started. In most typical cases, this URL will correspond to the root of your Web application or its starting page.
VM optionsLocalIf necessary, specify the command-line options to be passed to the server JVM at the server start.

If you need more room to type, click shift enter button next to the field to open the VM Options dialog where the text entry area is larger.

When specifying the options, follow these rules:

  • Use spaces to separate individual options, for example, -client -ea -Xmx1024m.
  • If an option includes spaces, enclose the spaces or the argument that contains the spaces in double quotes, for example, some" "arg or "some arg".
  • If an option includes double quotes (e.g. as part of the argument), escape the double quotes by means of the backslashes, for example, -Dmy.prop=\"quoted_value\".
On 'Update' actionLocalSelect the action to be performed when the application is updated in the Run or the Debug tool window.
Show dialogLocal Select this check box if you want to see the Update <application name> dialog every time you perform the Update action.

The Update <application name> dialog is used to view and change the current update option (for example, Restart server) prior to actually updating the application.

JSP's packageBothSpecify the Java package prefix to be used for jsp-to-servlet translation.
VM options variableLocalIf there is a variable which stores the command-line JVM options, you can specify the name of this variable in this field. In this way, you can pass the corresponding options to the server JVM at the server start.
PortBothSpecify the HTTP server port.
Use JSP's line mapping model specific for WebSphere 5.1BothIf the run/debug configuration is intended for working with WebSphere Server 5.1, select this check box to be able to debug your JSPs.

(To be able to debug JSPs, it’s necessary to maintain relationships between the lines of the source files and the corresponding positions in the compiled code. All the servers except WebSphere 5.1 form such relationships similarly.)

HostRemoteThe DNS name or the IP address of the server host (for example, localhost, 127.0.0.1, etc.).

Logs tab

Use this tab to specify which log files generated while running or debugging should be displayed in the console, that is, on the dedicated tabs of the Run or Debug tool window.

ItemDescription
Is ActiveSelect check boxes in this column to have the log entries displayed in the corresponding tabs in the Run tool window or Debug tool window.
Log File EntryThe read-only fields in this column list the log files to show. The list can contain:
  • Full paths to specific files.
  • Ant patterns that define the range of files to be displayed.
  • Aliases to substitute for full paths or patterns. These aliases are also displayed in the headers of the tabs where the corresponding log files are shown.

    If a log entry pattern defines more than one file, the tab header shows the name of the file instead of the log entry alias.

Skip ContentSelect this check box to have the previous content of the selected log skipped.
Save console output to fileSelect this check box to save the console output to the specified location. Type the path manually, or click the browse button and point to the desired location in the dialog that opens.
Show console when a message is printed to standard output streamSelect this check box to activate the output console and bring it forward if an associated process writes to Standard.out.
Show console when a message is printed to standard error streamSelect this check box to activate the output console and bring it forward if an associated process writes to Standard.err.
addClick this button to open the Edit Log Files Aliases dialog where you can select a new log entry and specify an alias for it.
edit1Click this button to edit the properties of the selected log file entry in the Edit Log Files Aliases dialog.
deleteClick this button to remove the selected log entry from the list.
browseButton.png Click this button to edit the select log file entry. The button is available only when an entry is selected.

Code Coverage tab

Use this tab to configure code coverage monitoring options.

Note that this tab is not available for remote servers.

ItemDescription
Choose code coverage runnerSelect the desired code coverage runner.
SamplingSelect this option to measure code coverage with minimal slow-down.
TracingSelect this option to collect accurate branch coverage. This mode is available for the IntelliJ IDEA code coverage runner only.
Track per test coverageSelect this check box to detect lines covered by one test and all tests covering line.
Packages and classes to record code coverage dataIf necessary, specify the classes and packages to be measured.

Use add-class or add-package to add classes or packages to the list.

To remove the classes or packages from the list, select the corresponding list items and click delete.

Enable coverage in test folders.Select this check box to include the test source folders in code coverage analysis.

Startup/Connection tab

ItemLocal/RemoteDescription
run Run 
debug Debug
Both Select Run or Debug to show settings either for the run or the debug mode.
runWithCoverage Run with CoverageLocalSelect Run with Coverage to show settings for run with coverage mode.
Startup scriptLocal Specify the script to be used to start the server. If necessary, you can also specify the script parameters and the options to be passed to the server JVM.

You can provide all the necessary information right in the field, by typing. As an alternative:

  • To specify the script, click browseButton and select the desired script in the dialog that opens.
  • To specify the parameters, click shift enter button and specify the script parameters and VM options in the Configure VM and Program Parameters dialog.

    When specifying the parameters and options, follow these rules:

    • Use spaces to separate individual parameters and options, for example, -client -ea -Xmx1024m.
    • If a parameter or an option includes spaces, enclose the spaces or the argument that contains the spaces in double quotes, for example, some" "arg or "some arg".
    • If a parameter or an option includes double quotes (e.g. as part of the argument), escape the double quotes by means of the backslashes, for example, -Dmy.prop=\"quoted_value\".
Shutdown scriptLocal Specify the script to be used to stop the server. If necessary, you can also specify the script parameters and the options to be passed to the server JVM.

You can provide all the necessary information right in the field, by typing. As an alternative:

  • To specify the script, click browseButton and select the desired script in the dialog that opens.
  • To specify the parameters, click shift enter button and specify the script parameters and VM options in the Configure VM and Program Parameters dialog.

    When specifying the parameters and options, follow these rules:

    • Use spaces to separate individual parameters and options, for example, -client -ea -Xmx1024m.
    • If a parameter or an option includes spaces, enclose the spaces or the argument that contains the spaces in double quotes, for example, some" "arg or "some arg".
    • If a parameter or an option includes double quotes (e.g. as part of the argument), escape the double quotes by means of the backslashes, for example, -Dmy.prop=\"quoted_value\".
Pass environment variablesLocalTo pass specific variables to the server environment, select this check box and specify the variables:
  • To add a variable, click new and specify the variable name and value in the Name and Value fields respectively.
  • To remove a variable from the list, select the variable and click delete.
PortLocalUse this field to change the debugger port (if necessary).
Debugger SettingsLocalClick this button to edit the debugger options on the Debugger page of the Settings dialog.
TransportRemote Specify the "transport" settings for the connection with the debugger. In technical terms, these are the parameters for the -Xrunjdwp command-line option:
  • Socket. Specify the debugger port in the Port field. The combination of these two settings translates into
    -Xrunjdwp:transport=dt_socket,address=<port>,suspend=n,server=y
  • Shared memory. Specify the shared memory address in the corresponding field. The combination of these two settings translates into
    -Xrunjdwp:transport=dt_shmem,address=<address>,suspend=n,server=y

Note that as you change the transport settings, what follows transport= within -Xrunjdwp in the area above also changes. In this way you control the corresponding command-line debugger parameters which you cannot edit directly.

Before Launch options

Specify which tasks should be carried out before starting the run/debug configuration.

ItemShortcutDescription
new Alt+Insert Click this icon to add a task to the list. Select the task to be added, for example:
  • Run External tool. Select this option to run an application which is external to IntelliJ IDEA. In the dialog that opens, select the application or applications that should be run. If the necessary application is not defined in IntelliJ IDEA yet, add its definition. For more information, see Configuring Third-Party Tools and External Tools.
  • Make. Select this option to compile the project.

    If an error occurs during the compilation, IntelliJ IDEA won't attempt to start the run/debug configuration.

  • Make, no error check. The same as the Make option but IntelliJ IDEA will try to start the run/debug configuration irrespective of the compilation result.
  • Build Artifacts. Select this option to build an artifact or artifacts. In the dialog that opens, select the artifact or artifacts that should be built.

    See also,Working with Artifacts.

  • Run Another Configuration. Select this option to execute another run/debug configuration. In the dialog that opens, select the configuration to be run.
  • Run Ant target. Select this option to run an Ant target. In the dialog that opens, select the target to be run. For more information, see Ant.
  • Generate CoffeeScript Source Maps. Select this option to generate the source maps for your CoffeeScript sources. In the dialog that opens, specify where your CoffeeScript source files are located. For more information, see CoffeeScript.
  • Run Maven Goal. Select this option to run a Maven goal. In the dialog that opens, select the goal to be run.

    For more information, see Maven.

  • Run External tool. Select this option to run an application which is external to IntelliJ IDEA. In the dialog that opens, select the application or applications that should be run. If the necessary application is not defined in IntelliJ IDEA yet, add its definition. For more information, see Configuring Third-Party Tools and External Tools.
delete Alt+Delete Click this icon to remove the selected task from the list.
edit1 EnterClick this icon to edit the selected task. Make the necessary changes in the dialog that opens.
arrowUp arrowDownAlt+Up/Alt+DownClick these icons to move the selected task one line up or down in the list. (The tasks are performed in the order that they appear in the list.)
Show this pageSelect this check box to show the run/debug configuration settings prior to actually starting the run/debug configuration.
Activate tool window If this check box is selected, the Run or the Debug tool window opens when you start the run/debug configuration.

Otherwise, the tool window isn't shown. However, when the configuration is running, you can open the corresponding tool window for it yourself if necessary.

Toolbar

ItemShortcutDescription
newAlt+InsertCreate a run/debug configuration.
deleteAlt+DeleteDelete the selected run/debug configuration.
copyCtrl+DCreate a copy of the selected run/debug configuration.
settingsView and edit the default settings for the selected run/debug configuration.
arrowUparrowDownAlt+Up/Alt+DownMove the selected run/debug configuration up and down in the list.

The order of configurations in the list defines the order in which the configurations appear in the corresponding list on the main toolbar.

folderYou can group run/debug configurations by placing them into folders.

To create a folder, select the configurations to be grouped and click folder. Specify the name of the folder.

Then, to move a configuration into a folder, between the folders or out of a folder, use arrowUp and arrowDown. You can also drag a configuration into a folder.

To remove grouping, select a folder and click delete.

See also, Creating Folders and Grouping Run/Debug Configurations.

Last modified: 29 November 2017

See Also