Analyze objects in the JVM heap
IntelliJ IDEA lets you explore objects in the JVM heap during a debug session in the Memory view (to open it, click Restore 'Memory' View ![]() in the top-right corner of the Debug tool window).
in the top-right corner of the Debug tool window).
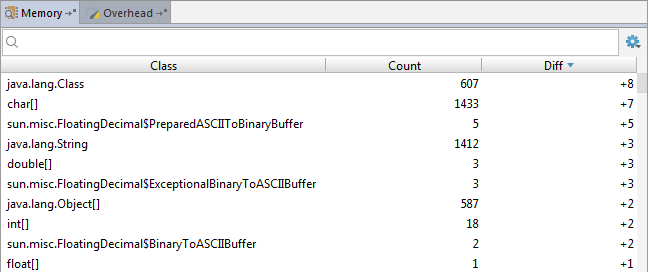
The Memory view shows you the total number of objects in the heap:

When you step over the code, the Diff column shows how the number of objects changes between the debugger stops, which helps you see how the code you are stepping affects the heap.
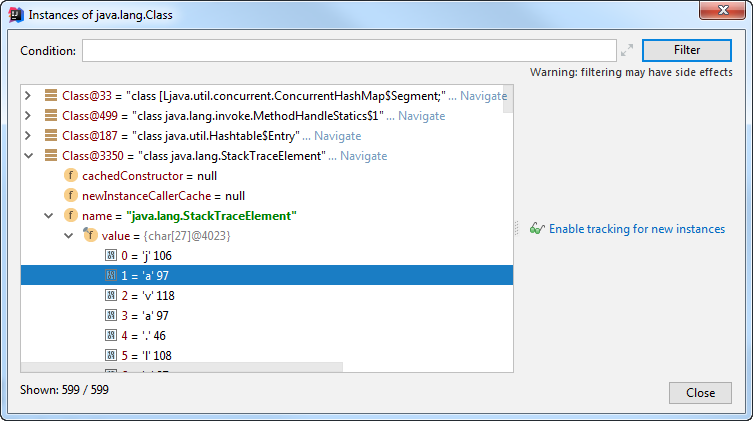
Double-click a class name to view all instances of this class:

This dialog lets you filter instances by an evaluated expression, enable tracking of new instances for this class, and perform all debugger operations, such as Inspect, Mark Object, Evaluate Expression, Add to Watches, etc. from the context menu.
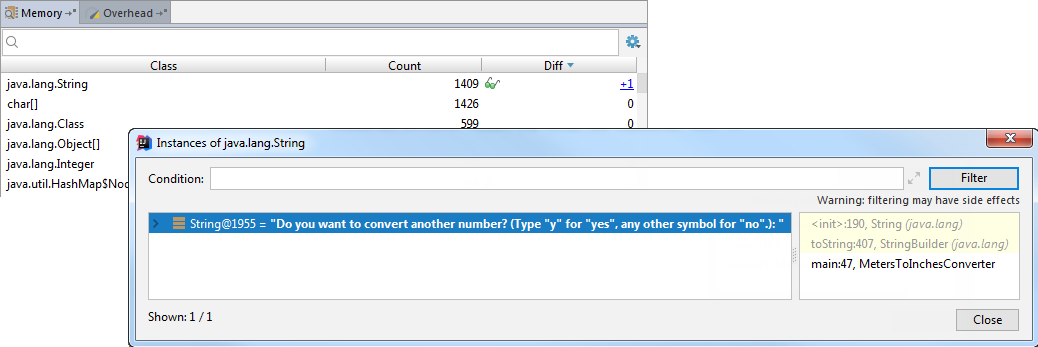
When you enable tracking of new instances for a class, the ![]() icon appears next to the corresponding object in the Memory view and, if the number of object changes, the value in the Diff column becomes clickable, which lets you quickly check what the new objects are:
icon appears next to the corresponding object in the Memory view and, if the number of object changes, the value in the Diff column becomes clickable, which lets you quickly check what the new objects are:

To disable tracking of new instances for a class, right-click and deselect the Track New Instances option.
Click the ![]() icon in the top-right corner to toggle the following viewing options:
icon in the top-right corner to toggle the following viewing options:
- Show With Instances Only: if selected, only classes that have instances are listed.
- Show Non-Zero Diff Only: if selected, only objects whose number has changed since the last debugger stop are listed.
- Show Tracked Classes Only: if selected, only classes for which tracking of new instances is enabled are listed.
- Enable Tracking With Hidden Memory View: if selected, tracking of new instances for classes will still be enabled, even if the Memory view is closed.