Debugging with PHP Exception Breakpoints
This feature is only supported in the Ultimate edition.
The following is only valid when PHP Plugin is installed and enabled!
In this section:
Configuring PHP Exception breakpoints
- On the main menu, choose , or press Ctrl+Shift+F8.
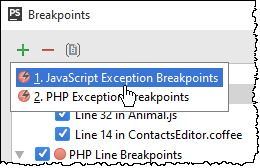
- In the Breakpoints dialog box that opens, click
 .
. - From the drop-down list, choose PHP Exception Breakpoint.

- In the Add Exception Breakpoint dialog box that opens, specify the errors or exceptions on which you want the debugger to suspend.
- To break on PHP error conditions, choose one of the standard types from the drop-down list, the available options are Warning, Notice, or Deprecated.
- Alternatively, specify a custom Exception type. Note that E_ERROR, E_PARSE, and E_COMPILE_ERROR are not handled as they halt execution of the PHP engine.
IntelliJ IDEA returns you to the Breakpoints dialog box.
- Configure the new exception breakpoint as described in Configuring Breakpoints.
Examining the suspended program
When the debugger breaks on an error or an exception, IntelliJ IDEA sets a PHP Exception Breakpoint.
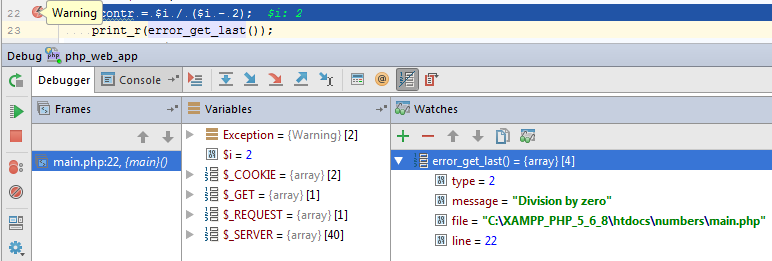
- To see the breakpoint type, hover the mouse pointer over the breakpoint. The type is displayed in a pop-up window:

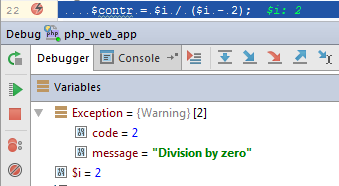
- The Variables pane displays a fake
Exceptionvariable which shows the exception message and the exception code:
- To get more information on PHP errors, add a watch for the
error_get_last()function, see Adding, Editing and Removing Watches. Then the details of errors will be displayed in the Watches pane:
Last modified: 6 March 2018