Analyze Java Stream operations
Java 8 Streams may sometimes be difficult to read and debug, as to understand how a program reached a certain output, you may need to insert additional breakpoints, and analyze each transformation inside a stream.
IntelliJ IDEA provides a solution to this by letting you visualize what is going on in Java Stream operations
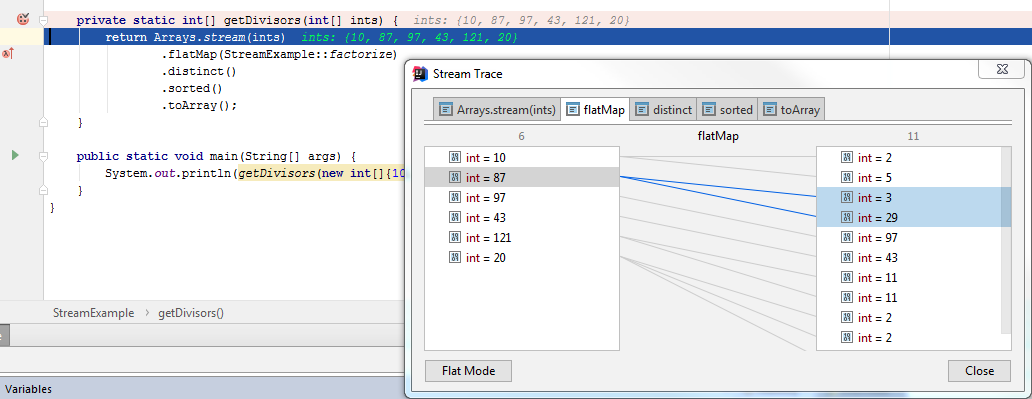
When the debugger stops before or inside a Stream API calls chain, click the Trace Current Stream Chain icon ![]() in the Debugger toolbar. After the current data stream has been evaluated, you get a visualization of what happens to each element in each transformation, and how its value changes as it passes all steps in a stream:
in the Debugger toolbar. After the current data stream has been evaluated, you get a visualization of what happens to each element in each transformation, and how its value changes as it passes all steps in a stream:

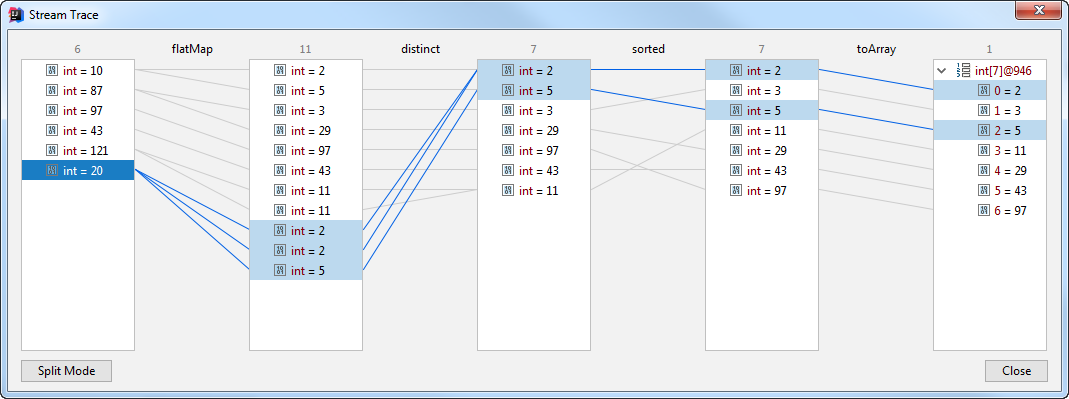
Click the Flat Mode button to see all operations at once in one view:
