Debugging
This section describes the procedures that are common for various types of applications.
IntelliJ IDEA provides a full range of facilities for debugging your source code:
Breakpoints in Java .
Breakpoints in JavaScript.
Multiple simultaneous debugging sessions.
Customizable breakpoint properties: conditions, pass count, etc.
Runtime evaluation of expressions.
If you want to see the list of all currently debugging applications, select from the main menu. Refer to the Viewing Running Processes section for details.
Start a debugging session
Configure the dependencies and libraries to be passed to the compiler and generate the debugging information.
Configure common debugger behavior, including stepping speed, class reloading policy, or scrolling of the editor canvas.
To debug CoffeeScript, TypeScript, and Dart code, you need to generate a source map for it. This will set the correspondence between lines in your original code and in the generated JavaScript code. If no source map is generated, your breakpoints will not be recognized and processed correctly.
Define a run/debug configuration for the application to be debugged.
Create a breakpoint .
Click the Debug icon (
 ). Read more about debugging sessions in Starting the Debugger Session.
After you've started a debug session, the ![]() icon that marks the Debug tool window toggles to
icon that marks the Debug tool window toggles to ![]() to indicate that the debug process is active.
to indicate that the debug process is active.
Note that IntelliJ IDEA lets you debug decompiled code in the same way as your normal source files, provided that it contains line number attributes.
Debug
After you have configured a run configuration for your project, you can launch it in debug mode by pressing Shift+F9.
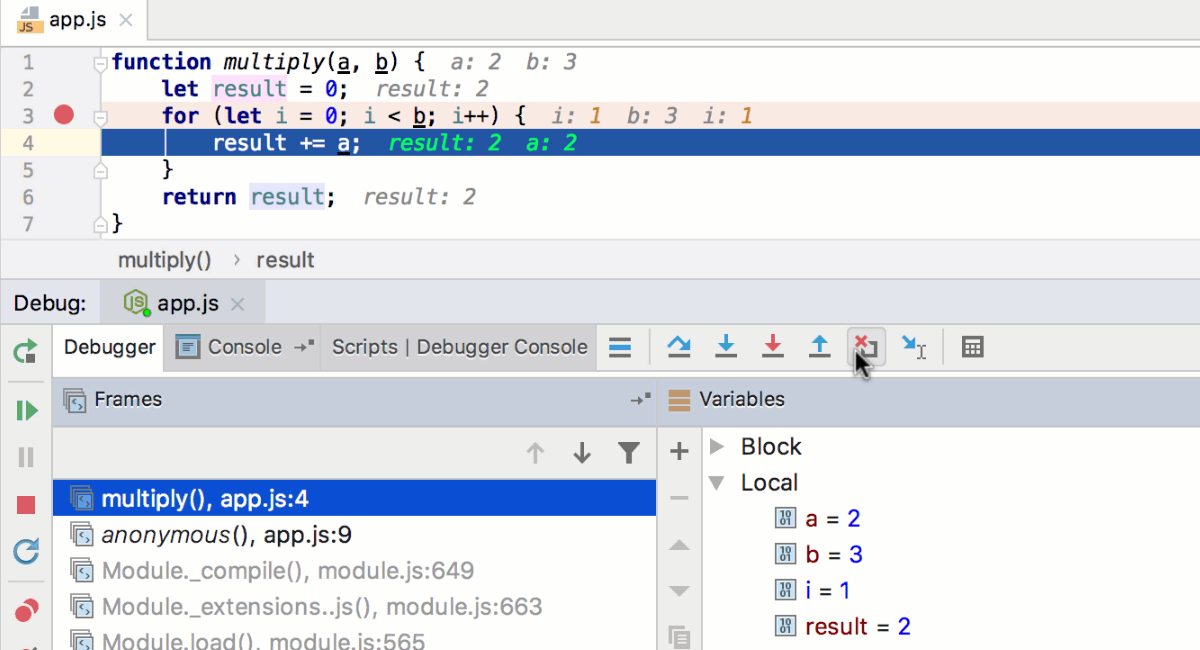
In the Debug tool window you can see the list of frames and threads with their states, variables and watches. When you select a frame, you see the variables corresponding to the selected frame.
Breakpoints
Customize breakpoint settings
To customize breakpoint settings, press Ctrl+Shift+F8. To see all breakpoints in the project (with additional settings), click More or press the same shortcut Ctrl+Shift+F8 again.

If you have any instance marked with a label, you can use it in the condition expression as well:

Suspend code execution when a field is accessed for read or write
In addition to conditional breakpoints you can also use Field breakpoints. These breakpoints stop when a field is accessed for read or write. To create such a breakpoint, just click on the gutter at a field declaration:

Do not suspend code execution
Use action breakpoints to evaluate a variable at a particular line of code without suspending code execution. To create an action breakpoint, click the gutter while pressing Shift.

Create a temporary breakpoint
To create a breakpoint that stops only once, click the left gutter while holding Shift+Alt. For more information, refer to the section Breakpoints.

Disable breakpoints
To disable a breakpoint, click the breakpoint while pressing Alt. Refer to the section Breakpoints for details.

Debugger session
Smart step into
Sometimes it happens that you stay at a line and want to step into a particular method but not the first one that will be invoked. In this case use Smart step into by pressing Shift+F7 to choose a particular method. This is a great time-saver.

Refer to the section Choosing a Method to Step Into for details.
Drop frame
In case you want to “go back in time” while debugging you can do it via Drop Frame action. This is a great help if you mistakenly stepped too far. This will not revert the global state of your application but at least will get you back by stack of frames.

The icon ![]() is described in the Debug tool window reference.
is described in the Debug tool window reference.
Run to cursor
To stop code execution at the cursor position without adding another breakpoint, click the Run to cursor icon(![]() ) or press Alt+F9.
) or press Alt+F9.

The icon ![]() is described in the toolbar reference of the Debug tool window.
is described in the toolbar reference of the Debug tool window.
Mark object
To add a colored label to an instance, press F11 or the context menu in the Variables and Watches tabs.

The next time this instance appears in Watches, Variables or Evaluate expression, you will see the label:

Evaluate expression
While in debug mode, you can evaluate any expression by pressing Alt+F8.

This tool provides code completion just as in the editor so it’s very easy to enter any expression:

If you have any instances marked with labels, code completion will offer you its names so you can evaluate them:

Refer to the section Evaluating Expressions for details.
Reload changes and hot swapping
Sometimes it happens that you need to insert minor changes in your code without shutting down the process. Since Java VM has such a feature as HotSwap, the IDE handles these cases automatically and offers you to reload the changed classes whenever you compile the changed classes while in debug mode.
Keep in mind that Java VM’s HotSwap has a number of constraints and does not support reloading of static fields and methods.
Remote debug
The final thing you definitely should know about debugging in IntelliJ IDEA is Remote debug. Remote debug means attaching debugger to a process which is already running on a specific port on your or any other’s host. This way you can attach the debugger to your application server which is running standalone.
To create a remote configuration, go to Edit configurations and add Remote run configuration. Make sure to specify the correct host and port before you run this configuration.
Settings
Configuring debugger settings
To change debugger settings, click . In the Settings menu, click .
Useful debugger shortcuts
Action | Hotkey |
|---|---|
| Toggle breakpoint | Ctrl+F8 |
| Resume program | F9 |
| Step over | F8 |
| Step into | F7 |
Stop | Ctrl+F2 |
| View breakpoint details/all breakpoints | Ctrl+Shift+F8 |
Debug code at caret | Shift+F9 (within the main method), or Shift+Alt+F9 |