Viewing Code Coverage Results
Viewing code coverage helps you detect pieces of your source code that are not affected by simulation.
To view code coverage results
- Do one of the following:
Run the desired class with coverage, select suite to show, and open class in the editor.
From the main menu, select .
Press Ctrl+Alt+F6.
- View coverage results:
In the Project tool window:
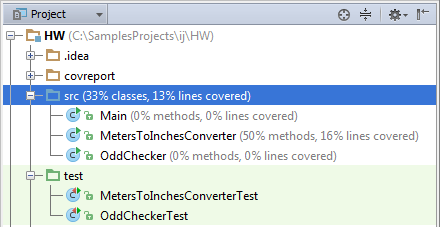
In the dedicated Coverage tool window:

Open in the editor the files you want to explore.
Use the color indicators in the left gutter to detect the uncovered lines of code.
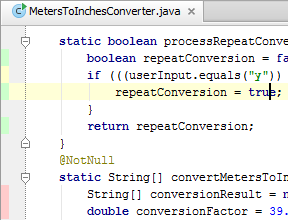
- To find out how many times a line has been hit, click the line in the gutter area.
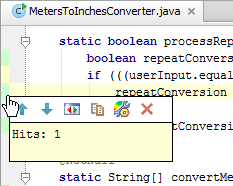
The pop-up window that opens shows the statistic for the line at caret. For lines with conditions, the pop-up window also provides statistic:
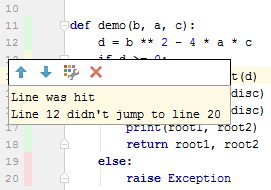
Use the following toolbar buttons:

 : jump to the next/previous groups of covered or uncovered lines.
 : view JUnit tests that cover the line at caret.
 The test that covers the line at caret, is shown in a pop-up window:
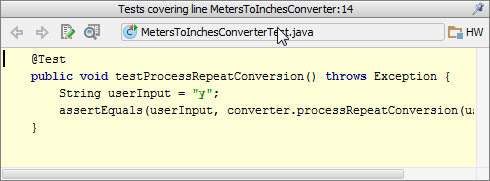
This button is only available in the Tracing mode, and with the Track per test coverage checkbox selected.
When pinned, this pop-up window converts into the Find tool window.
 : show byte code of the current class in a pop-up window:
This button is only available, when Byte Code Viewer plugin that comes bundled with the product, is enabled.
When pinned, this pop-up window converts into the Byte Code Viewer.
 : open the Color Scheme settings, where you have to choose the node Line Coverage.
 : hide coverage information.
Create missing tests, as described in the section Creating Tests.