Attach to process
IntelliJ IDEA provides a way to attach the debugger to both local and remote processes.
The steps to attach to a process depend on how and where the process was launched.
While IntelliJ IDEA debugger is capable of attaching to any process, it is recommended to prefer a simpler way when there is one. You don't want to remotely attach to a 'hello world' running on the same machine.
Options described in this topic are useful in more complicated cases, such as when we need to debug a process that is running remotely, or a process that has been started in a way that does not allow for debugging.
Prerequisites
While not absolutely required to attach, the following prerequisites have to be met to enable full-fledged debugging:
The remote process should be started with the debug agent.
The application needs to be compiled with debugging information.
You need to have the application's source code.
Debugging is still possible even when none of these are met, however, there are limitations associated with each of them. These requirements are described in more detail in subsequent chapters.
Debug agent
Processes intended to allow debugger connections are started with the debug agent. Debug agent is a component of a host application that is responsible for communicating with the debugger. The communication happens over a socket connection, irrespective of whether the process is local or remote.
Start a process with the debug agent
When starting the process, add the following line to its VM options:
-agentlib:jdwp=transport=dt_socket,server=y,suspend=n,address=*:5005The option has the following parameters:
address– the port that will be used for debuggingserver=y– specifies that the process should listen for incoming debugger connections (act as a server).suspend– specifies whether the VM should wait until the debugger has connected or start executing the application's code immediately
-agentlib:jdwp=transport=dt_socket,server=n,address=192.168.1.178:5005,suspend=y,onthrow=<FQ exception class name>,onuncaught=<y/n>The option has the following parameters:
address– the IP address and the port of the server end. Both IPv4 and IPv6 are supported.server=n– specifies that the process should connect to the debugger (act as a client)suspend=y– specifies that the VM should wait until the debugger has connected before executing the application code.onthrow– optionally delays the connection until the specified exception is thrown. Use the exception's fully-qualified name as the value.onuncaught– optionally delays the connection until an uncaught exception is thrown. Use the exception's fully-qualified name as the value.
The format may differ depending on the JDK version. To get an appropriately formatted string for your JDK, you can select the required JDK version in the Remote JVM debug run/debug configuration and copy it from there.
If the process is launched through another process, for example, a web container like Apache Tomcat, the debug agent VM option may need to be specified indirectly. For example, the other process may use a configuration file for passing the option to the host VM. In case of popular web servers and frameworks, IntelliJ IDEA provides run/debug configurations that do this for you.
Add IntelliJ IDEA's debug agent
You can use advanced IntelliJ IDEA's functionality, such as Async stack traces, when debugging a process launched outside IntelliJ IDEA. For this you need to load the IntelliJ IDEA's debug agent to the process.
Add debugger-agent.jar from IntelliJ IDEA's installation directory using the
javaagentVM option. For example:java -agentlib:jdwp=transport=dt_socket,server=y,suspend=n,address=\*:5005 -javaagent:"/Users/me.user/Applications/IntelliJ IDEA Ultimate 2024.3.app/Contents/plugins/java/lib/rt/debugger-agent.jar" Alphabet
If a local process doesn't use the debug agent, you can still attach to it in the read-only mode. The debugger functionality will be limited to viewing the call stack and examining the related local variables.
An example of the situation when it can be useful is when your program hung while batch-processing some files. Using the read-only mode, you can figure out what method caused the program to hang, and which file it is processing at the moment.
Debug information
Debug information is a special kind of information in the application bytecode. The debugger uses this information to identify local variables, line numbers, and so on. The bytecode of an application may or may not have debugging information included.
The debug information is provided to the program at compile-time. This is controlled with the -g compiler flag. By default, the compiler includes most of the information required for debugging, but if it was not you, who compiled the application, it may happen that the program that you are going to debug was compiled without this information.
If the bytecode of the application does not include debug information, the debugger will still be able to attach, however, some of the debugger functionality may be unavailable. For example, it is not possible to view line numbers or stop at breakpoints without line number information:
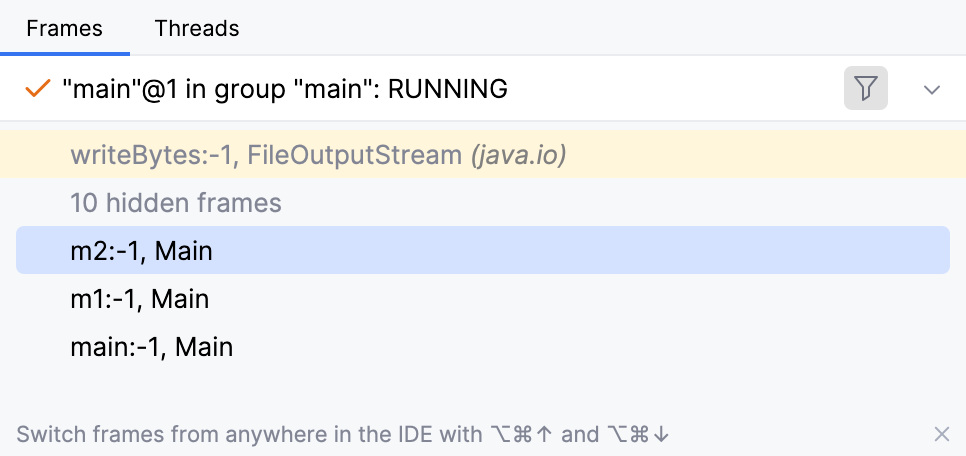
The bare minimum that is always available regardless of whether the debug information is present:
Class names, unless the code is obfuscated
Static and instance variables
Call stack
For more information about configuring debug info generation, refer to Java compiler documentation.
Application sources
It is recommended that you have the access to the sources of the project you are debugging. IntelliJ IDEA matches debugging events with the sources and displays information relevant to the debugging session in the editor. This allows you to view the debugging session as if it was the source code that is being executed.
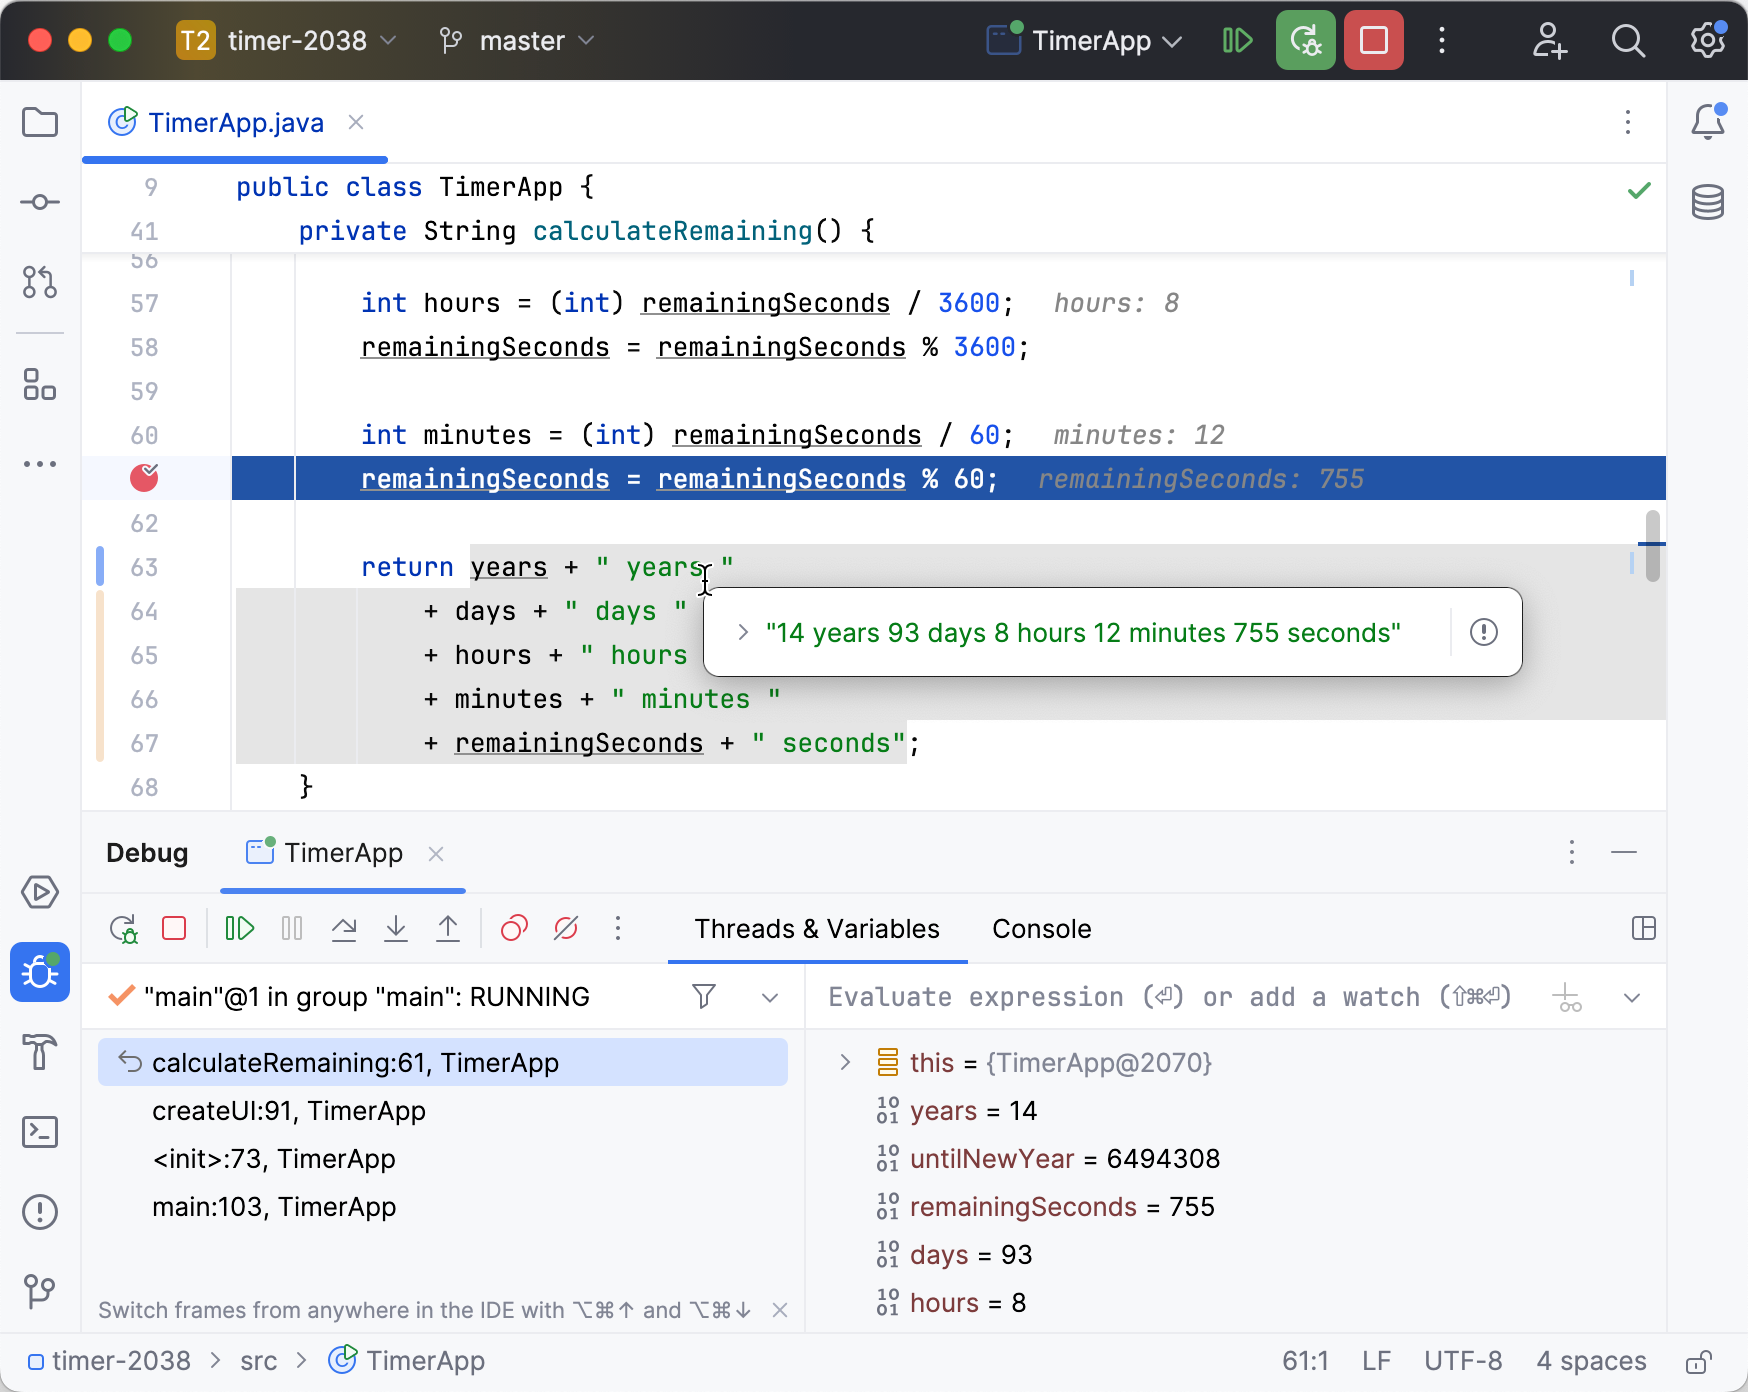
For IntelliJ IDEA to find the source files, they must be included in the classpath.
Attach to a remote process
Attaching to a remote process consists of two steps:
Create a run/debug configuration – the run/debug configuration specifies how the connection should be established. Once you create a run/debug configuration, it can be reused for other connections at the same host and port.
Start the run/debug configuration – when you start the run/debug configuration, IntelliJ IDEA starts and connects the debugger according to the setup defined in the run/debug configuration.
Create a run/debug configuration
Go to . Alternatively, press Alt+Shift+F10, then 0.
In the Run/Debug Configuration dialog, click
on the toolbar or press Alt+Insert. Select Remote JVM debug from the list.
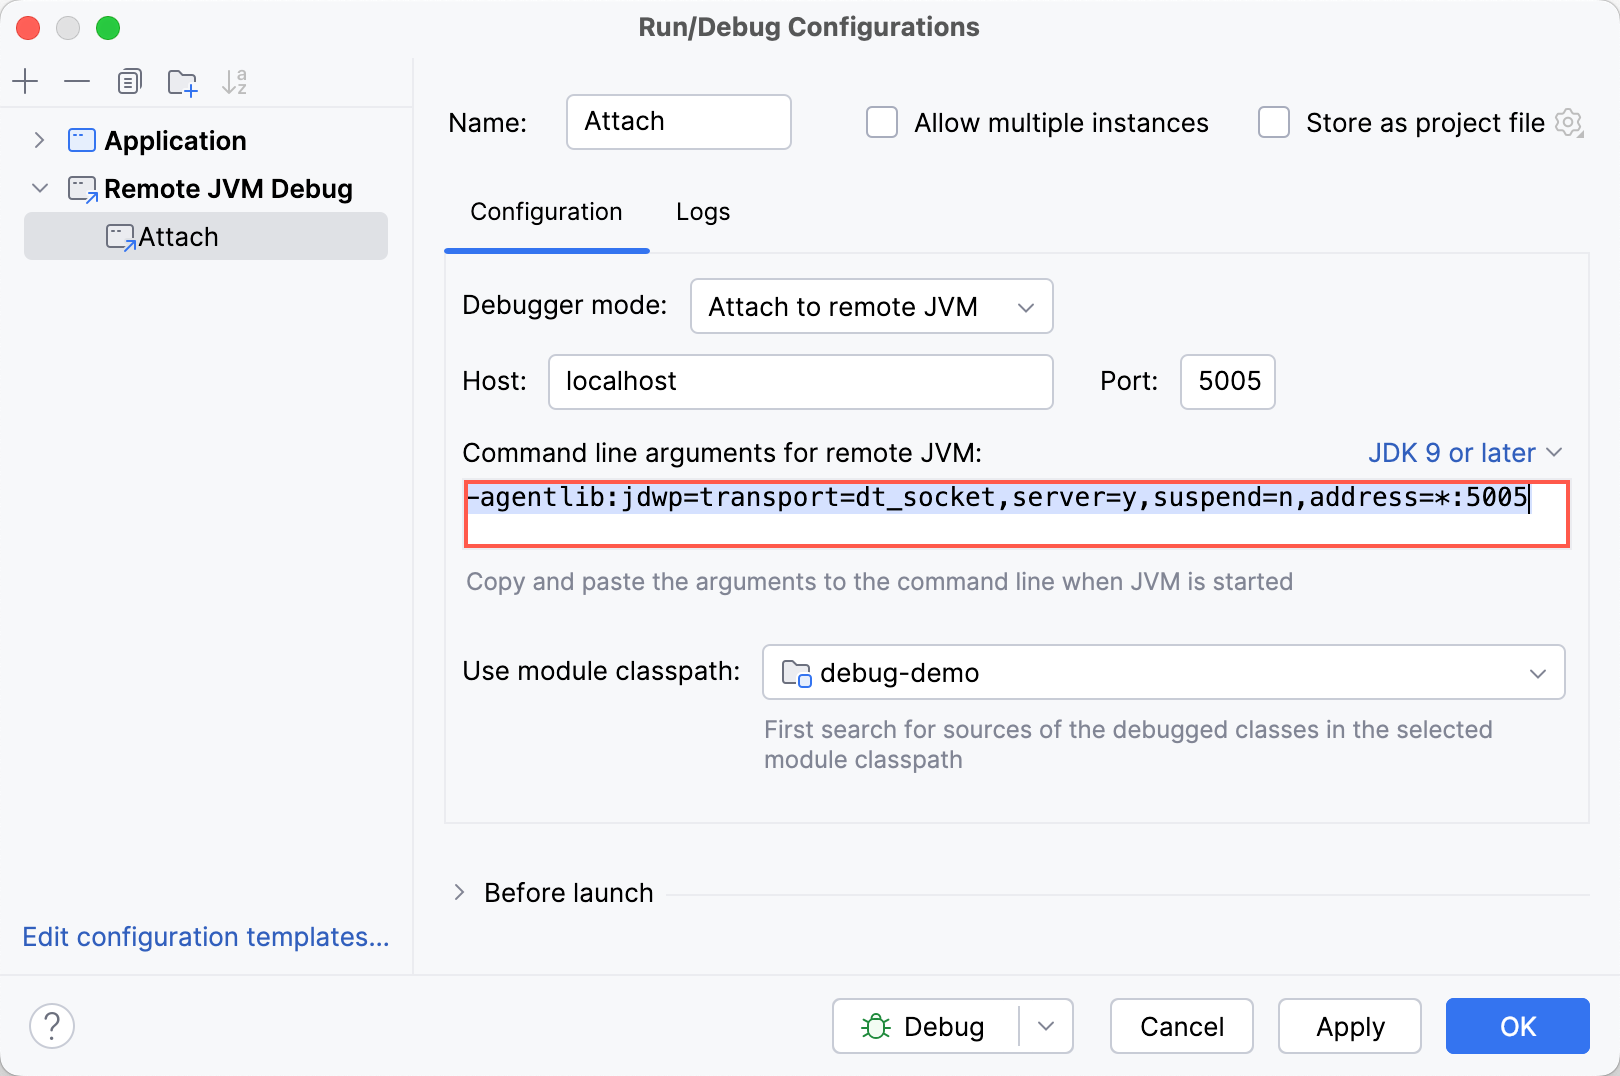
In Debugger mode, specify whether the debugger should connect to the remote JVM or listen for incoming connections.
If you choose Listen to remote JVM, specify whether you want to automatically restart the debugger after the remote JVM has disconnected. This way, the debugger will always be ready to handle incoming connections.
(for Windows) Optionally, specify the desired transport. IntelliJ IDEA selects the appropriate transport automatically, so you don't need to configure it unless you have special requirements regarding the communication method.
Specify the host and the port of the remote JVM. Both IPv4 and IPv6 are supported. Make sure that the port is specified correctly, is not in use, and not blocked by a firewall.
Specify the module to look for the sources. IntelliJ IDEA will first check the selected module, then the other modules, if any. Sources are matched using fully-qualified class names. If there is no match by the fully-qualified name, IntelliJ IDEA tries to find a match by the file name.
If you haven't yet configured the debug agent for the debuggee JVM, you can copy the required VM option from the Command line arguments for remote JVM field.
Start the run/debug configuration
Make sure that the host application is up and running and has been started with the VM option that adds the debug agent.
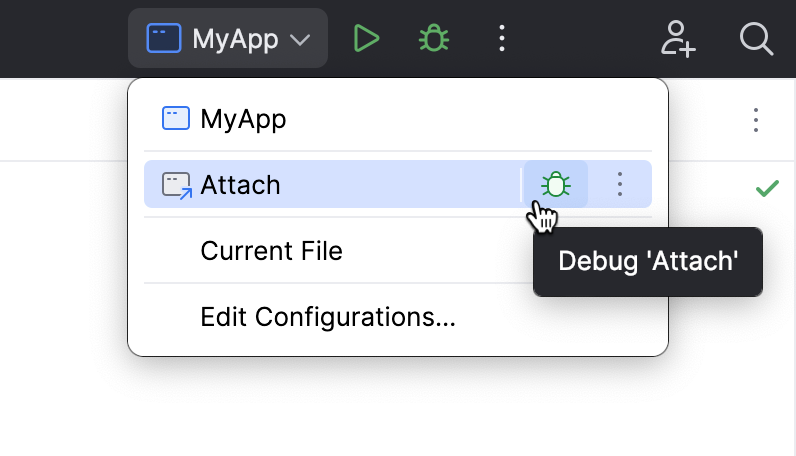
Launch the run/debug configuration you created earlier.
Browse available processes
Press Ctrl+Alt+F5 or select from the main menu.
IntelliJ IDEA will show the list of the running processes. If the process you want to attach to is not listed, try refreshing the list
. Select the process to attach to.
Attach to the current process
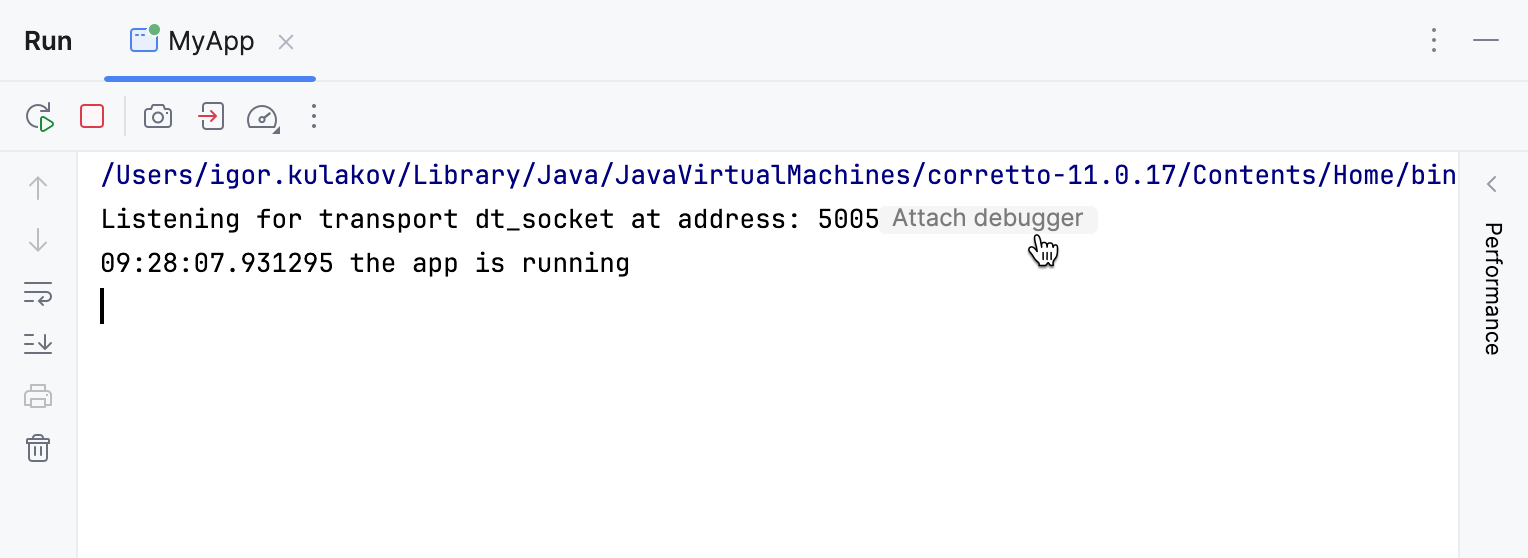
If you run the process with the debug agent from IntelliJ IDEA, you can attach to it right from the console.
Run the process from IntelliJ IDEA with the debug agent.
When the console appears, click the Attach debugger inlay hint.
Detach from the process
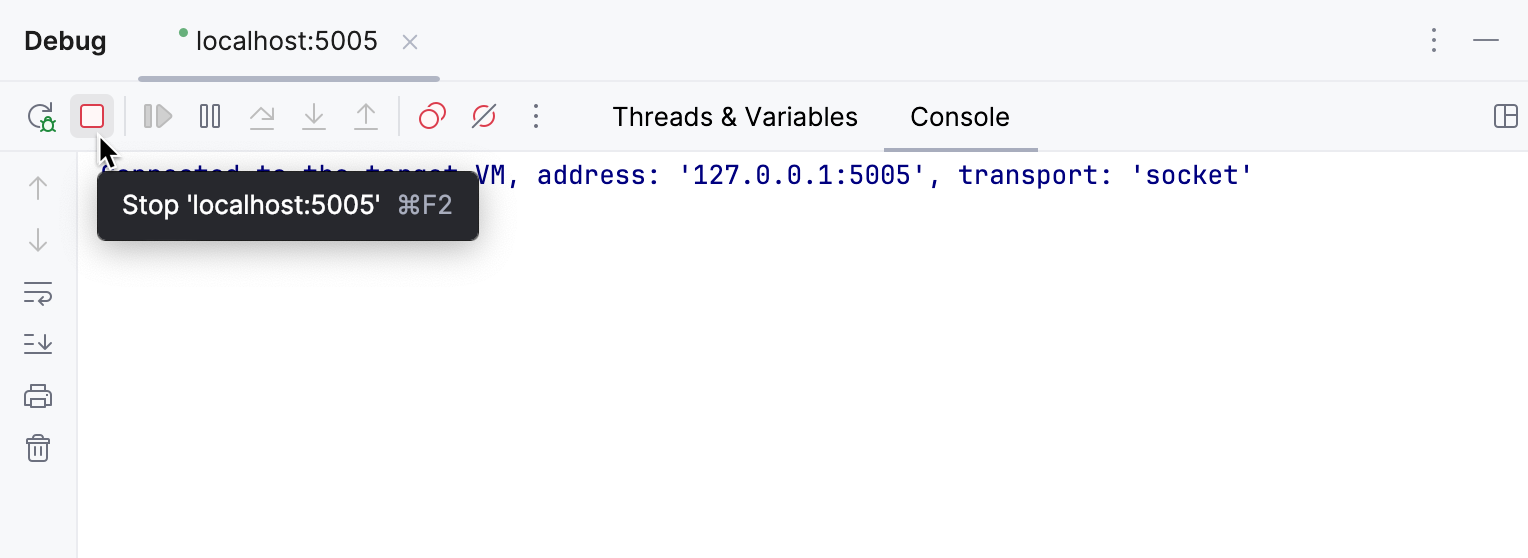
The steps to detach from a remote process are the same as for stopping a local debug session. However, unlike local sessions, the target process continues to run after the debugger detaches.
Click the Stop
button on the Debug tool window's toolbar on in the Debug tool window.
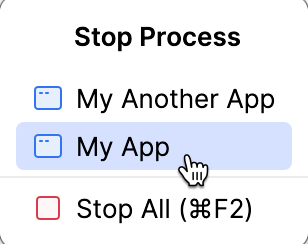
Alternatively, click Stop
on the main toolbar or press Ctrl+F2, then select the session to be closed.
Terminate the remote process
When you do not need the remote process anymore, you can terminate it by closing the corresponding debugger tab. By default, IntelliJ IDEA asks whether you want to terminate the process or disconnect from it:
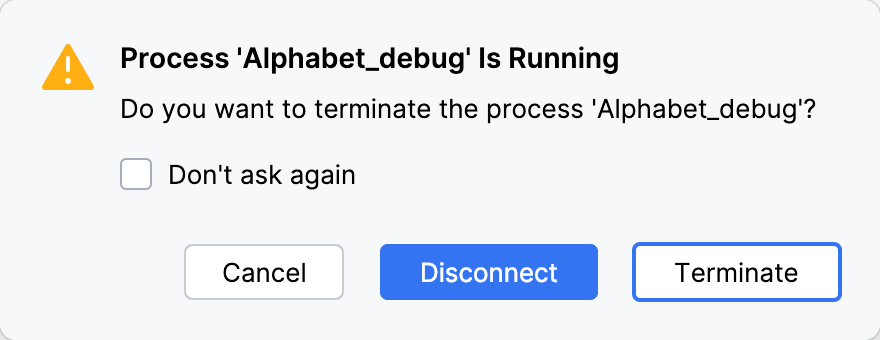
You can customize the default choice on the the Appearance & Behavior | System Settings settings page Ctrl+Alt+S.