Profiling tools
Profiling tools are useful for exploring which methods are run most of the time. They can help you find the most expensive methods and understand exactly how they behave.
IntelliJ IDEA is integrated with the following profiling tools:
Async Profiler: a CPU and memory profiling tool for Linux and macOS.
Java Flight Recorder: a CPU tool provided by Oracle available on Linux, macOS, and Windows.
Async Profiler
Async Profiler monitors JVM-level parameters of your application to provide a better understanding of how your application is executed and how exactly memory and CPU resources are allocated. This data can help you find and resolve performance problems.
You can run the profiler for projects built with Gradle and with the native IntelliJ IDEA build tool. If you use Maven, you can run the application with the native IntelliJ IDEA runner to get the profiling data.
Once the analysis is finished, the profiler visualizes the output data in the reports.
Before you start using the profiler on Linux, install the Perf tool and adjust kernel options. On macOS, the profiler works out of the box.
Install Perf and adjust kernel options on Linux
If you're using Linux, make sure to complete the following steps:
-
Install the Perf tool for your particular kernel release.
Use
uname -rto find out the exact version, and then install the corresponding linux-tools package. For example:$ uname -r 4.15.0-36-generic $ sudo apt-get install linux-tools-4.15.0-36-generic -
Adjust kernel options
perf_event_paranoid - controls the use of the performance events data by non-root users.
Set the value to be less than 2 to let the profiler collect performance information without root privileges:
sudo sh -c 'echo 1 >/proc/sys/kernel/perf_event_paranoid'kptr_restrict - sets restrictions on exposing kernel addresses.
To have kernel symbols properly resolved, disable the protection offered by kptr_restrict by setting its value to 0:
sudo sh -c 'echo 0 >/proc/sys/kernel/kptr_restrict'
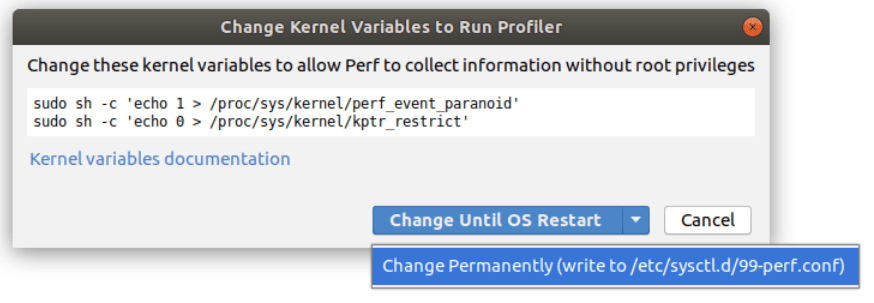
By default, these changes affect your current OS session only. To keep the settings across system reboots, run:
sudo sh -c 'echo kernel.perf_event_paranoid=1 >> /etc/sysctl.d/99-perf.conf' sudo sh -c 'echo kernel.kptr_restrict=0 >> /etc/sysctl.d/99-perf.conf' sudo sh -c 'sysctl --system'Upon the first launch of the profiler, IntelliJ IDEA checks whether kernel variables are already set up and suggests the necessary changes:
Profiler configuration
IntelliJ IDEA features two pre-defined Async Profiler configurations: the CPU profiler and the memory allocation profiler that you can find in .
These configurations are adjusted to provide the most accurate results, that is why they don't require any modifications. However, if you still need to change the settings, refer to Async Profiler on GitHub for more information.
Java Flight Recorder
Java Flight Recorder (JFR) is a monitoring tool that collects information about the events (pieces of data) in a particualar instance of time in a Java Virtual Machine during the execution of an application.
Enable JFR for Oracle JDK 8 or later
Java Flight Recorder works on Oracle JDK builds starting from version 8 providing that you have enabled commercial features and on any JDK build starting from version 11.
To enable commercial featrues:
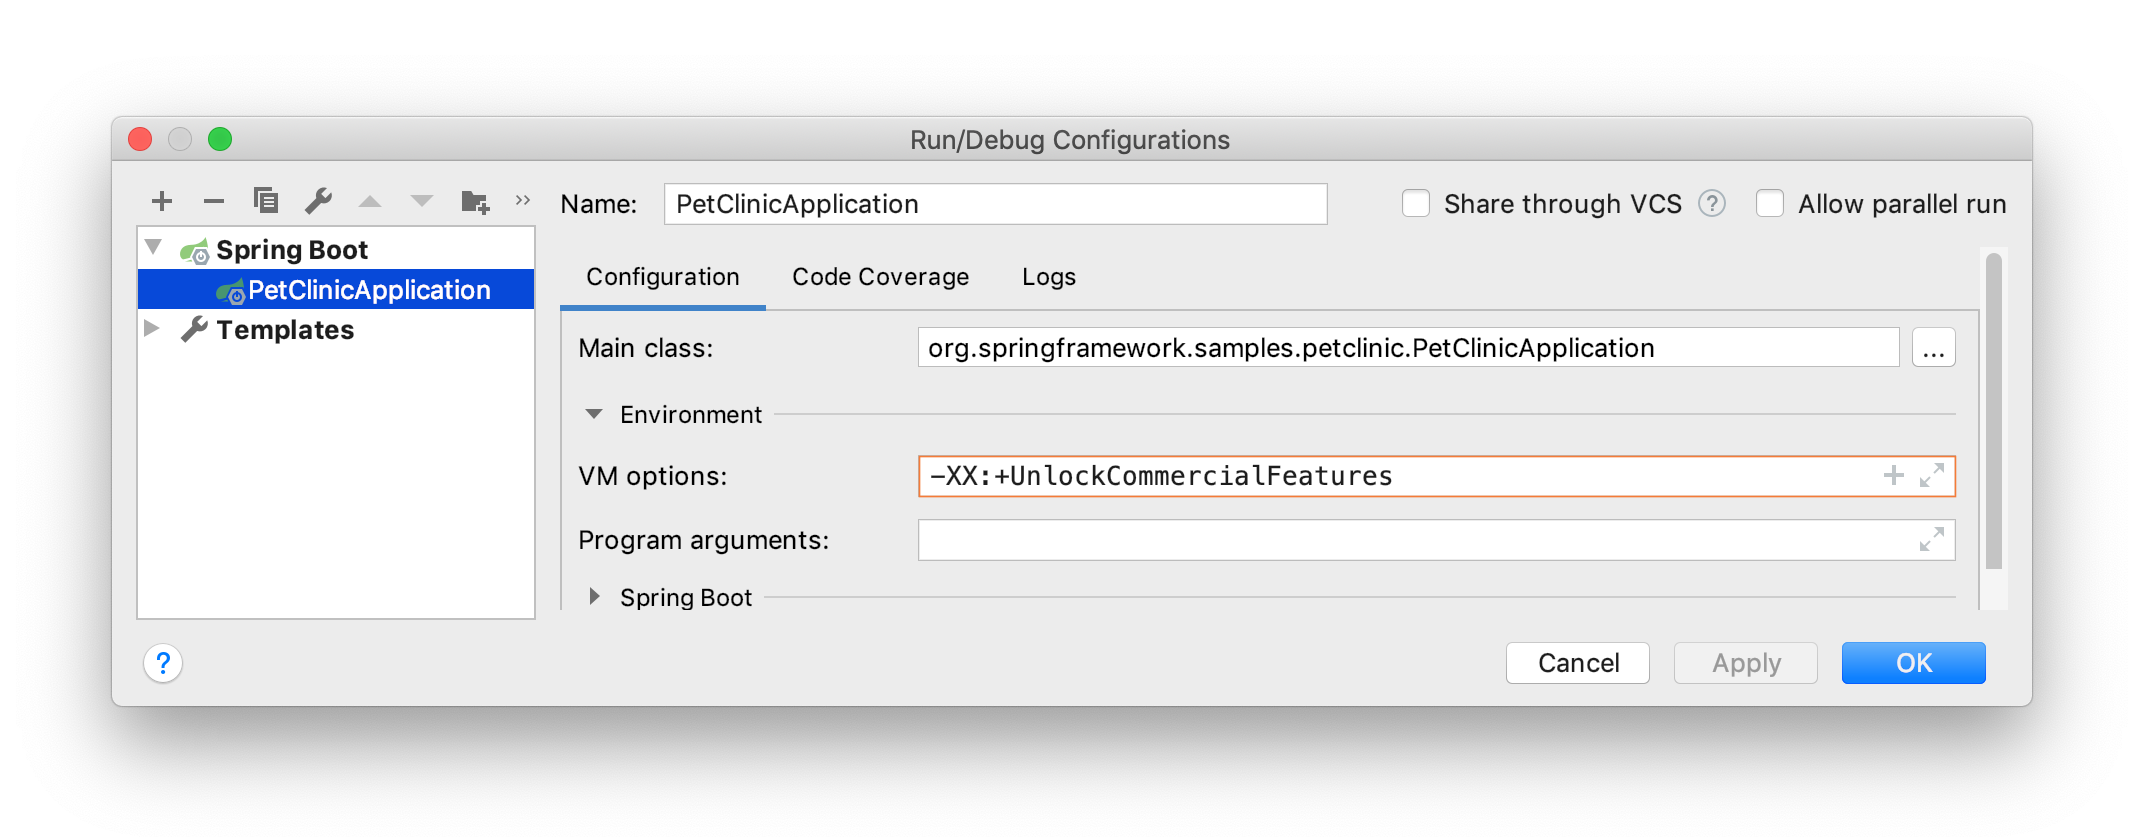
From the main menu, select and from the list on the left, select the run configuration that you want to analyze with JFR.
On the Configuration tab, expand the Environment section.
To the VM options filed, add the following line:
-XX:+UnlockCommercialFeatures.Apply the changes and close the dialog.
Create a new JFR configuration
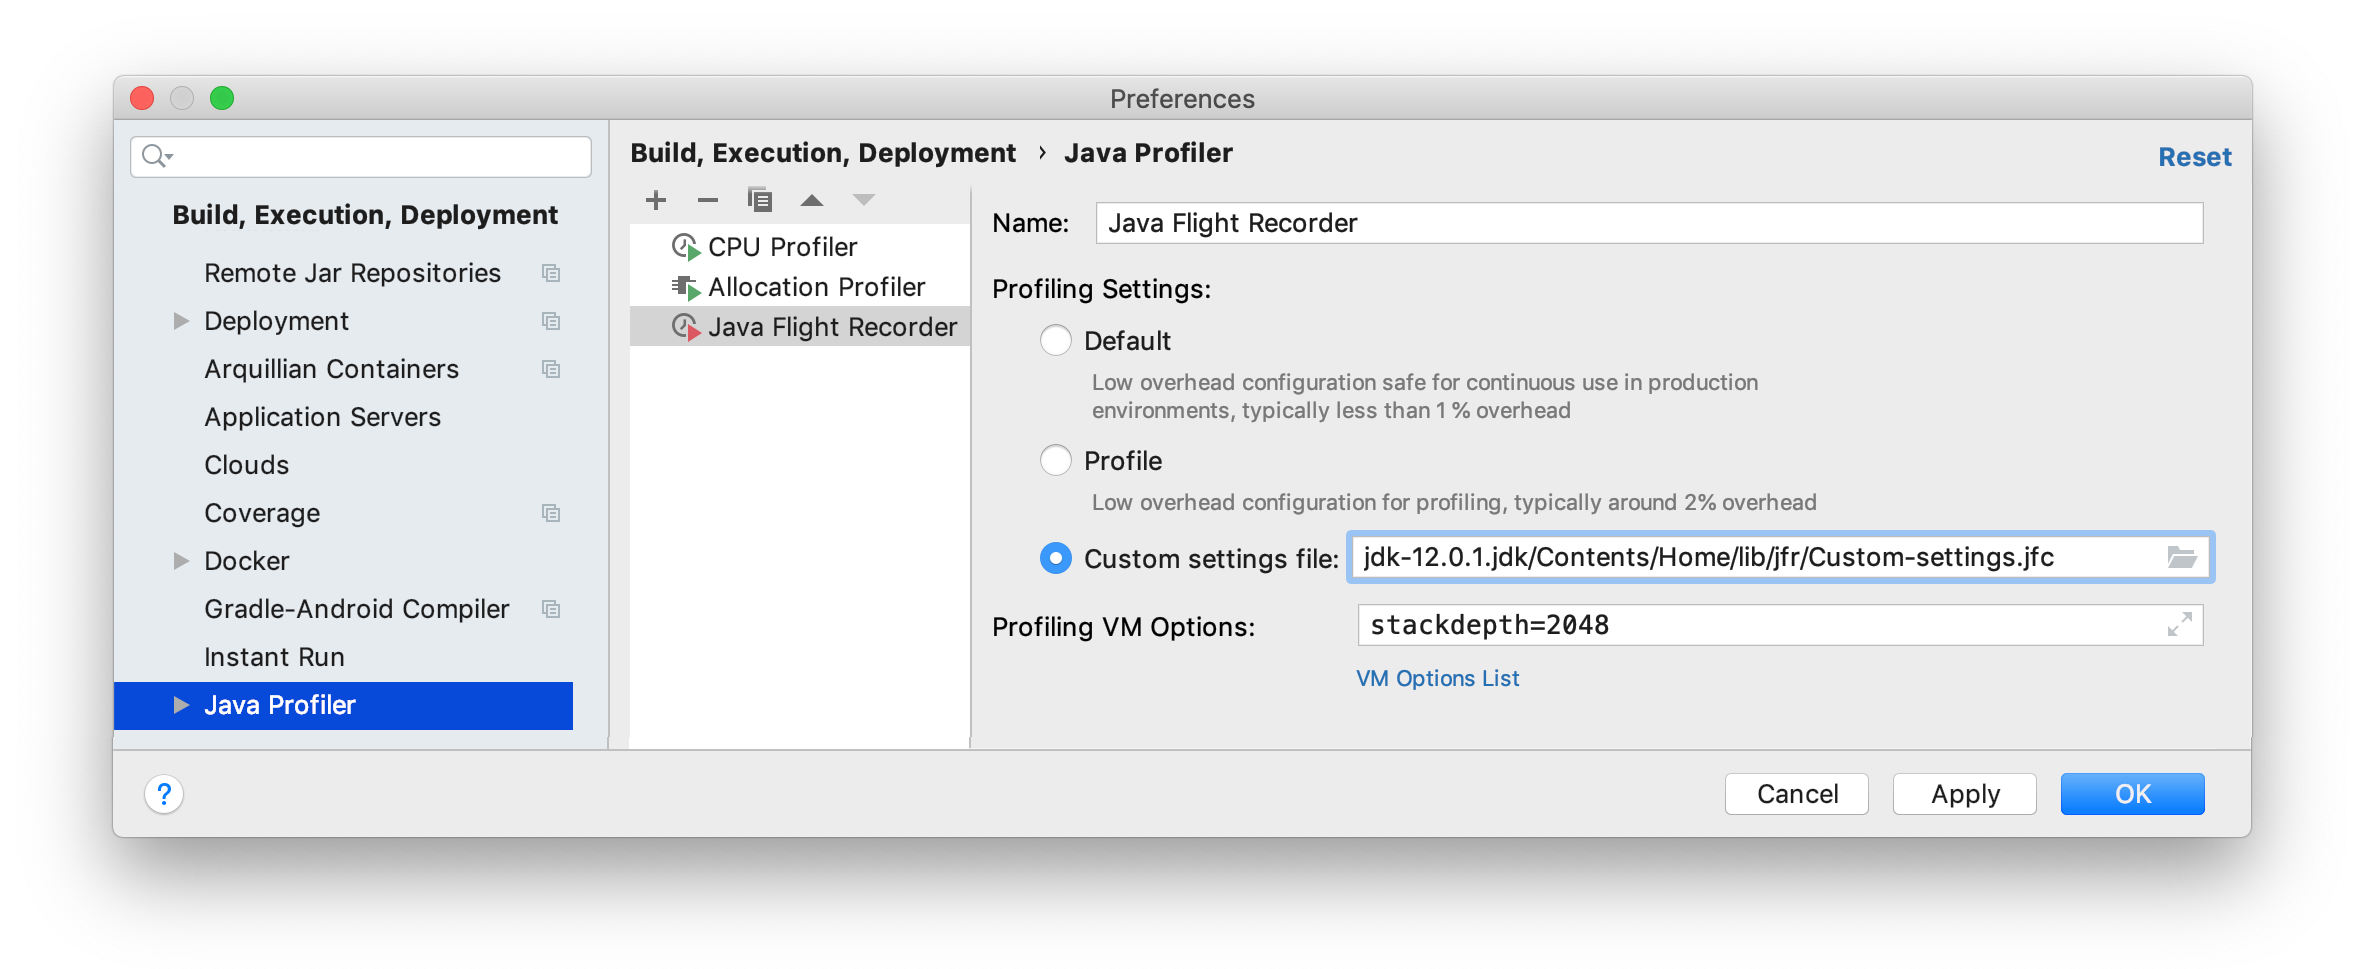
There are two pre-installed configurations: Default and Profile. The Default configuration has low overhead (about 1%), that's why it works well for continuous profiling. The Profile configuration has overhead about 2% and can be used for more detailed application profiling.
These configurations cover the majority of all use cases. However, you can create and upload your own settings by means of Java Mission Control.
Run Java Mission Control that you can find in JDK_HOME/bin/jmc or download from builds.shipilev.net.
From the Java Mission Control main menu, select
-
Click Import Files on the panel on the right and select one of the pre-installed configurations in the .jfc format:
For Java 10 and earlier: JDK_HOME/jre/lib/jfr/
For Java 11 and later: JDK_HOME/Contents/Home/lib/jfr/
Select , change the necessary settings, and click OK.
In the Flight Recording Template Manager dialog, click Export File.
Specify another name for the new settings file and change its location if necessary. Click Save.
For more information on how to configure custom settings, refer to Controlling Recording Data by Using Templates.
Load the custom configuration to the IDE
Select the Java Flight Recorder profiling configuration to which you want to load your custom settings or create a new configuration by clicking
 .
.In the Profiling Settings area, select the Custom settings file option and click
 .
.Specify the path to the custom settings file and click Open.
Apply the changes and close the Settings/Preferences dialog.
Start profiling
Select a profiling configuration
Run the analysis
In order to run Async Profiler or Java Flight Recorder, follow these steps:
From the main menu, select Run or click
 on the toolbar.
 Select Run 'run configuration name' with 'profiler configuration name'.
When the profiling data is ready, you will see a confirmation popup, and the Profiler tool button will appear. Click this button to open the Profiler tool window (or go to if you don't use tool buttons).

Interpret the results
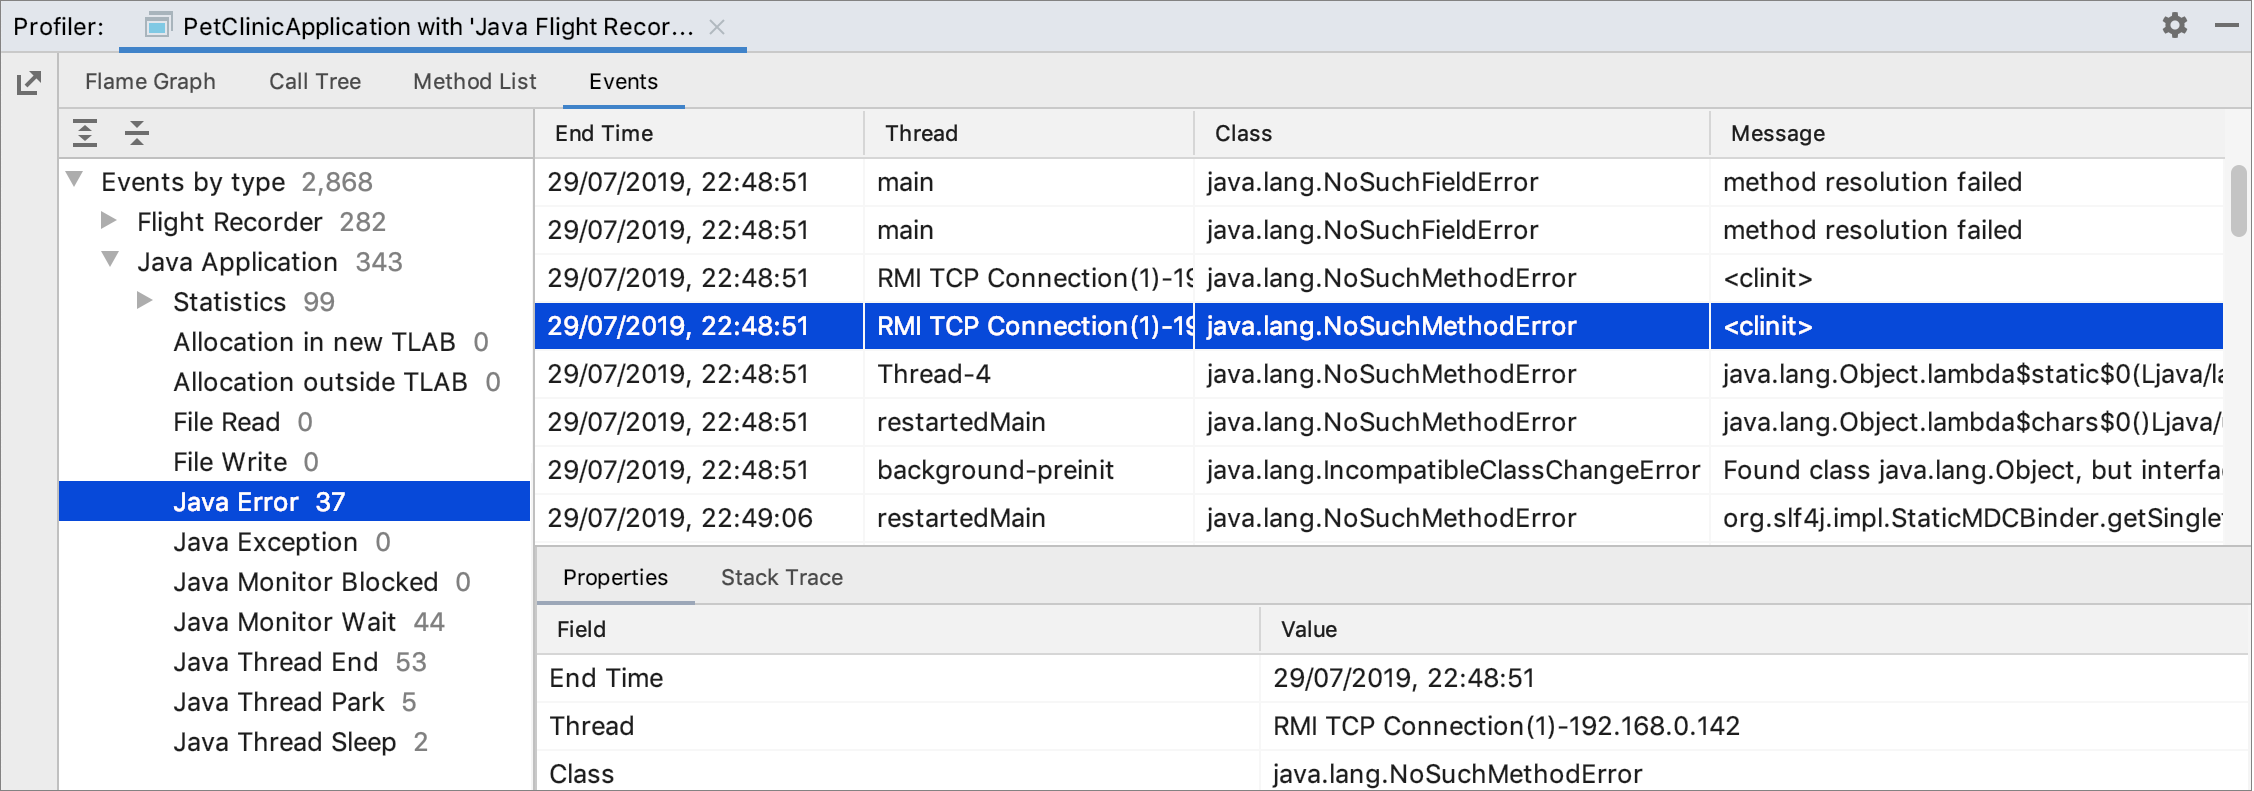
In the Profiler tool window, the collected data is presented on three tabs: Flame Graph, Call Tree Method List, and Events. The left-hand part lists application threads; by clicking on each thread you can go in more details.

Export profiling results
On the left frame of the Profiler tool window (), click
 .
.In the dialog that opens, name the file, specify the folder in which you want to save it, and click Save.
Import profiling results
You can import profiling data to the IDE to analyze it using the profiling tools. Make sure that the files that you import were created by Async Profiler or have the .jfr format.
From the main menu, select .
Select the file that you want to import and click Open.
Flame Graph
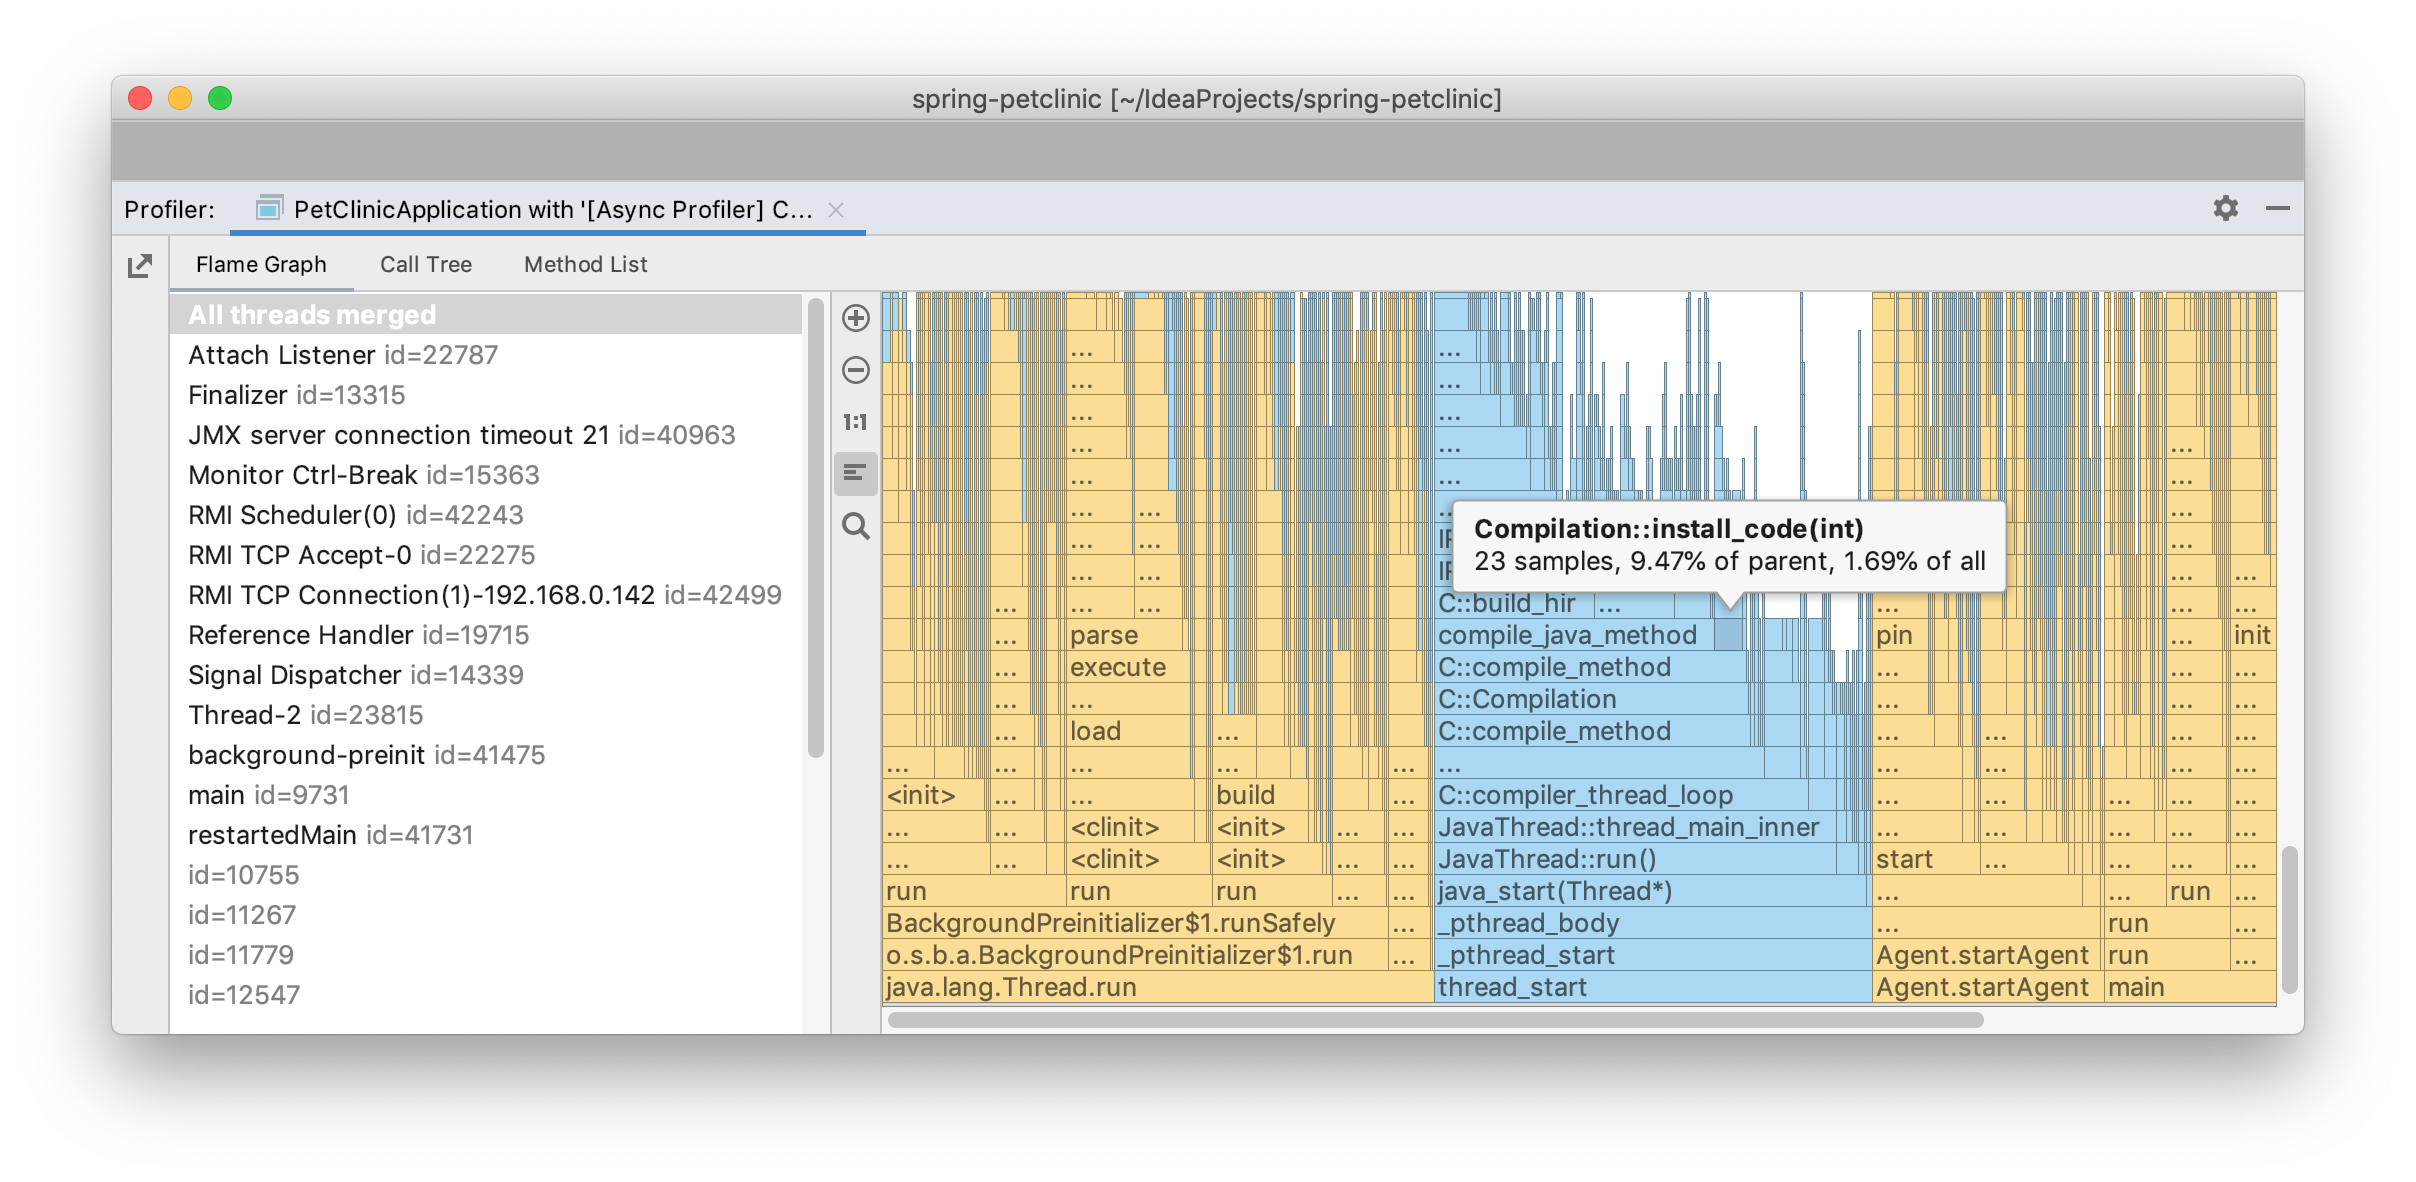
This tab shows you the state of the call stack at any moment of time in the performance profile. This is a visual representation of the Call Tree: the rectangles stand for frames of the call stack, ordered by width.
Each block represents a function in the stack (a stack frame). The width of each block corresponds to the method’s CPU time used (or the allocation size, in case of allocation profiling). On the Y-axis, there is a stack depth going from bottom up. The X-axis shows the stack profile sorted from the most resource-consuming functions to the least consuming ones.
When you read the flame graph, focus on the widest blocks. These blocks are the functions that are presented in the profile most. You can start from the bottom and move up, following the code flow from parent to child methods, or use the opposite direction to explore the top blocks that show the functions running directly on the CPU.
Hover the mouse over any block to view the details:

Call Tree
The Call Tree tab represents information about a program’s call stacks that were sampled during profiling:
The method name
Percentage of total sample time (can be toggled to the parent call view)
The total sample count
The number of filtered calls
The optional number right after the percentage presents a filtered sequence of calls. Click it to expand this sequence. The filtering rules can be configured in the settings.
To configure and filter the Call Tree view, use the Presentation Settings button (![]() ).
). 
Filter Call Tree results
The Call Tree tab allows you to collapse the frames you are not interested in at the moment. For example, you can hide the data that comes from specific frameworks.
-
Configure the filters. In the Settings/Preferences dialog (Ctrl+Alt+S), select .
Configure the packages or specific classes that you want to be able to hide in the output.
Apply the changes and close the dialog.
-
To hide the frames in the report, click blue hyperlinked numbers located before frame names.
To quickly disable filtering, click
 and then click Filter Calls
Method List
The Methods List collects all methods in the profiled data and sorts them by cumulative sample time. Every item in this list has a Back Trace tree and a Merge Callees tree.
The Back Trace shows the hierarchy of callers. Use this view to trace which methods call the selected method. Merge Callees tries to summarize all methods that are called by the selected one.

Java Flight Recorder Events
Java Flight Recorder collects data about events. Events occur in the JVM or the Java application at a specific point in time. Each has a name, a time stamp, and an optional payload.
