Run and debug a Spring Boot application using Docker Compose
You can use IntelliJ IDEA to run and debug a Spring Boot application running in multiple Docker containers under Docker Compose. This tutorial describes how to run two Docker Compose services inside containers: a simple Spring Boot application and a MySQL database. The application can receive GET requests that add entries to the database. This tutorial also describes how you can set breakpoints and debug your application using a remote debug configuration.
Clone the sample project
The source code of the application is hosted on GitHub.
In the main menu, select
-
Specify the URL: https://github.com/IdeaUJetBrains/SpringBootDockerDemoDebug
Test the connection if necessary and click Clone.
Agree to open the cloned project.
Run the application using Docker Compose
Open the docker-compose-debug.yml file.
-
Click
 in the gutter.
This creates a Docker Compose run configuration, which starts the application in a container as the app service and the database in another container as the db service. If successful, you should see something similar to the following in the deploy log:
Creating db ... Creating springbootdockerdemodebug2_app_1 ... 'Compose: docker-compose-debug.yml' has been deployed successfully.You can access the application at http://localhost:18080. For example, you can try to execute the following GET request, which should add a new
entitybusentry to the database and list all available entries: http://127.0.0.1:18080/entitybus/postYou can connect to the database at jdbc:mysql://0.0.0.0:13306/DOCKERDB. For example, you can use the Database tool window to add the database as a data source and check the
entitybustable. Use the following connection settings:Host: 0.0.0.0 or localhost
Port:
13306User:
rootPassword:
rootDatabase:
DOCKERDB
Create a remote debug configuration
Open the docker-compose-debug.yml file.
Click
 in the gutter.
Select the module in the Use module classpath list.
Double-click the Docker Compose run configuration in the Before launch list. If it is not in the list, click
 and select Launch Docker before debug.
 -
Select the Docker Compose run configuration to launch before starting remote debug and make sure that it is configured to connect to the app service. Also check the Custom Command field: it should contain the
-agentliboption and options from thecommandfield in the docker-compose-debug.yml file:java -agentlib:jdwp=transport=dt_socket,server=y,suspend=y,address=5005 -Djava.security.egd=file:/dev/./urandom -jar /project/target/demo-0.0.1-SNAPSHOT.jar
If the application is already running, do not run the debug configuration. Apply the settings and click Cancel.
Launch the debug configuration
If the application is already running, remove the containers. To do it, right-click the containers under the Docker Compose app and db services and click Delete.
Open the docker-compose-debug.yml file.
Click
 in the gutter and start the debug configuration.
Once the application is up and running, the Debug tool window opens.
Set a breakpoint and debug the application
-
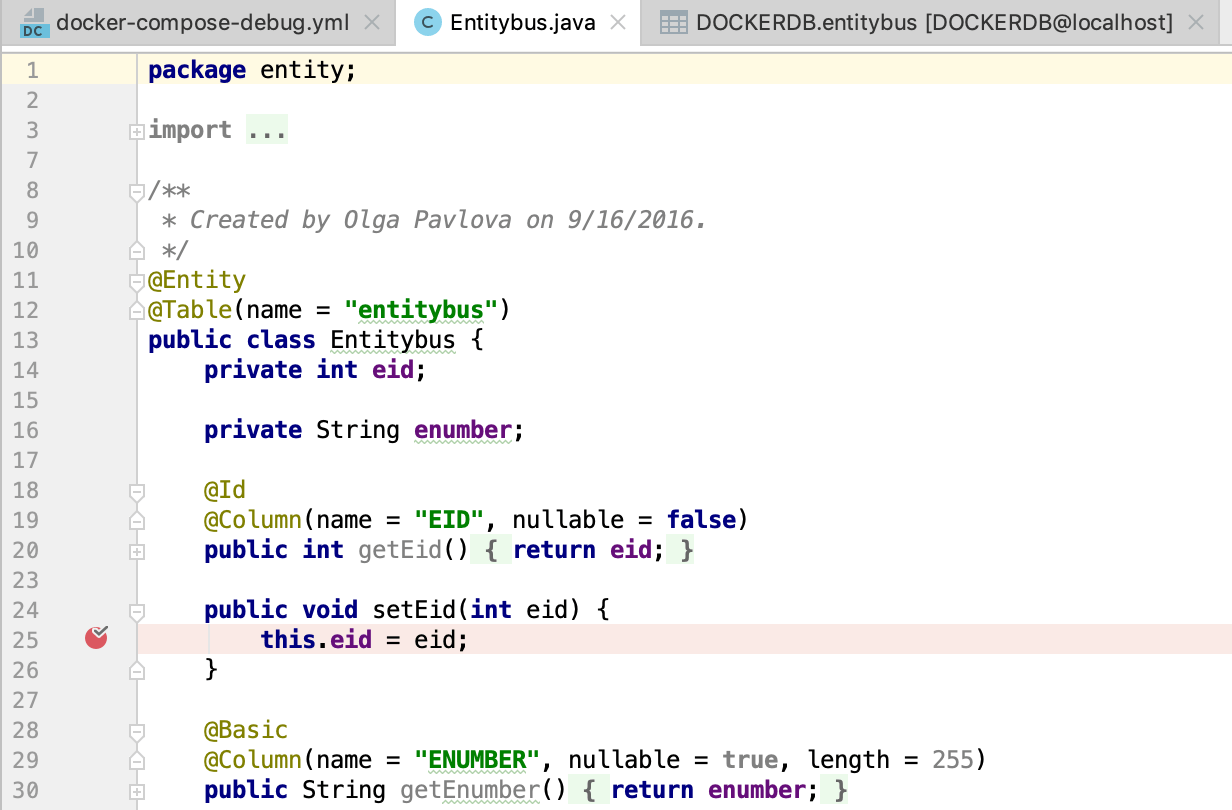
Open the src/main/java/entity/Entitybus.java file and set a breakpoint in the
setEid()method.
-
Execute the following GET request: http://127.0.0.1:18080/entitybus/post
The application will stop at the breakpoint and you can examine the current variable values and frames in the Debug tool window.
Click
 until it executes the request and you get the returned values.