Configure coverage measurement
Configure code coverage behavior
-
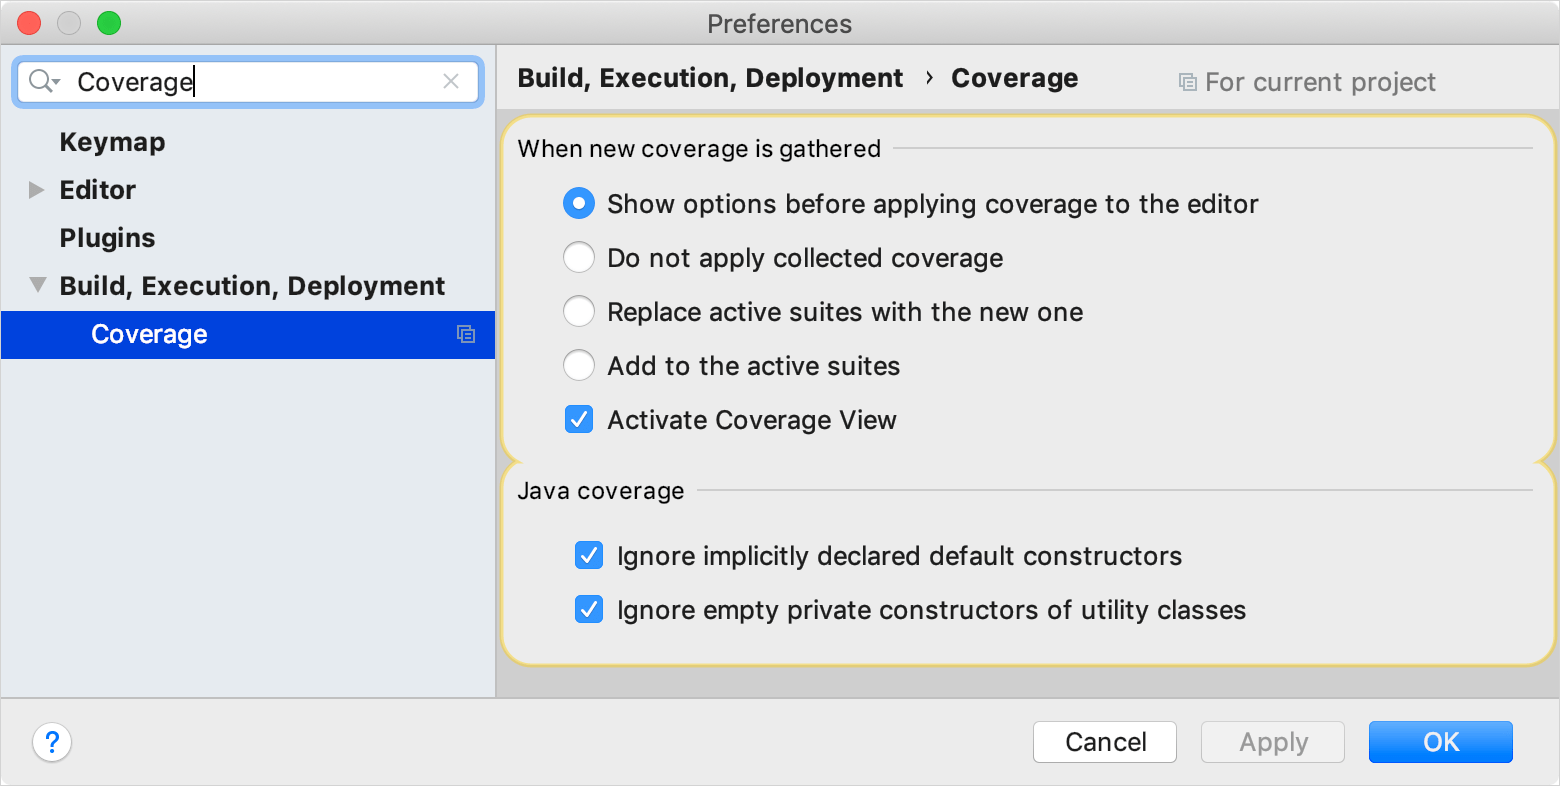
Define how the collected coverage data will be processed:
Show options before applying coverage to the editor: show the Code Coverage dialog every time you run a new run configuration with code coverage.
Do not apply collected coverage: discard the new code coverage results.
Replace active suites with the new one: discard the active suites and use the new one every time you launch a new run configuration with code coverage.
Add to the active suites: add new code coverage suites to the active suites every time you launch a new run configuration with code coverage.
Ignore implicit constructors: exclude implicitly declared default constructors from coverage statistics. Default constructors that are declared explicitly will remain included.
Ignore empty private constructors of utility classes: exclude from coverage statistics empty private constructors in classes where all other methods are static.
Select the Activate Coverage View checkbox to open the Coverage tool window automatically.

Configure code coverage options
From the main menu, select , add the necessary run/debug configuration, and switch to the Code Coverage tab.
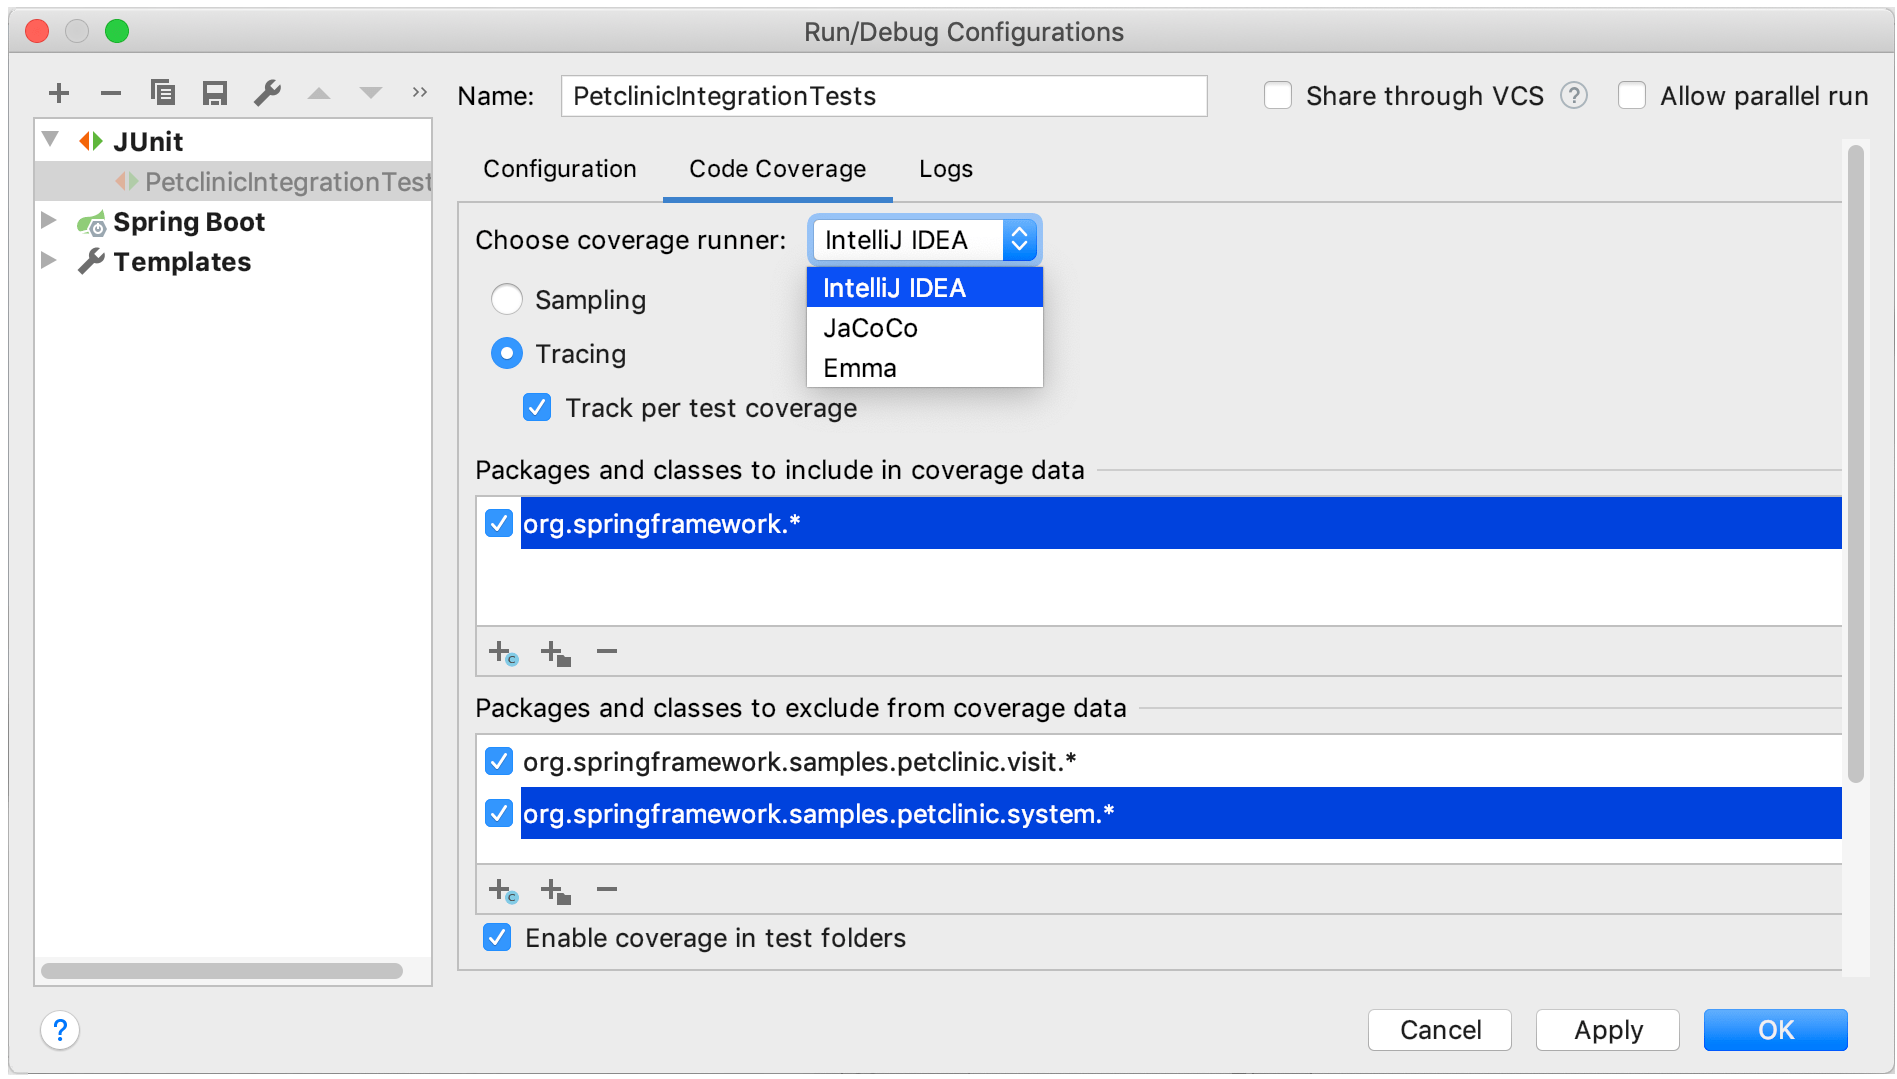
On the Code Coverage tab, select a code coverage from the Choose coverage runner list runner: EMMA, JaCoCo, or IntelliJ IDEA.
-
(For the IntelliJ IDEA runner) select the mode that you want to use: Sampling or Tracing.
Sampling mode enables collecting line coverage with negligible slow-down.
Tracing mode enables the accurate collection of the branch coverage, with the ability to track tests, view coverage statistics, and get additional information on each covered line.
Track per test coverage option allows tracking individual code coverage produced by each test case. Enable this option if you want to know exactly what code has been covered by specific tests. You will also be able to see which tests are the most relevant for each piece of the code.
-
The Packages and classes to include in coverage data and Packages and classes to exclude from coverage data areas allow you to narrow down the code coverage scope.
For example, you can include or exclude specific classes and packages from coverage measurement.
Click
 (Add Class) or
  (Add Package) and select the necessary items.
 To collect code coverage statistics for tests, select the Enable Coverage in Test Folders checkbox.

Change colors of the coverage highlighting
-
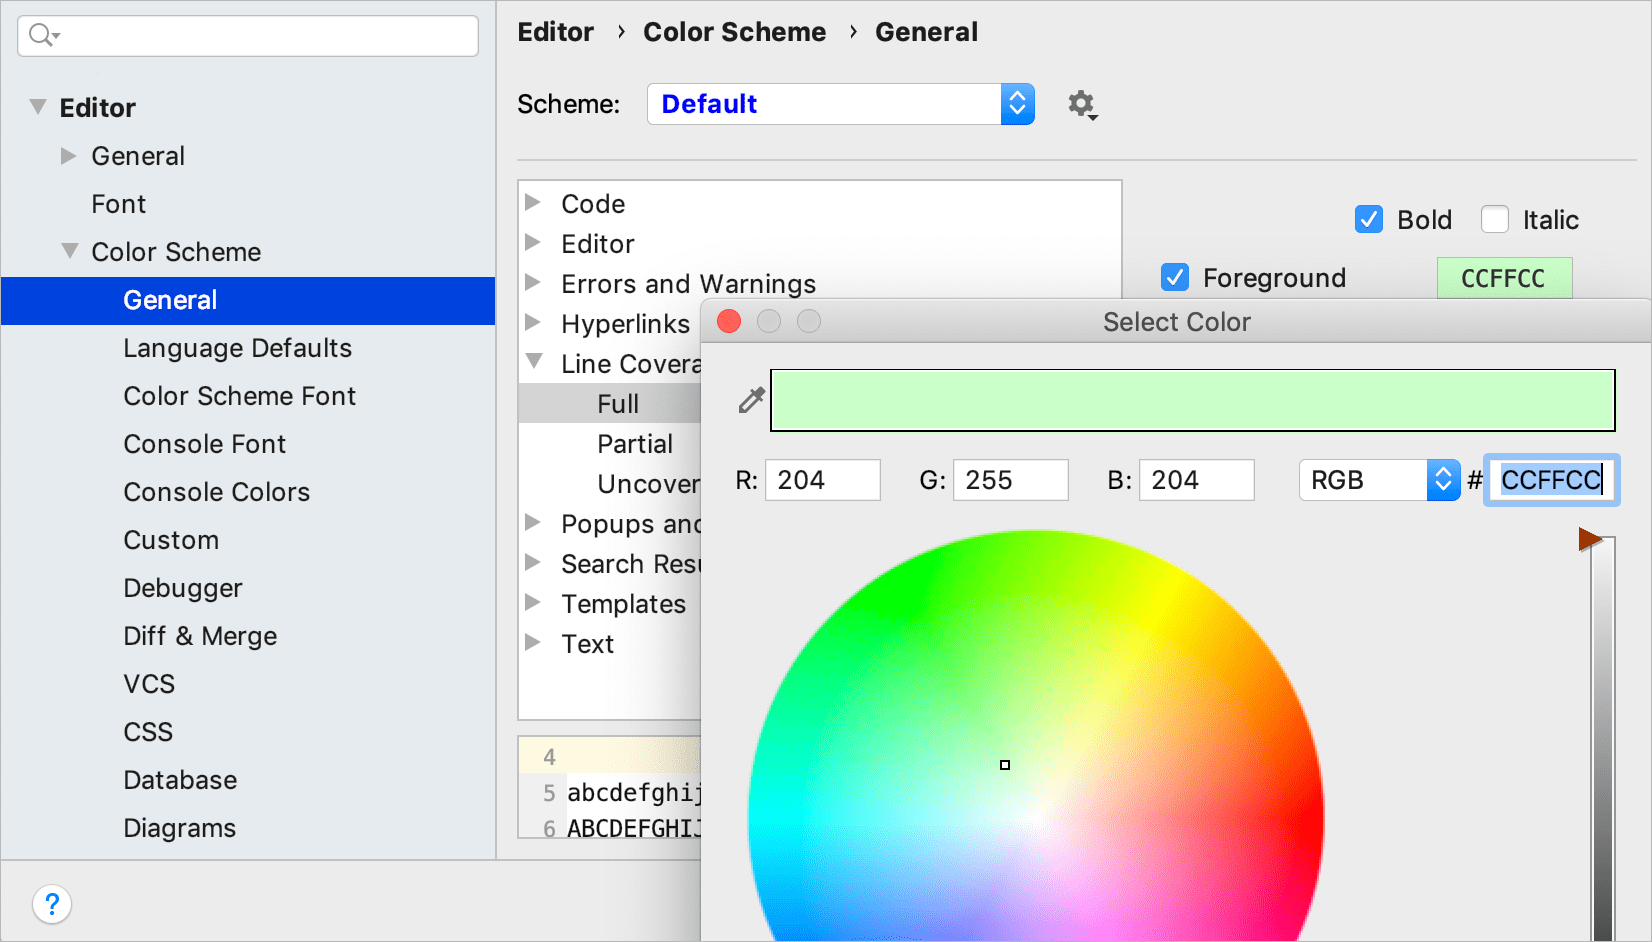
In the Settings/Preferences dialog Ctrl+Alt+S, navigate to .
In the list of components, expand the Line Coverage node and select a type of coverage: for example, Full, Partial or Uncovered.
Click the Foreground field to open the Select Color dialog.
Select a color and click Apply.
