Run notebooks and analyze data
To preview and analyze data sets, you need to run the executable paragraphs of your notebook.
Running notebooks
You can run paragraphs one by one or all at once. When executing any paragraph, mind code dependencies. If, for example, the current paragraph relies on the variables that are initialized in the previous paragraph, they need to be executed first.
Click
 on the notebook editor toolbar to execute all paragraphs of the notebook. The progress of the execution will be shown on the toolbar.
-
Click
 icon in the gutter to execute a particular paragraph of the notebook.
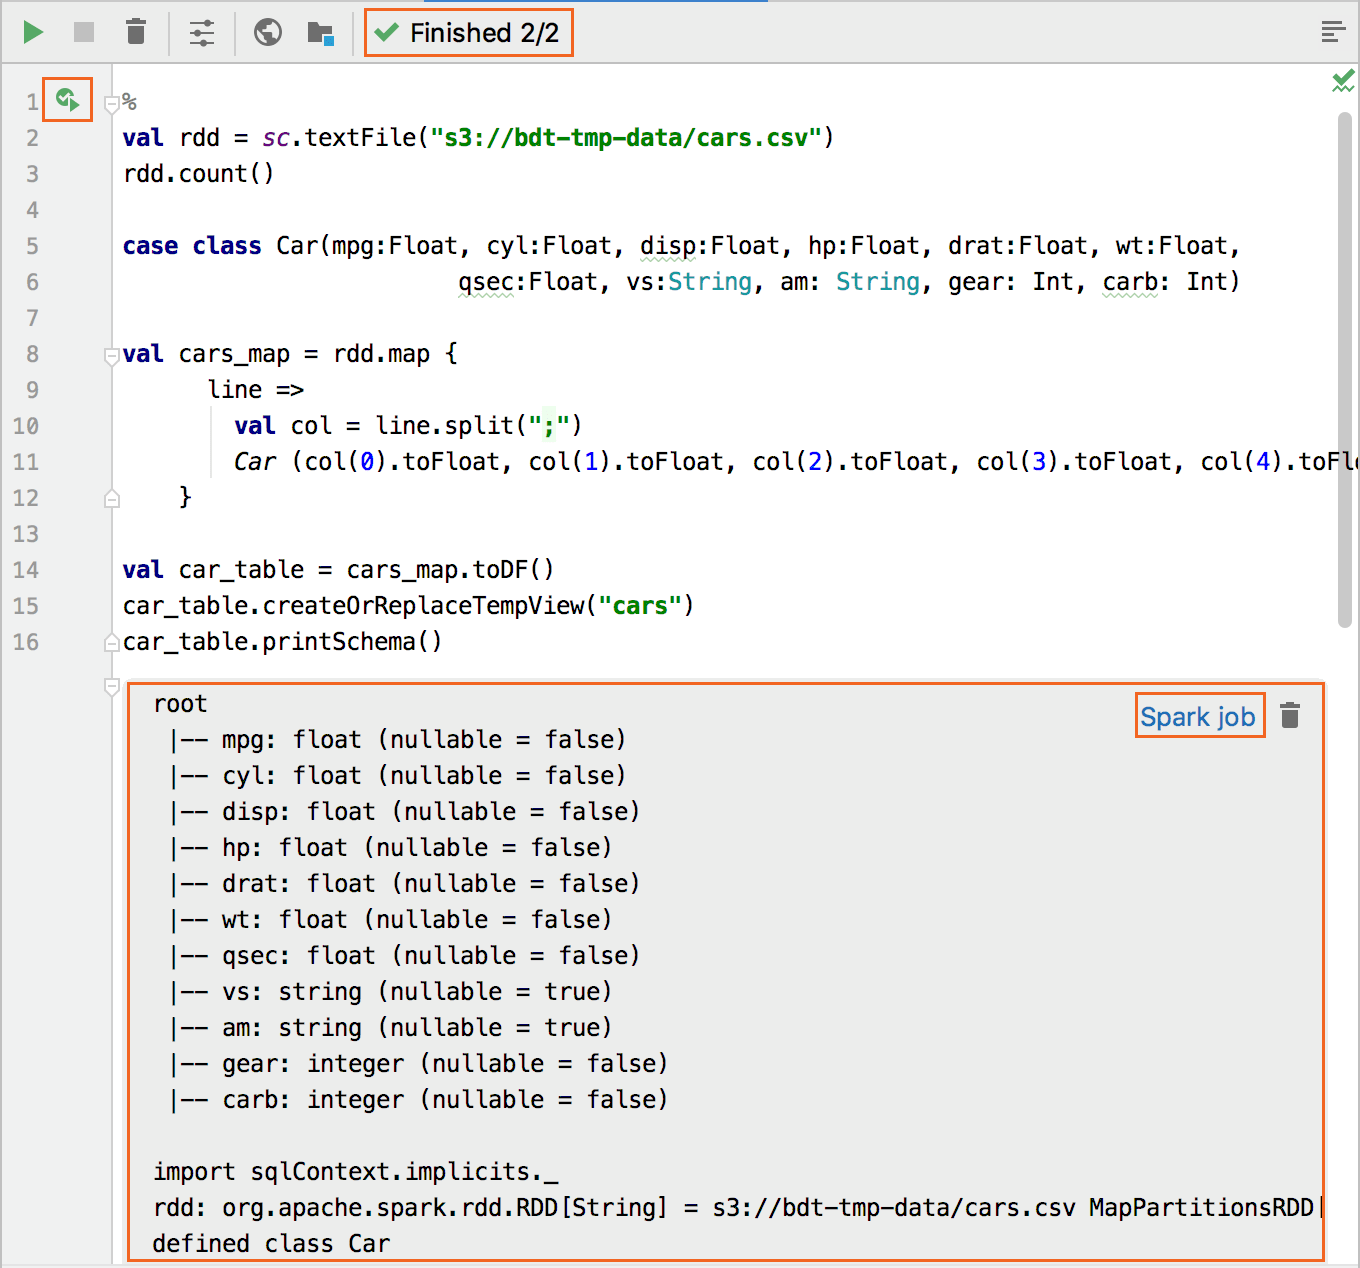
Once the execution completes, the execution status is shown in the toolbar and in the gutter:
 : execution has been successfully finished
  : execution has failed
  : execution has been aborted
In case of the successful execution, preview the output that is shown below the paragraph code:

The Spark job link appears in the preview area when the paragraph contains any RDD operation that starts a Spark job, for example, count or saveAsTextFile methods. Click this link to open the Spark Monitoring tool window and and preview the completion status, event timeline, and DAG visualization.
When you execute SQL statements or run the show method of a Zeppelin or Spark object, the results are shown in the Table and Chart tabs of the preview area.
Viewing tables
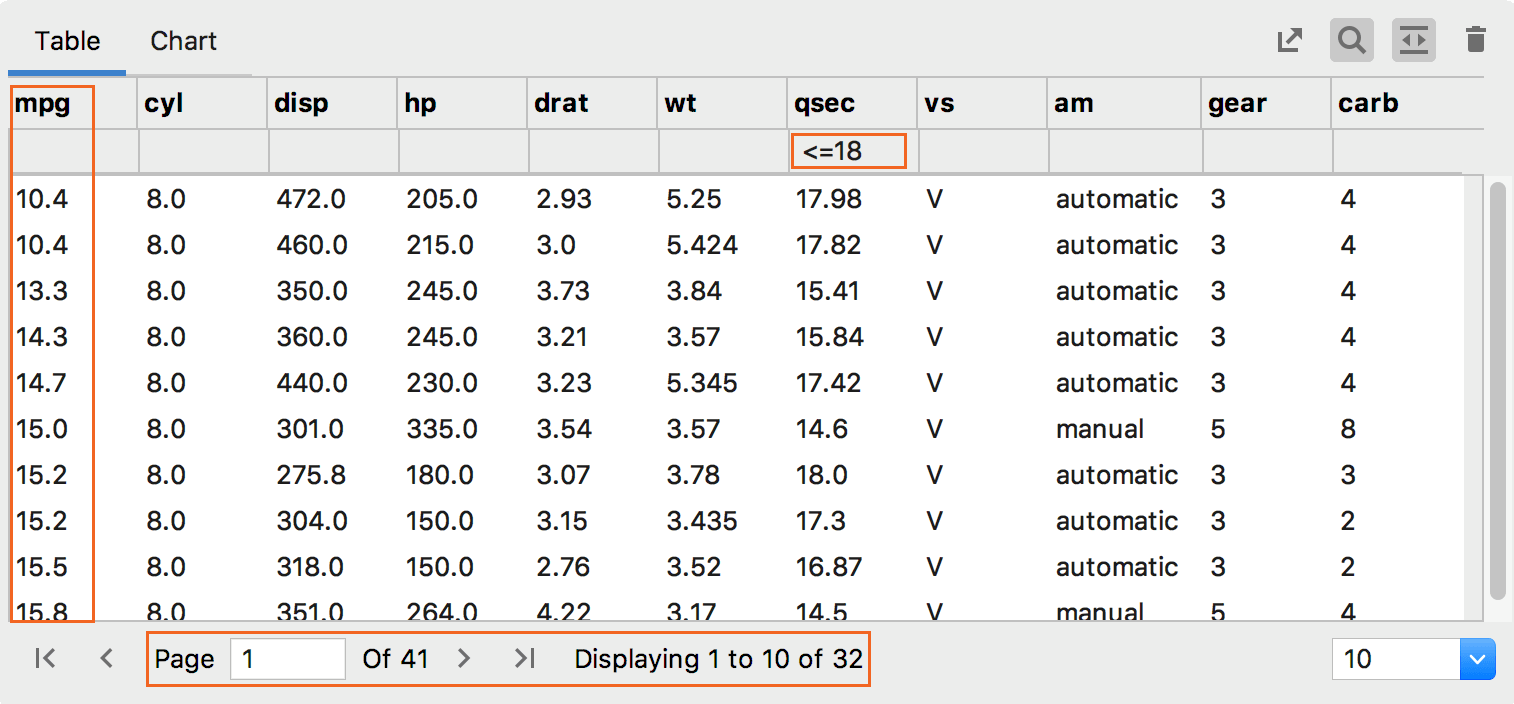
By default, the Table tab shows all the processed data.

Organize data in the table
Click a column header to order values in it.
Click
 to filter data in the selected column.
Click
 to organize table in pages. Toggle this button and specify the number of table rows to display on a page: 10, 15, 30, or 100.
Export tables
Click
 to save the table in a .csv file.
Enter the filename and click Save.
Viewing charts
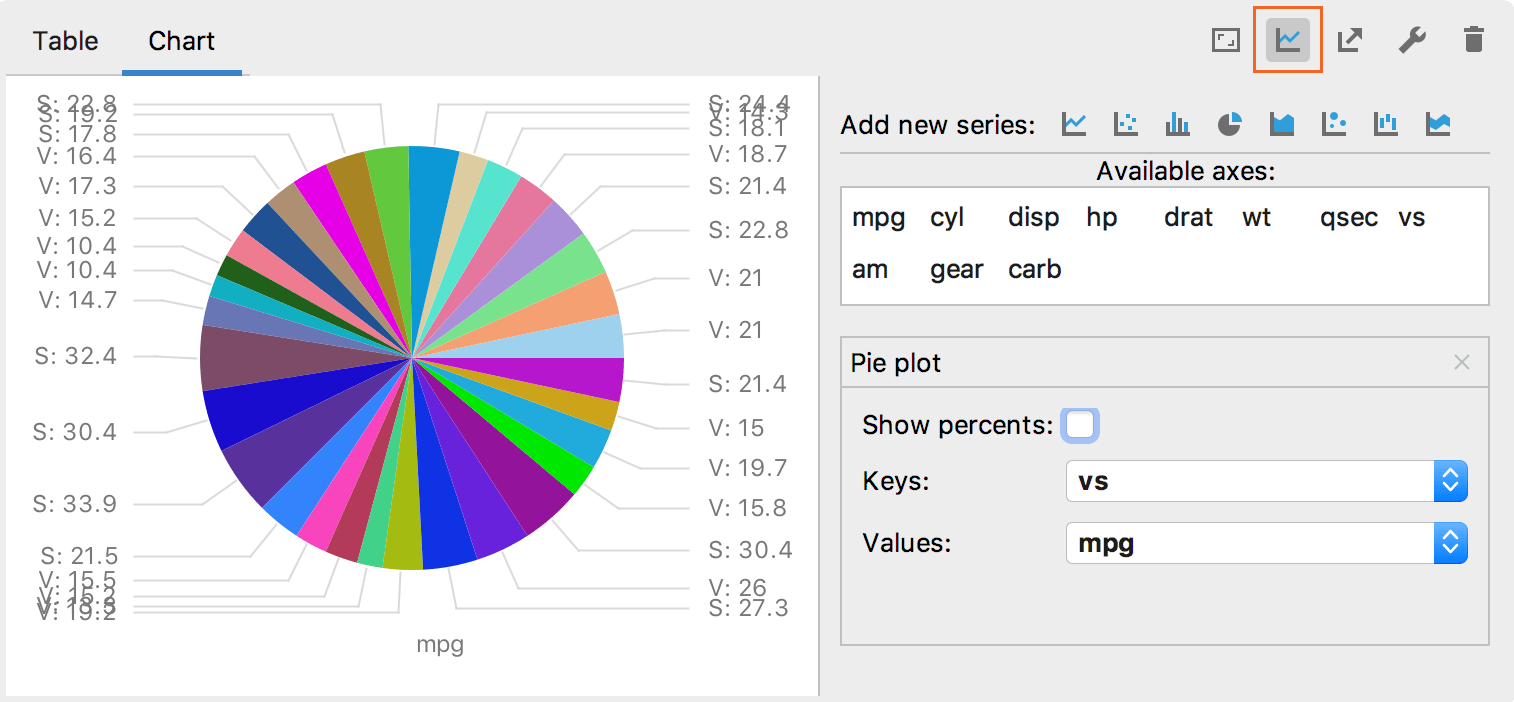
The default type of the chart is defined by the chart settings on the server. However, you can configure and modify the predefined settings.
Configure charts
Click
 to alter the initial settings of the chart.
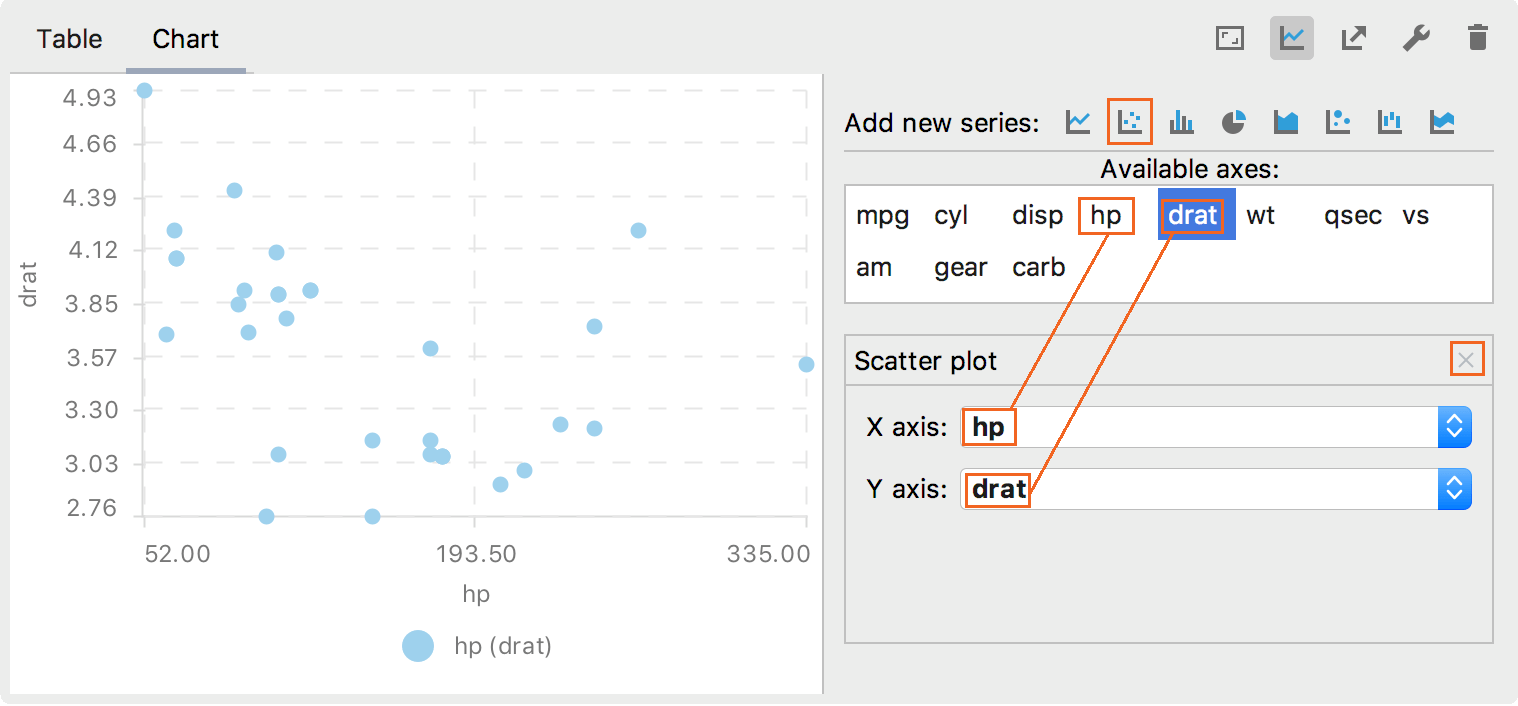
Click any icon that corresponds to a chart type and the new chart will be plotted. For example, click
 to add a new scatter chart.
 Scroll down the chart settings to configure the newly added chart. Drag the variables you want to plot to the specific field:

To remove any chart from the plotting area, click
 on the chart settings.
Export charts
Click
 to save the generated graphical output in the .png format.
 Enter the filename and click Save.
Troubleshooting
If, for some reasons, the execution of the notebook or a particular paragraph has failed, review the error message and consider some typical troubleshooting actions:
Problem | Recommended action |
|---|---|
The notebook toolbar is not available. The following warning message is shown: | Click the Try Reconnect link to get the notebook connected to the server. |
Server connection is lost. The corresponding icon shows the disconnected status of the server: | Click |
Interpreter session gets expired. For example, the error message reports that the Spark session is expired. | Click |

