Start the debugger session
Starting a debugger session is very similar to running the program in normal mode. The debugger is attached behind the scenes, so you don't have to configure anything specific to start a debugger session. If you are able to run your program from IntelliJ IDEA, you will also be able to debug it using the same configuration.
Each time you debug a program, the debugger session is based on a run/debug configuration. It allows you to configure parameters and actions for launching the application. For example, you can specify to build the application every time you start a debugger session or use the previously compiled code. You can also use any VM options, custom classpath values, and so on (as long as the selected run/debug configuration supports this).
To run the program from an entry point, such as the main() method or a test, click Run
icon in the gutter near it and select Debug.
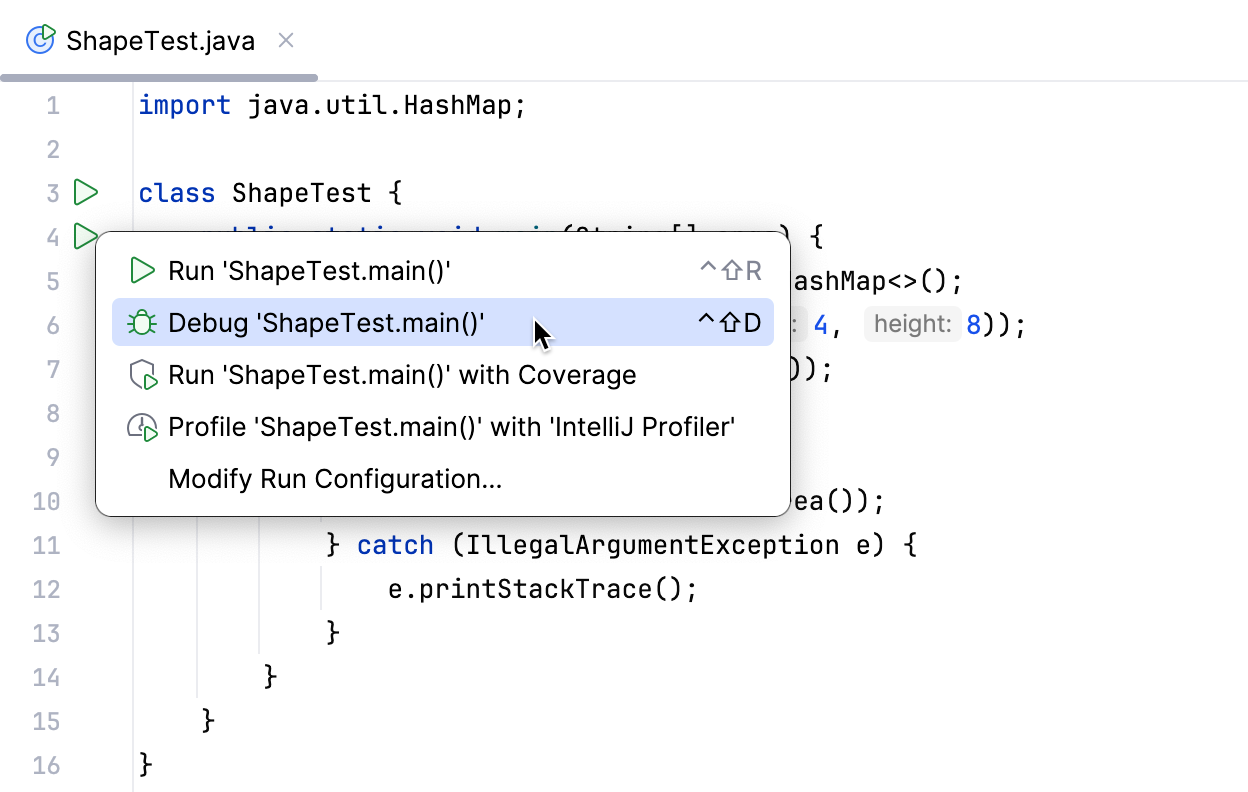
This will create a temporary run/debug configuration for you. After that, you can customize and save this temporary configuration if needed. This is the quickest way to debug your program without configuring the startup parameters.
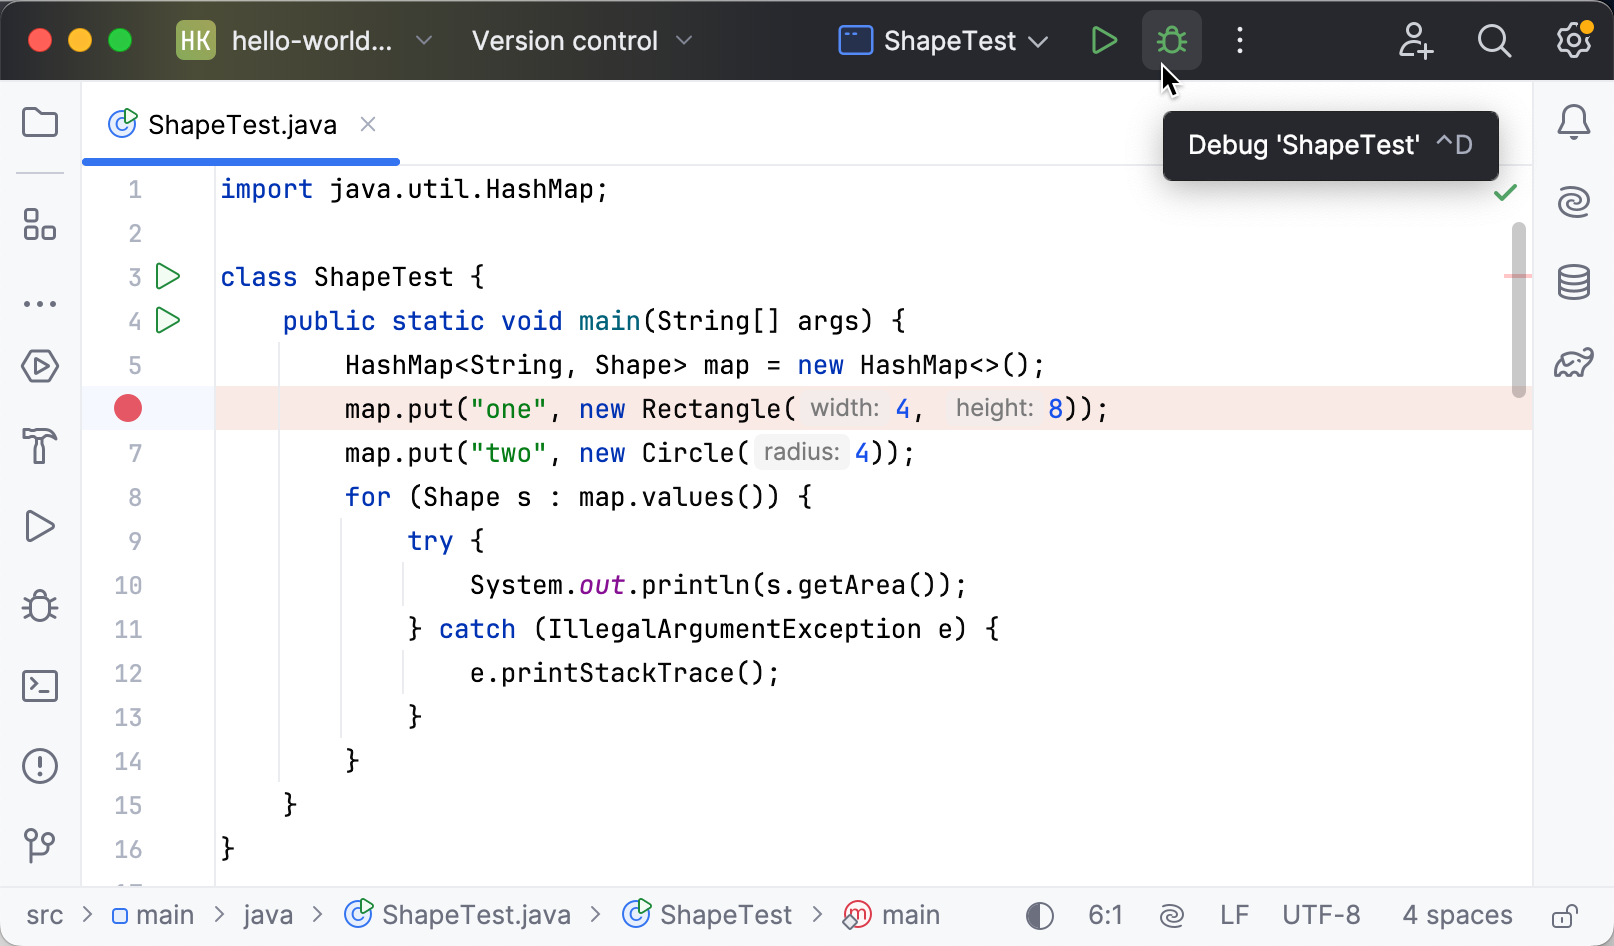
If you already have a run/debug configuration, select it in the run widget, then click Debug or press Shift+F9.
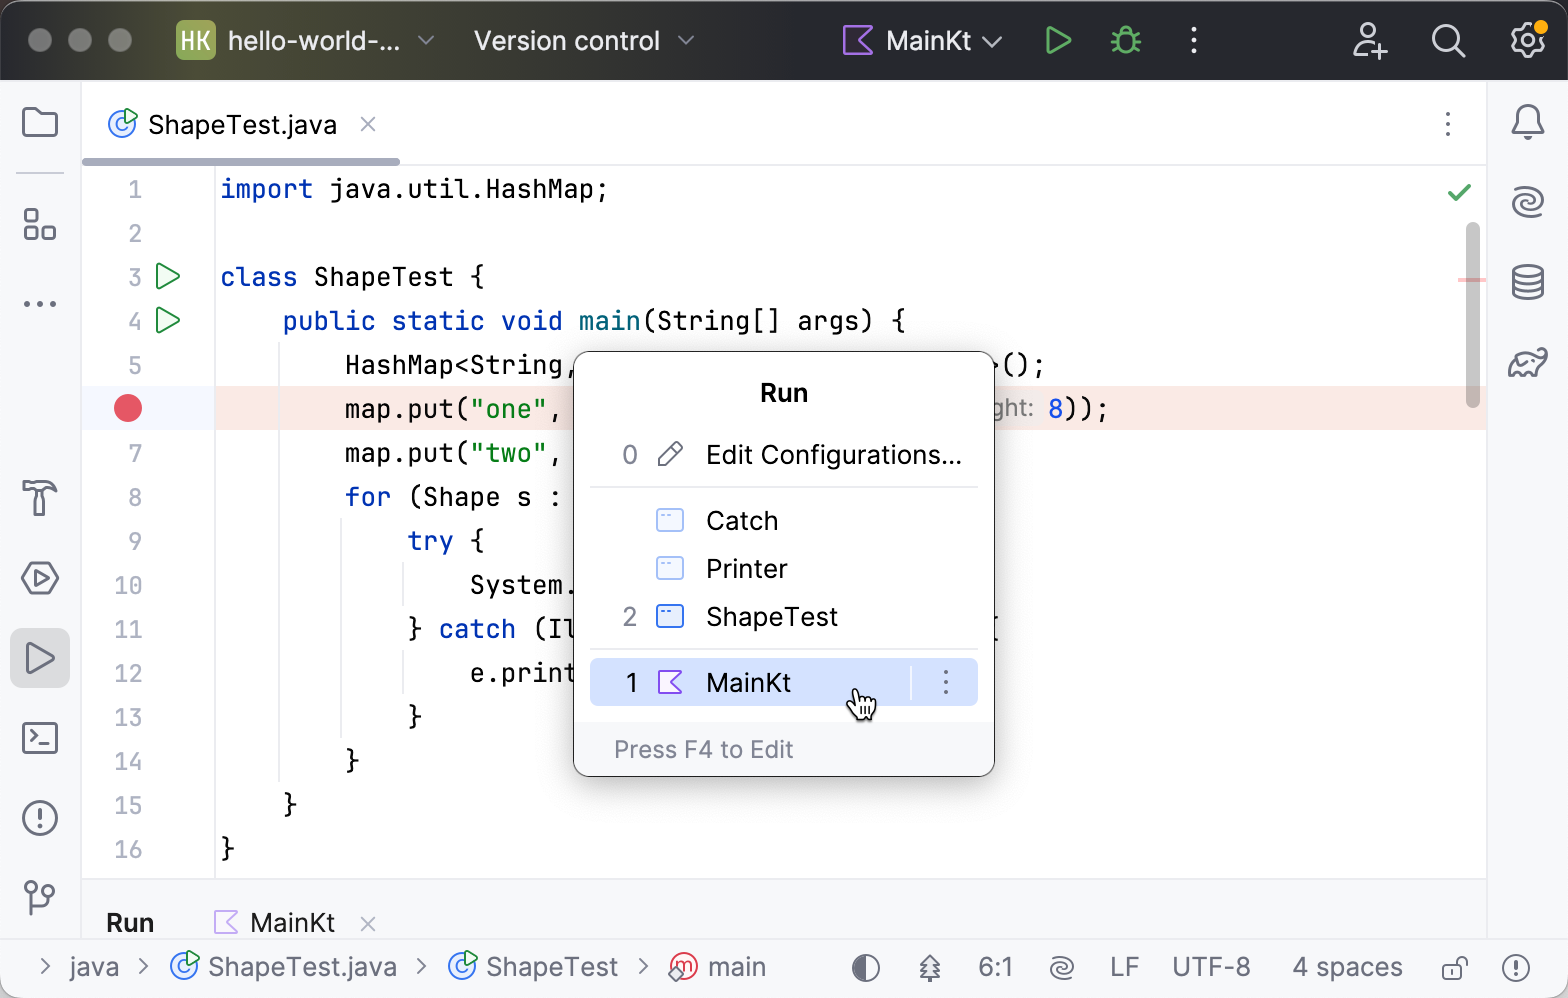
To launch a debug session for an existing run/debug configuration from the editor, press Alt+Shift+F9 and select it from the menu.
If you are debugging code that is based on a framework or runs on an application server, it is recommended to use the run/debug configuration type intended for this type of application. When you launch a debug session, IntelliJ IDEA adds a VM option that allows the debugger to attach. Given that a particular framework may fork the process, there is no guarantee that the target process will get the required VM option if an improper run/debug configuration type is used.
Pause/Resume a debugger session
When the debugger session is running, you can pause/resume it using the buttons on the toolbar of the Debug tool window:
To pause a debugger session, click
.
To resume a debugger session, click
F9.
Restart a debugger session
Click the Rerun button in the Debug tool window or press Ctrl+F5.

Locate the process ID (PID) of the debug session
To view the PID of the application you are currently debugging, hover over the corresponding session tab in the Debug tool window.
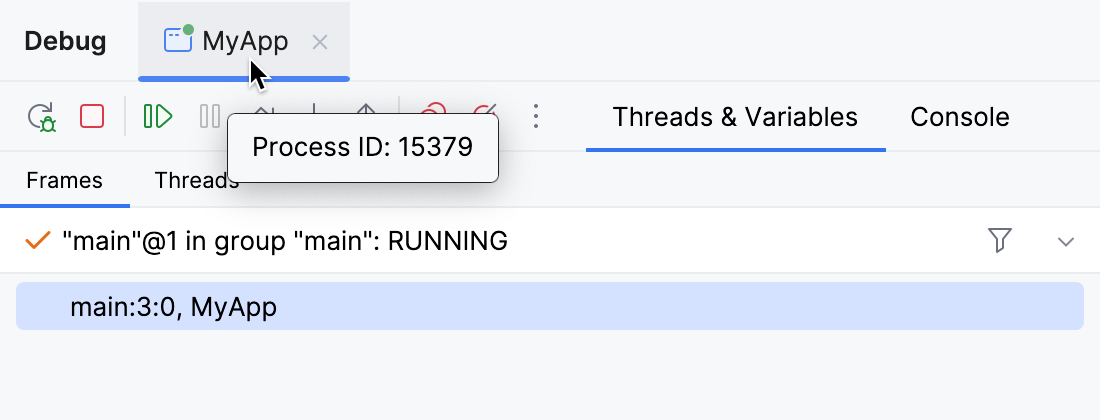
A tooltip appears that displays the PID of the debug session.
Terminate a debugger session
Click
in the Debug tool window.
Alternatively, press Ctrl+F2 and select the process to terminate (if there are two or more of them).

Debug multiple tasks
To run or debug multiple tasks simultaneously, open the run widget menu in the toolbar and select the corresponding run/debug configurations while holding down the Ctrl key.
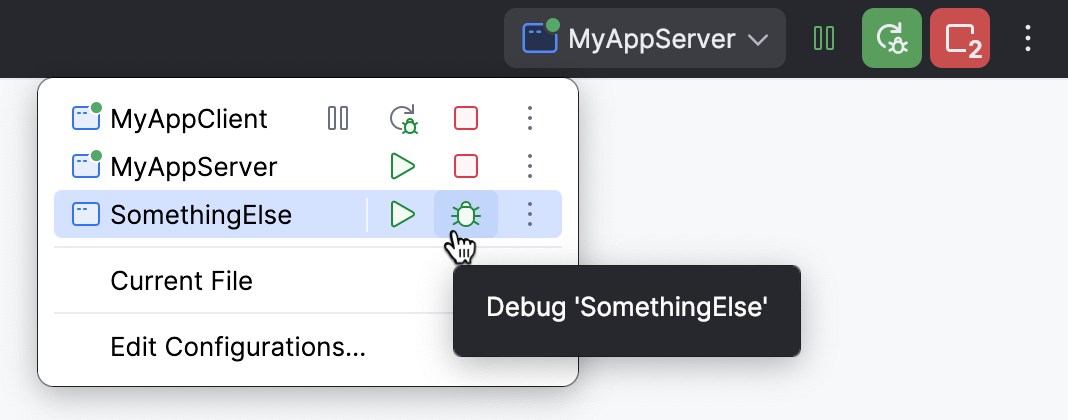
For launching multiple tasks using a single run/debug configuration, refer to Run compound tasks.
Productivity tips
- Debug non-responding applications
In case your application hangs, it may help to pause the session and let the debugger get the information about the application's current state. You can then use this information to locate the cause of the problem.
- Run before-launch tasks
You can configure external tools or custom actions to run before a debugging session. Examples of before-launch actions are running a Gulp, Grunt, or NPM script, compiling your TypeScript code into JavaScript, or running all the currently active File Watchers to compile or compress your code, uploading your sources to a remote server, and many more, depending on the language and frameworks you are using.