Analyze memory snapshots
Memory snapshots are useful for identifying performance problems. In IntelliJ IDEA, you can analyze memory snapshots in the Profiler tool window.
Open a snapshot
Press Ctrl+Shift+A or select from the main menu.
In the dialog that opens, type
hprofto find the Open Hprof Snapshot action.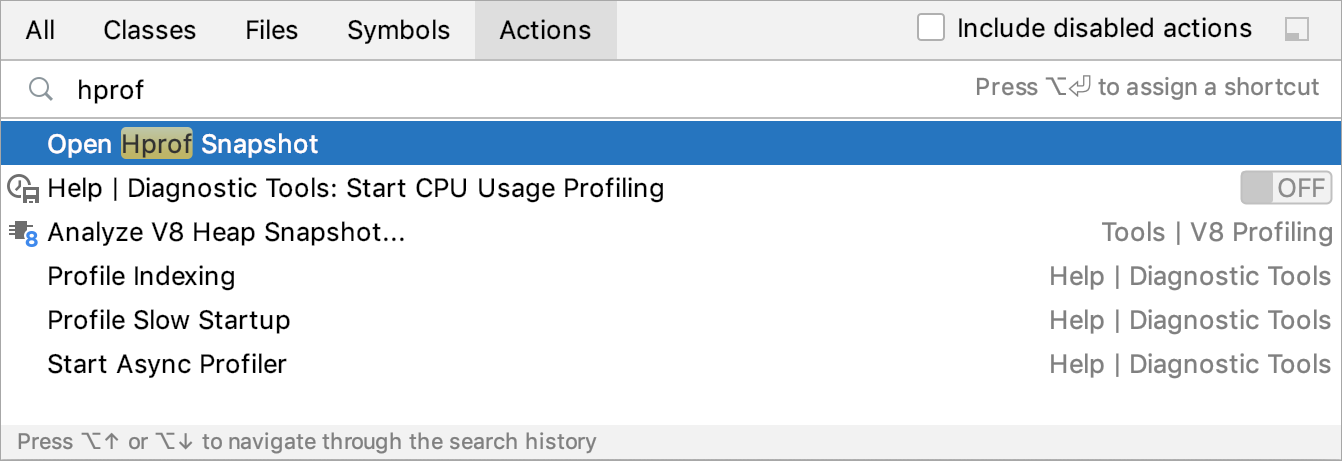
-
In the dialog that opens, select the necessary memory dump file with the .hprof extension and click Open.
IntelliJ IDEA opens the Profiler tool window with a memory snapshot breakdown.
Read the memory snapshot file
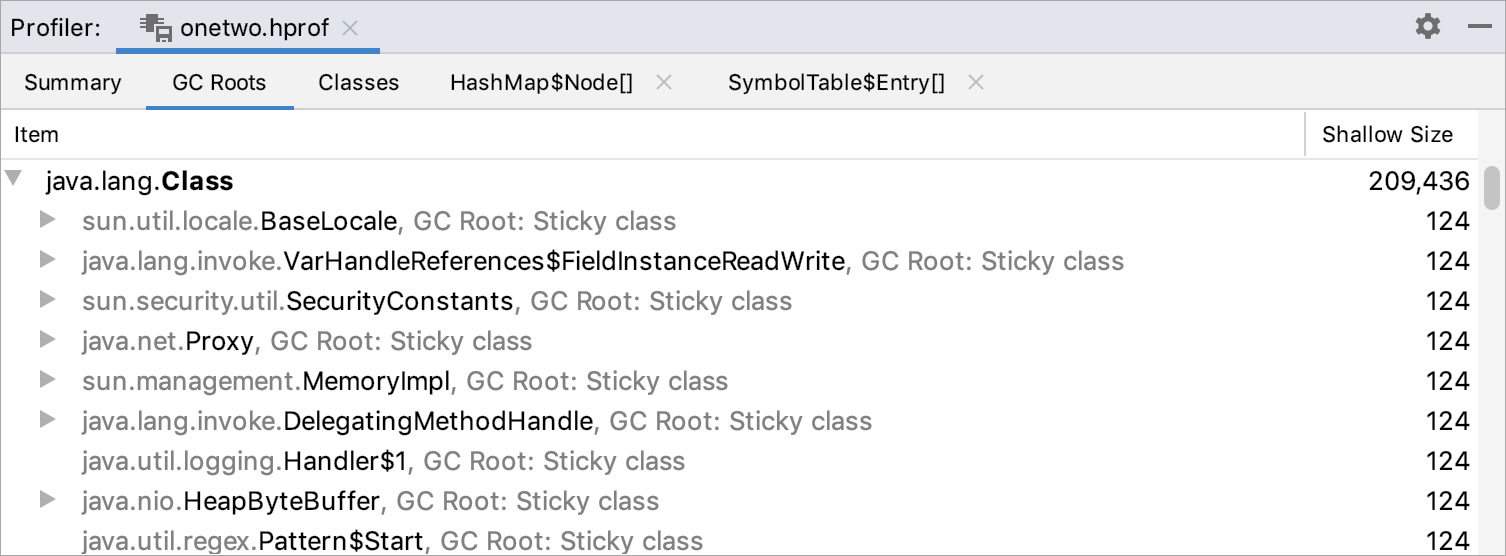
The Profiler tool window has several tabs:
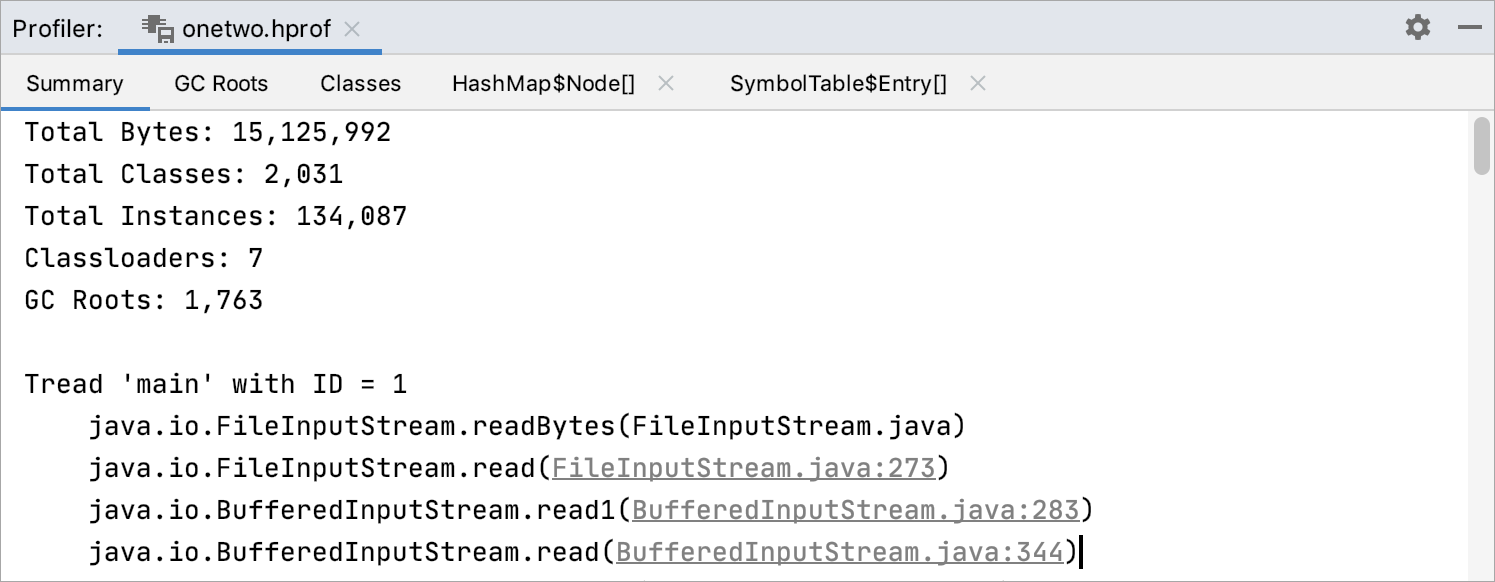
The Summary tab shows general information, for example, the total size, number of instances and stack traces of the file.
The GC Roots tab shows all the root objects grouped by classes.
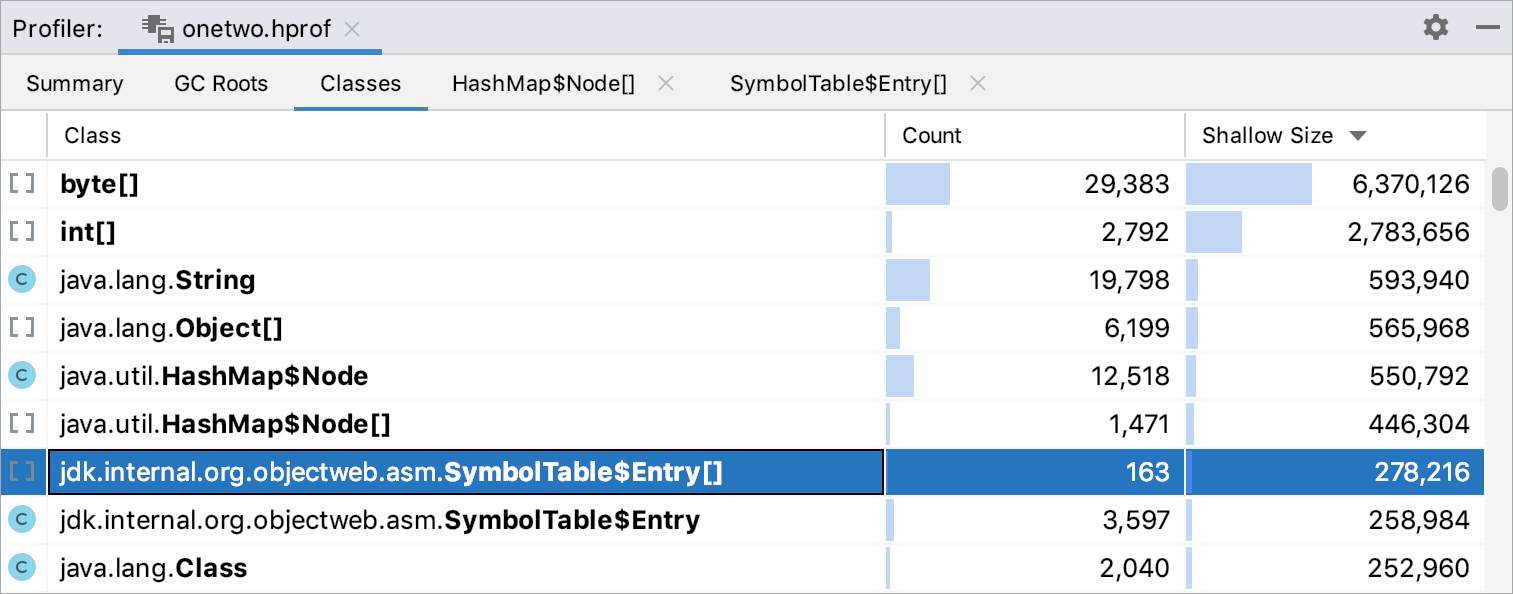
The Classes tab shows all classes sorted by their numbers of instances or size.

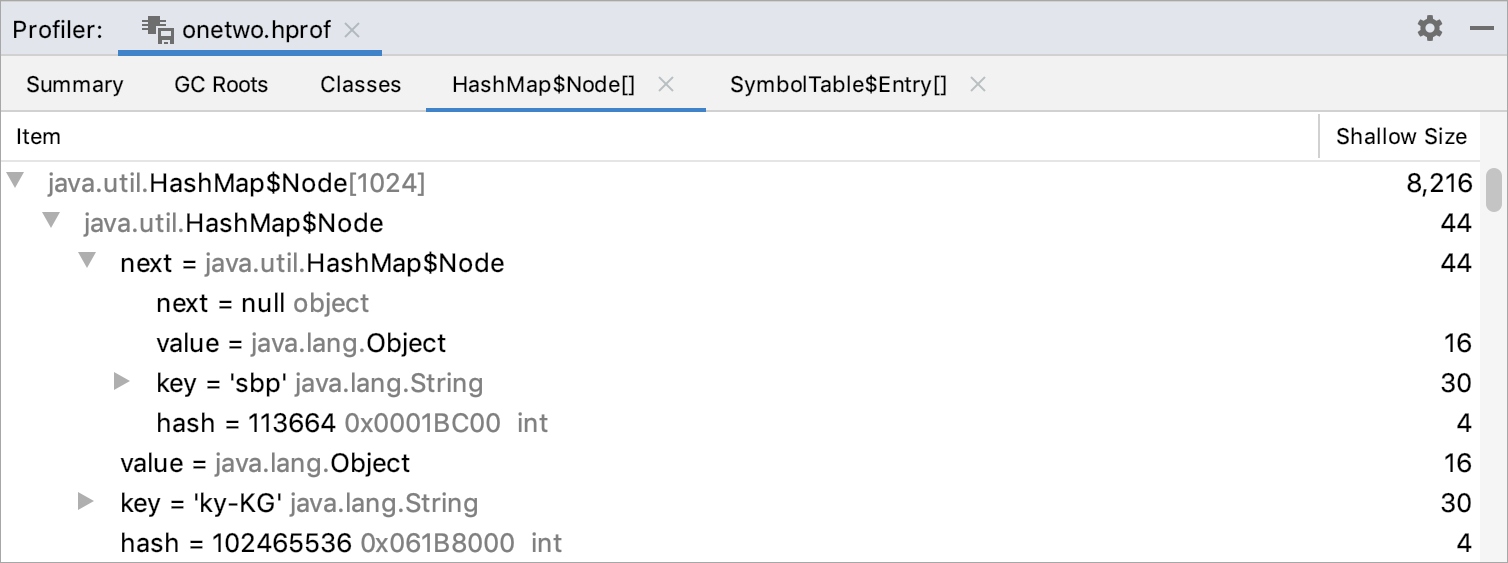
The Object view tab opens after you double-click an item on the Classes tab. It shows the first 100,000 class instances with the field value viewer.
