Interactive debugger console
The interactive Console pane shows you stack traces and everything that was logged in your code (for example, using console.*).
The Console pane is also a read-eval-print loop (REPL) so you can run JavaScript code snippets in it and interact with the page that you are currently debugging.
Run JavaScript in the Console
Navigate to source code
-
At each line with output of
console.*, IntelliJ IDEA shows the name of the file and the line where it was called. Click this link to jump to the call in the source code.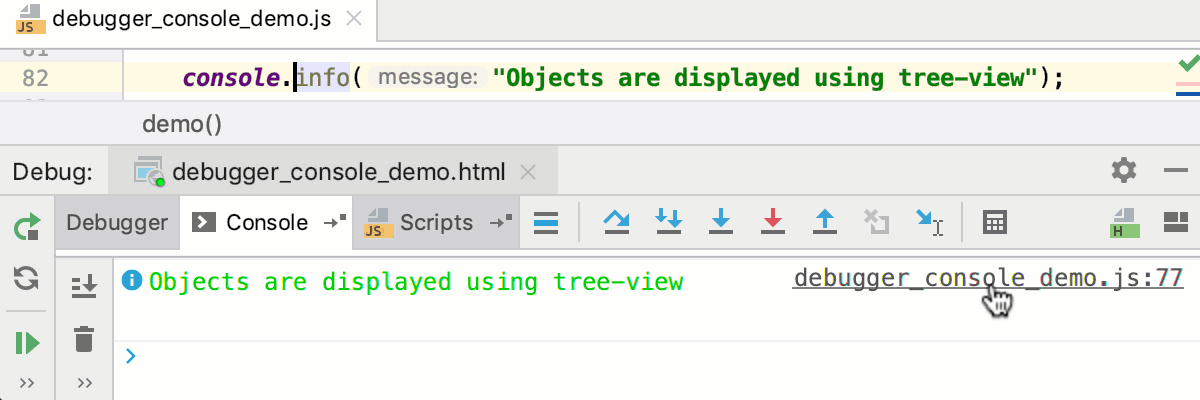
-
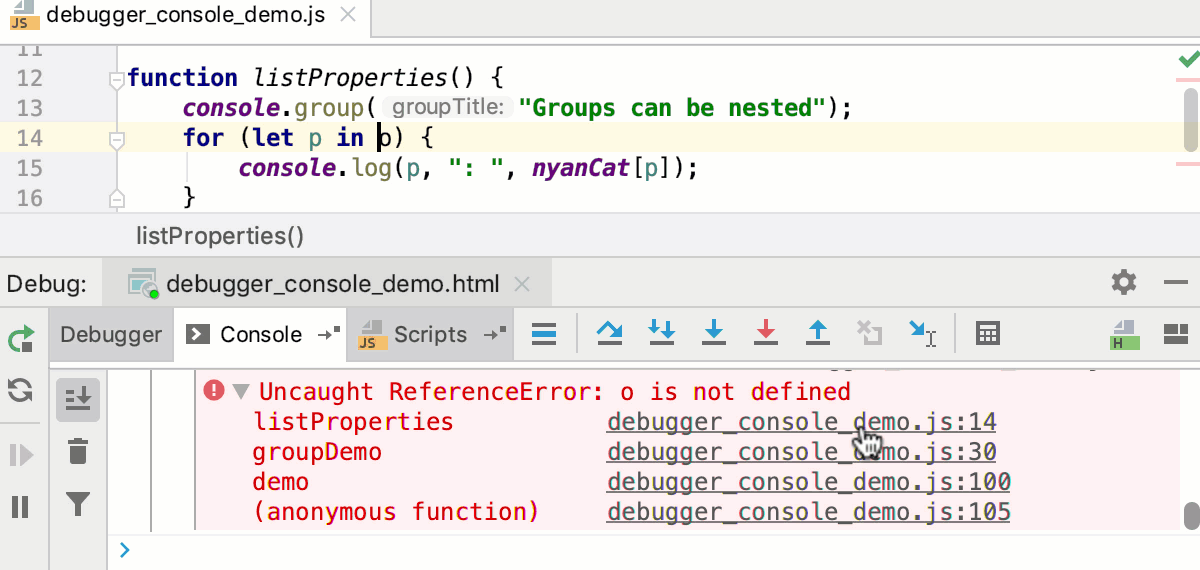
The Console also shows stack traces. Click the link next to a reported problem to jump to the line of code where this problem occurred.
Filter out messages
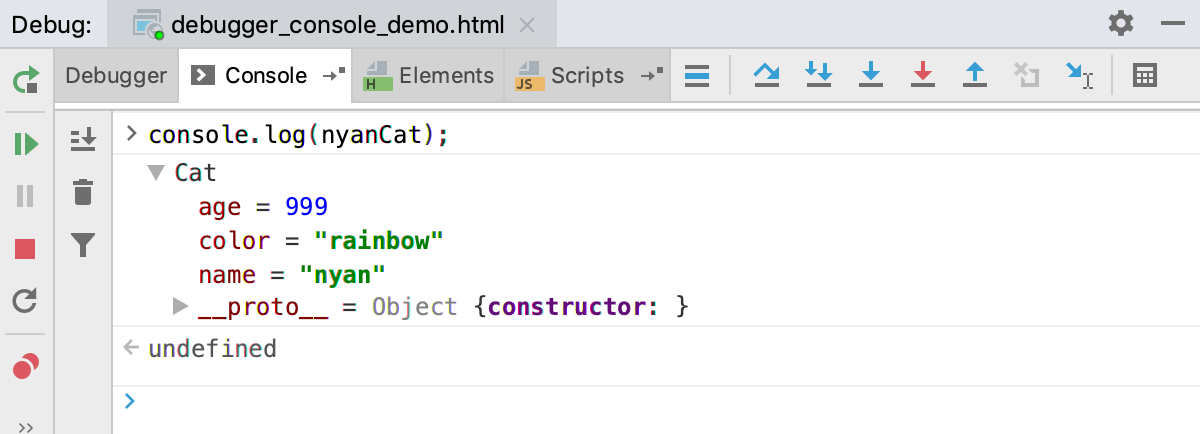
The console shows objects in a tree view, with stack traces collapsed by default. Warnings console.warn(), errors console.error(), and info console.info() messages have different icons and background colors to make them easier to notice.
-
To hide log messages of specific types, click
 and select the severities to filter out.
Group messages

Apply CSS styles
-
Use CSS and the
%cmarker to apply styles to log messages.