Using interactive Debugger Console
When you are debugging a Node.js application, IntelliJ IDEA shows two console tabs in the Debug tool window - Console and Debugger Console.
-
The Console tab shows the output of the node process itself, that is, everything that is written to process.stdout and process.stderr directly or is logged using console.*.

-
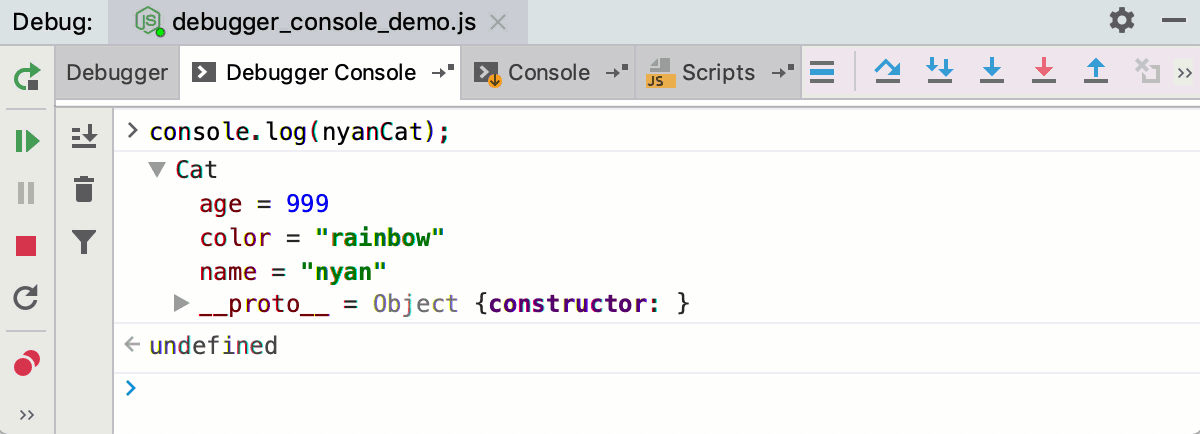
In the Debugger Console, you can run JavaScript code snippets and view the console.* messages.
Run JavaScript in the Debugger Console
Navigate to source code
-
At each line with output of
console.*, IntelliJ IDEA shows the name of the file and the line where it was called. Click this link to jump to the call in the source code.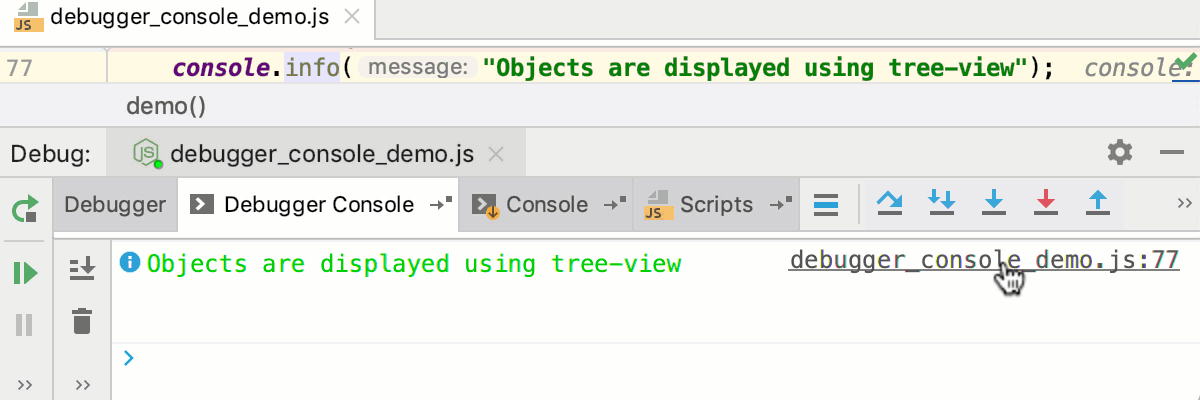
-
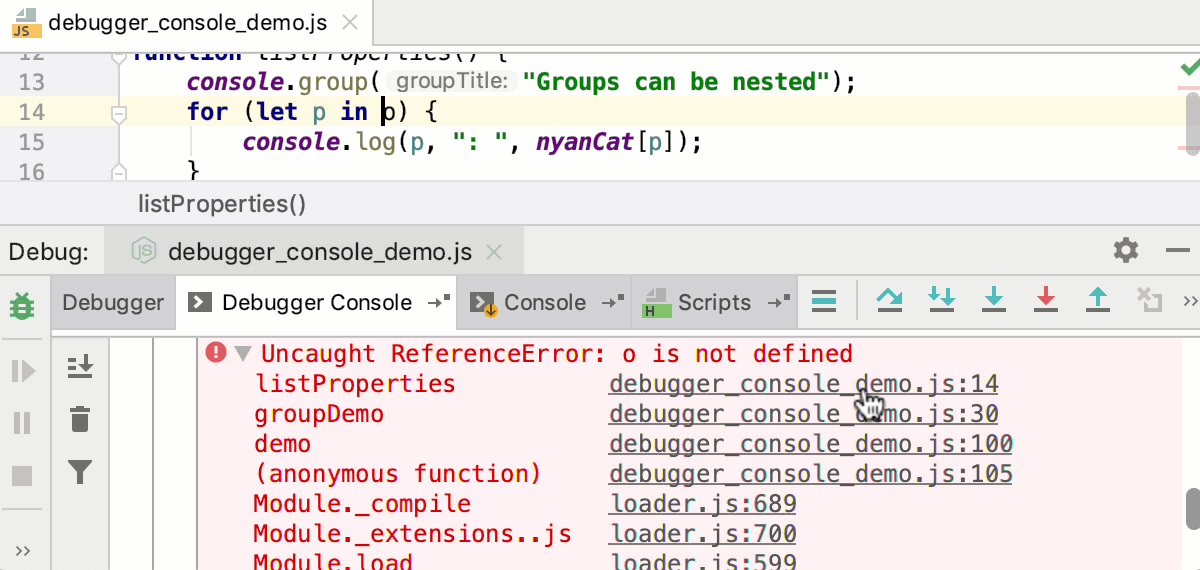
The Debugger Console also shows stack traces. Click the link next to a reported problem to jump to the line of code where this problem occurred.
Filter out messages
The console shows objects in a tree view, with stack traces collapsed by default. Warnings console.warn(), errors console.error(), and info console.info() messages have different icons and background colors to make them easier to notice.
-
To hide log messages of specific types, click
 and select the severities to filter out.
Group messages

Apply CSS styles
-
Use CSS and the
%cmarker to apply styles to log messages.