JPA console tool window
From the Persistence tool window (for a persistence unit or any node within it):
 in the title bar
 Console from the context menu
Ctrl+Shift+F10
The input pane of a query console opens as a separate editor tab. The input pane is where you compose your SQL statements.
When you execute a statement, the Services tool window opens. The Services tool window displays available connection sessions, Output and Result tabs. For more information about the Services tool windows, see Services tool window.
If the executed statement retrieves data (for example, SELECT), results are displayed in the Result tab that has a title of a qualified table name. For more information about creating custom titles for result tabs, see Use custom titles for tabs with results.

Toolbar icons and shortcuts
Most of the functions in the Hibernate Console tool window are accessed by means of the toolbar icons and associated keyboard shortcuts.
| Item | Shortcut | Description |
|---|---|---|
| Ctrl+Enter | Use this icon or shortcut to run the current query. | |
| Ctrl+Alt+Shift+Enter | Generate DDL SQL statements The generated statements will be shown in the output pane. | |
| Open the Database page of the Settings dialog to view or edit the settings for the database, Hibernate and JPA consoles, data editors, and the Database tool window. | ||
| Open or close the Parameters dialog. | ||
| Ctrl+Alt+E | Open a dialog that shows all the queries that you have run in the console. See also, Running auto-memorized queries. | |
| Restore the original tool window layout after layout changes. | ||
| Ctrl+F2 | Terminate execution of the current query. | |
| Ctrl+Shift+F4 | Close the console. |
Output pane
Use the Output tab to view information about queries that ran in IntelliJ IDEA. Also, the Output tab displays errors.

Right toolbar
| Item | Description |
|---|---|
| Wrap long lines of text. | |
| Scroll the output log to the end. | |
| Print a query console file, a selected text, or all the files in a directory. | |
| Clear the Output tab. |
Context menu
| Item | Description |
|---|---|
| Copy the selected text. | |
| Copy as Plain Text | Copy the selected text as plain text (without formatting). |
| Copy Reference | Copy a reference link to a file or a line. |
| Open the Clipboard vs Editor dialog where you can see the diff between the selected text and the text that you copied to a clipboard. | |
| Search with Google | Open a browser and run a search on Google for the selected text. |
| Fold Lines Like This | Fold the lines that include the selected text. |
| Pause Output | Pause the output logging. |
| Clear All | Clear the output log. |
Result pane
This pane shows the data retrieved from the database in table format. You can sort the data as well as perform other, associated tasks.
Most of the functions in the Result pane are accessed by using controls on the toolbar, context menu commands for the data cells, and associated keyboard shortcuts. You can see what other actions with tables you can perform in Tables.
| Item | Shortcut | Description |
|---|---|---|
Use navigation icons and corresponding commands for switching between pages that show the retrieved data. A number of rows that you see simultaneously on the Result tab are referred to as a result set page. If this number is less than the number of rows that satisfy the query, only a subset of all the rows is shown at a time. If all the rows are currently shown, navigation icons and the corresponding commands are inactive.
To change the size of a result set page, open settings (Ctrl+Alt+S) and navigate to Tools | Database | Data Views. In the Limit page size to field, type a new size of a result set page. Alternatively, to disable the page size restriction, clear the Limit page size to checkbox. | ||
| Ctrl+F5 | Reload data for the table view to synchronize the data that you see in the editor with the contents of the database. Also, use the Reload Page button when you want to apply a new page size limit setting after its change. | |
Select an output format for your data. Also, you can configure the following options:
| ||
| Copy All To Clipboard / Save All To File |
Note:
| |
| Save LOB | Save a binary large object (LOB) currently selected in the table in a file. | |
| Reset View | Use this command to restore the initial table view after reordering or hiding the columns, or sorting the data. As a result, the data, generally, becomes unsorted, the columns appear in the order in which they were defined initially, and all the columns are shown. | |
| View Query | Use this button to view the query which was used to generate the table. To close the pane where the query is shown, press Escape. | |
| Go To | Row | Ctrl+G | Jump to a specified row. In the Go to Row dialog, specify the column and row number (use the column:row pattern). |
Using the header row. In the Result pane, you can use the cells in the header row (i.e. the row where column names are shown) for:
To sort table data in a column, click the corresponding cell in the header row. You can click several header row cells to sort table data on multiple columns.
| State | Description |
|---|---|
| Indicates that the data is not sorted in this column. The initial state of the sorting marker. | |
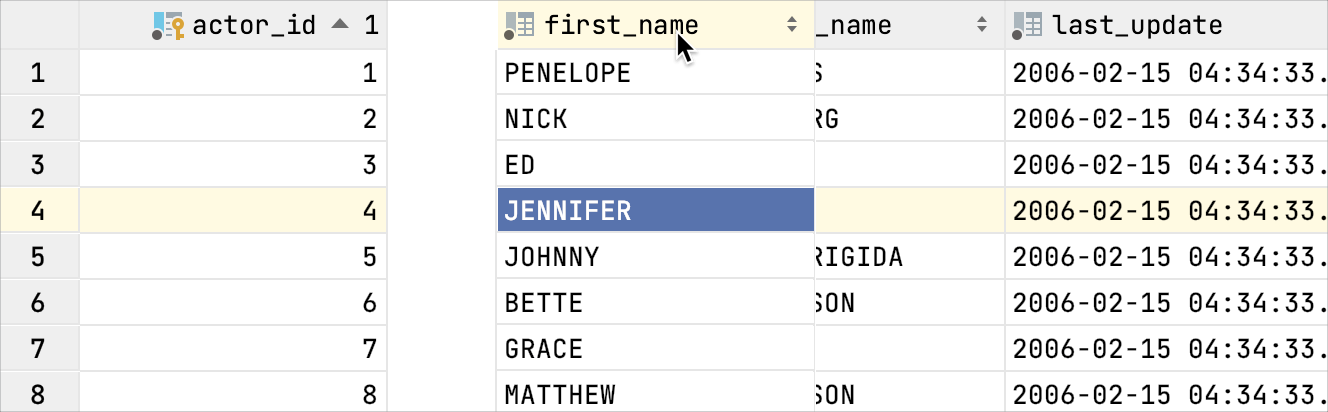
| The data is sorted in the ascending order. The number to the right of the marker (1 on the picture) is the sorting level. You can sort by more than one column. In such cases, different columns will have different sorting levels. | |
| The data is sorted in the descending order. |
Here is an example of a table where data are sorted by two of its columns.

To restore the initial "unsorted" state for the table, click ![]() and select Reset View.
and select Reset View.
To reorder columns, use drag-and-drop for the corresponding cells in the header row.
To hide a column, right-click the corresponding header cell and select Hide column.
Right-click any of the cells in the header row and select Column List. Alternatively, press Ctrl+F12.
Select the hidden column and press Ctrl+F12
To hide a column, right-click the corresponding header cell and select Hide column.
To show a hidden column:
- Do one of the following:
Right-click any of the cells in the header row and select Column List.
Press Ctrl+F12.
In the list that appears, the names of hidden columns are shown struck through.

Select (highlight) the column name of interest and press Space.
Press Enter or Escape to close the list.
To show all the columns, click ![]() and select Reset View.
and select Reset View.
See also, Using the Structure view to sort data, and hide and show columns.
Parameters pane
The Parameters pane shows the parameters detected in the input pane and lets you edit their values. To open or close this pane, use ![]() on the toolbar.
on the toolbar.
Parameter values can be specified just as text or numbers, or as Groovy expressions that contain object references and method calls. For example, the value for the date parameter in the query
could be specified as
To start editing a value, switch to the corresponding table cell and start typing. To indicate that you have finished editing a value, press Enter or switch to a different cell. To quit the editing mode and restore an initial value, press Escape.
When you select a row in the table, the corresponding parameter is highlighted in the input pane.