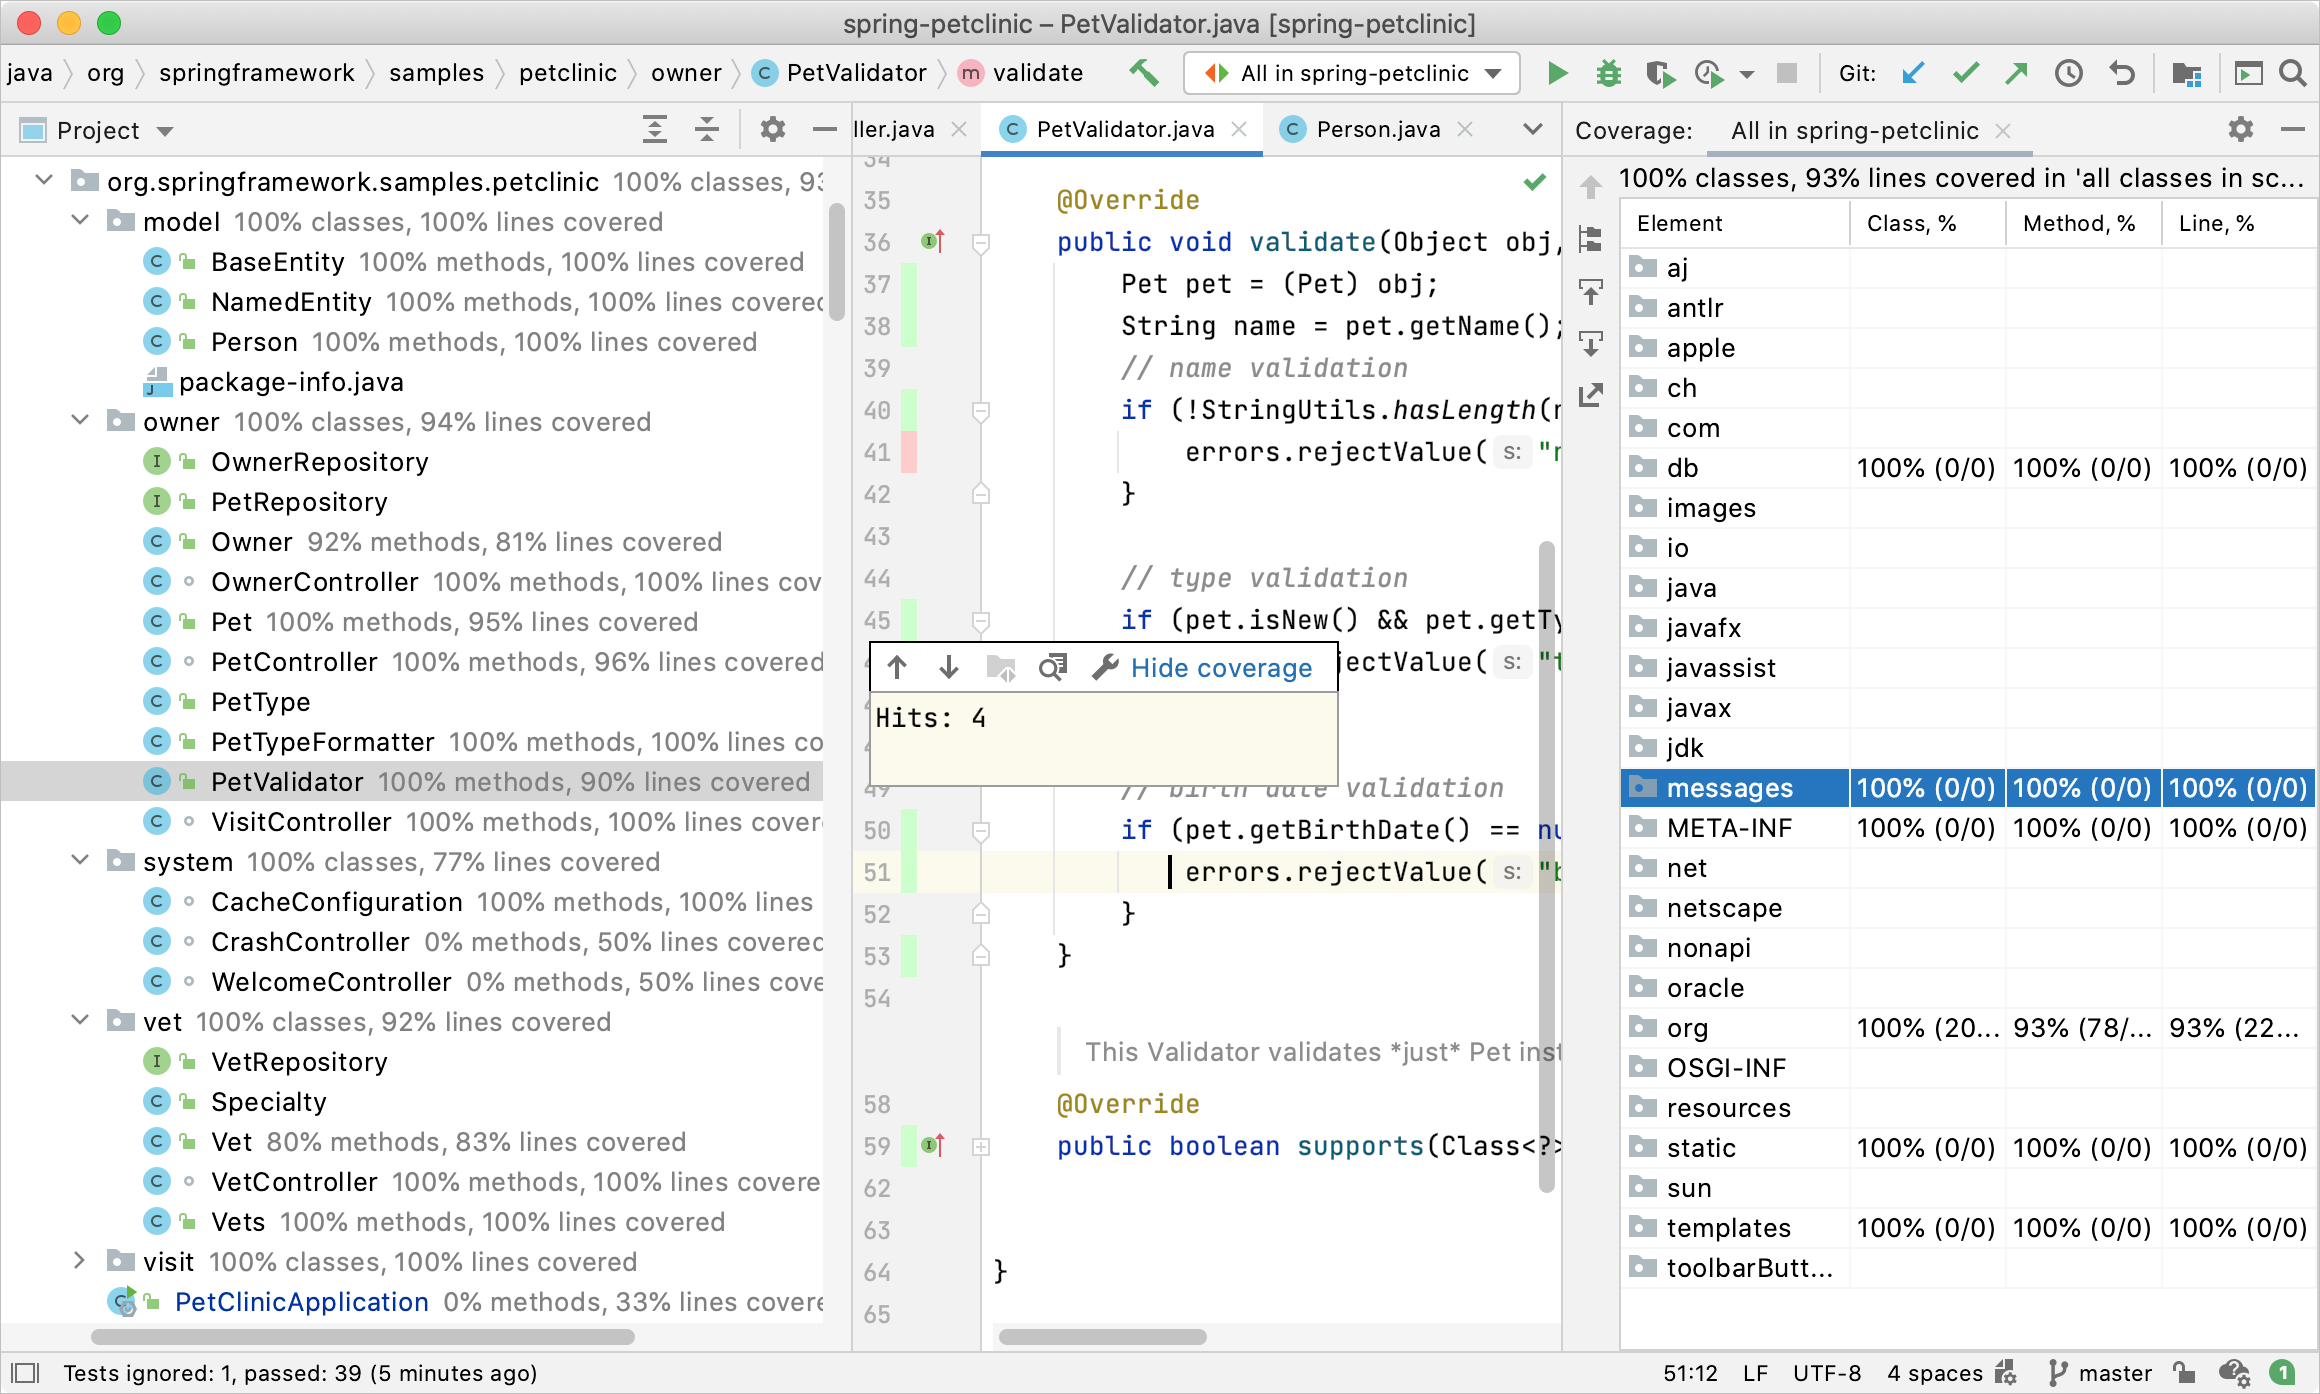
Read the coverage report
Code coverage results are displayed in the Coverage tool window, in the Project tool window, and in the editor after you run at least one configuration with coverage.

Results of the code coverage analysis are saved to the coverage folder in the IDE system directory.
Coverage in the Project tool window
The Project tool window displays the percentage of the covered classes and lines for directories and the percentage of the covered methods and lines for classes.

Coverage in the Coverage tool window
The Code Coverage tool windows appears right after you run a configuration with coverage and displays the coverage report. If you want to reopen the Coverage tool window, select from the main menu, or press Ctrl+Alt+F6.
The report shows the percentage of the code that has been executed or covered by tests. You can see the coverage result for classes, methods, and lines.
Branch coverage shows the percentage of the executed branches in the source code (normally, these are the if/else and switch statements). This information is available for the JaCoCo runner and for the IntelliJ IDEA runner with the Tracing option enabled.

Code Coverage tool window options
Item | Description |
|---|---|
Go up one level. | |
Show all packages on the same level. | |
If this option is on, IntelliJ IDEA automatically opens the selected item in the editor. Otherwise, you need to double-click items to open them. | |
If this option is on, IntelliJ IDEA automatically locates in the tool window the files that you open in the editor. | |
Generate a code coverage report and save it to the specified directory. Refer to section Save coverage data to a file for details. |
Coverage results in the editor
In the editor, lines of code are highlighted with regard to their code coverage status in the gutter:
Green: lines that have been executed during simulation
Red: lines that haven't been executed during simulation
Yellow: lines covered with conditions tracing mode
To find out how many times a line has been run, click the color indicator in the gutter. A popup that opens shows the statistic for the line at caret. For the lines with conditions, the popup also provides statistics.

For JUnit tests, you can open the test that covers a line in a separate dialog. To do so, click the icon in the popup. To be able to use this feature, enable the Tracing mode and Track per test coverage options for the current run/debug configuration in the Code Coverage area. For more information, refer to Set coverage in run configurations.
Click to open the bytecode of the current class in a separate dialog, or
to change the colors of the coverage indicators in the gutter.