Spark monitoring
With the Big Data Tools plugin, you can monitor your Spark jobs.
Typical workflow:
Connect to a Spark server
In the Big Data Tools window, click
and select Spark.
In the Big Data Tools dialog that opens, specify the connection parameters:

Name: the name of the connection to distinguish it between the other connections.
URL: the URL of the Spark server.
Optionally, you can set up:
Per project: select to enable these connection settings only for the current project. Deselect it if you want this connection to be visible in other projects.
Enable connection: deselect if you want to restrict using this connection. By default, the newly created connections are enabled.
Enable tunneling: creates an SSH tunnel to the remote host. It can be useful if the target server is in a private network but an SSH connection to the host in the network is available.
Select the checkbox and specify a configuration of an SSH connection (click ... to create a new SSH configuration).
Enable HTTP basic authentication: connection with the HTTP authentication using the specified username and password.
Proxy: select if you want to use IDE proxy settings or if you want to specify custom proxy settings.
Once you fill in the settings, click Test connection to ensure that all configuration parameters are correct. Then click OK.
You can also connect to a Spark server by opening a Spark job in a running notebook.
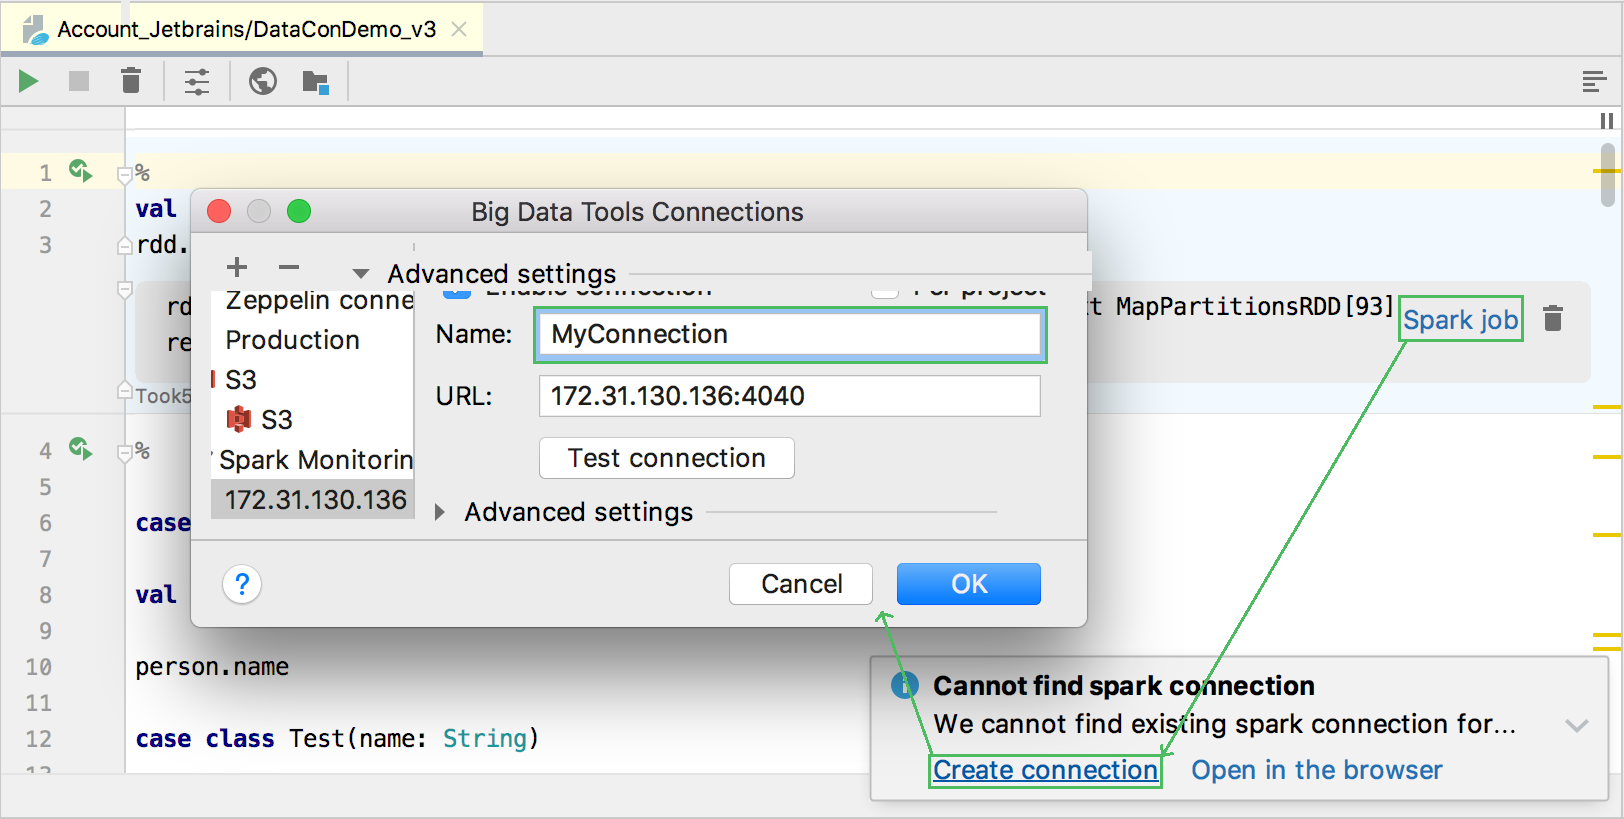
Establish connection using the running job
In the notebook that involves any Spark execution, run the corresponding cell.
Click the Spark job link in the output area. In the displayed balloon message, select the Create connection link.

In the Big Data Tools Connections dialog, enter a unique connection name in the Name field. This is to distinguish between different opened connections in the Spark monitoring tool window.
You can click the Text connection button to check if the connection has been established successfully, then click OK to finalize configuring.
At any time, you can open the connection settings in one of the following ways:
Go to the Tools | Big Data Tools Settings page of the IDE settings Ctrl+Alt+S.
Click
on the Spark monitoring tool window toolbar.
Once you have established a connection to the Spark server, the Spark monitoring tool window appears.

The window consists of the several areas to monitor data for:
Application: a user application is being executed on Spark , for example, a running Zeppelin notebook.
Job: a parallel computation consisting of multiple tasks.
Stage: a set of tasks within a job.
Environment: runtime information and Spark server properties.
Executor: a process launched for an application that runs tasks and keeps data in memory or disk storage across them.
Storage: server storage utilization.
SQL: specific details about SQL queries execution.
You can also preview info on Tasks, units of work that sent to one executor.
Refer to Spark documentation for more information about types of data.
Adjust layout
In the list of the application jobs, select a job to preview.
To focus on a particular stage, switch to the Stages tab.

To manage visibility of the monitoring areas, use the following buttons:
Shows details for the selected stage.
Shows the list of the tasks executed during the selected stage.

Click
to preview any monitoring data in a browser.
Once you have set up the layout of the monitoring window, opened or closed some preview areas, you can filter the monitoring data to preview particular job parameters.
Filter out the monitoring data
Use the following buttons in the Applications, Jobs, and Stages tabs to show details for the jobs and stages with specific status.
Show running applications, jobs, or stages
Show succeeded applications, jobs, or stages
Show failed jobs or stages
Show jobs or stages with unknown status
Show skipped stages
Filter the list of applications by a start time and end time. Besides, you can specify the limit of the items in the filtered list.

Manage content within a table:
Click a column header to change the order of data in the column.
Click Show/Hide columns on the toolbar to select the columns to be shown in the table:

At any time, you can click on the Spark monitoring tool window to manually refresh the monitoring data. Alternatively, you can configure the automatic update within a certain time interval in the list located next to the Refresh button. You can select 5, 10, or 30 seconds.