Debug Kotlin coroutines
While coroutines are particularly well suited for asynchronous programming, there is still room for mistakes, which may be hard to figure out due to the challenges that the asynchronous flow poses.
When debugging Kotlin code, IntelliJ IDEA allows you to suspend the execution and diagnose problems that the code in coroutines may have. The debug information is available even if the coroutine is not running at the moment.
Learn more in the Kotlin documentation.
Inspect coroutines
Set a breakpoint in or near the coroutine code.
Start the application in debug mode.
Wait until the application reaches the breakpoint.
In the Debug tool window, select the Coroutines tab from the Layout Settings.
The view groups coroutines by their dispatchers. Expand a dispatcher node to see its coroutines.
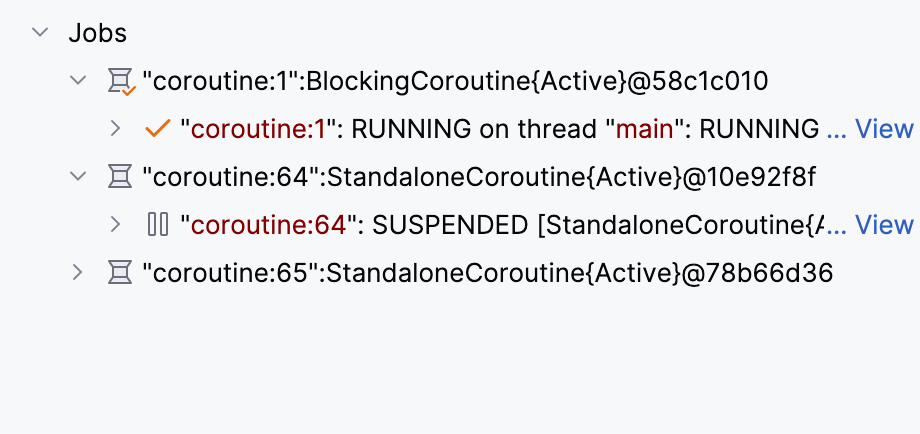
For each coroutine, IntelliJ IDEA displays its current state:
CREATED: The coroutine is created but is not running.
RUNNING: The coroutine is currently executing.
SUSPENDED: The coroutine is paused and is not currently executing on a thread.
Where applicable, the view also shows information about the thread on which a coroutine is executing.
Examine a coroutine
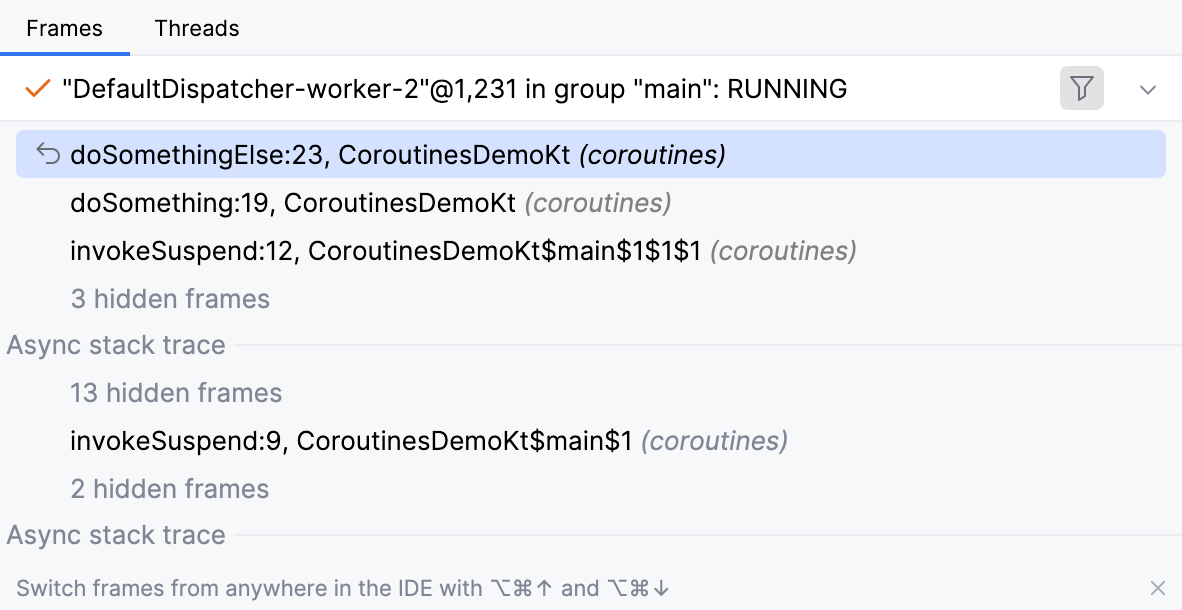
In the Coroutines tab, you can see a full coroutine creation stack, as well as a call stack inside the coroutine. The stack includes all frames with variable values, even those that would be lost during standard debugging.
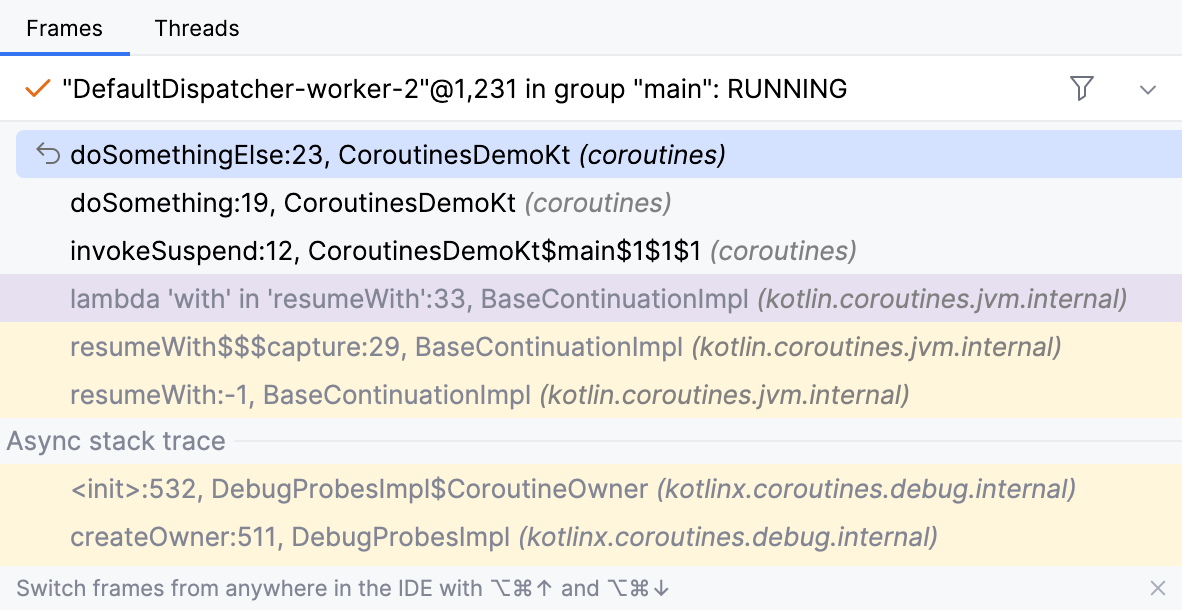
When debugging coroutines, you can use all the standard functionality of the Variables tab. For more information about using the Variables tab, refer to the Examine/update variables topic.
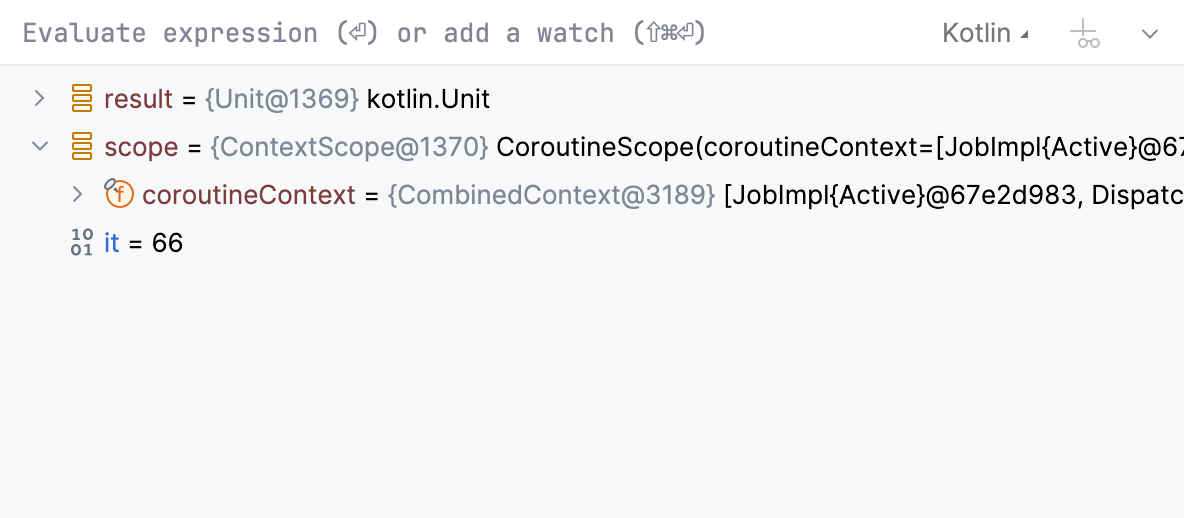
If you are not interested in calls in Kotlin classes, you can hide them by clicking Hide Frames from Libraries in the top-right corner of the Frames tab.
Capture a thread and coroutine dump
If you need a report containing the state of each coroutine and its stack, use a thread dump.
IntelliJ IDEA's thread dumps can include:
Java platform threads
Virtual threads
Detected Kotlin coroutines and their stacks
Get coroutines dump
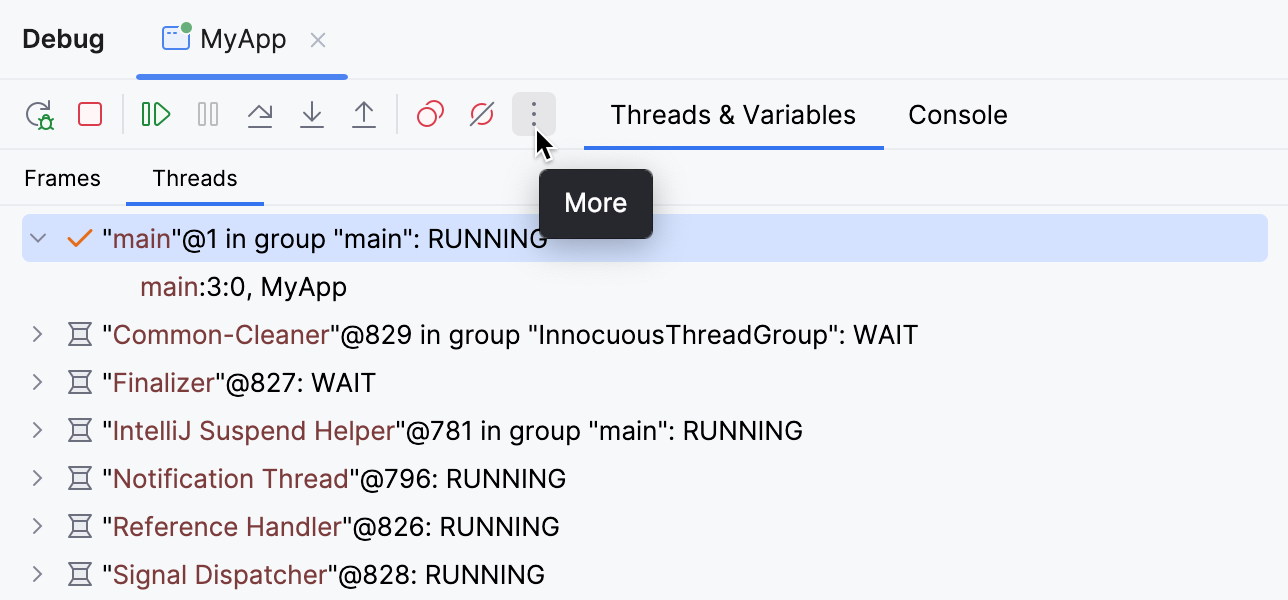
On the Debug tool window's toolbar, click
 More, then select
  Get Thread Dump.