JPA Console
The JPA Console lets you write, validate, and run queries in the following languages:
Hibernate Query Language (HQL)
Prerequisites
The following plugins are enabled:
Jakarta EE: Persistence (JPA) (bundled)
Database Tools and SQL (bundled)
To check if the plugins are enabled, open the Plugin settings and inspect the Installed tab.
Your project uses JDK 8 or later.
Your build file (pom.xml or build.gradle) includes at least one of the following APIs:
Jakarta Persistence
Hibernate
EclipseLink
Spring Data JPA
Your project files include at least one entity class.
The Database tool window lists at least one data source.
Open the console
Open the JPA Console manually if you want to run JPQL, HQL, or EQL queries that are not present in your code or if you want the console to use custom JVM options.
Open the console with default settings
Open the Persistence tool window ().
Select a persistence unit.
In the tool window toolbar, click
 JPA Console.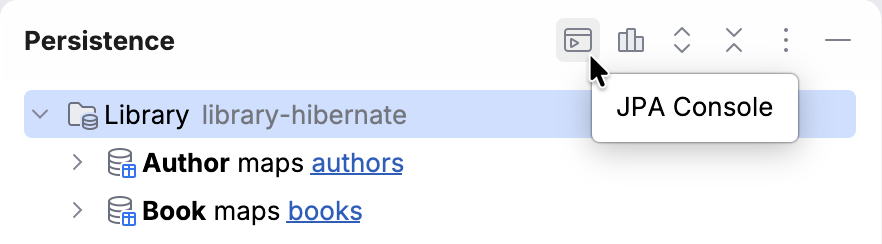
Alternatively, press Ctrl+Shift+F10.
The JPA Console opens in a dedicated tool window. You can now run queries.
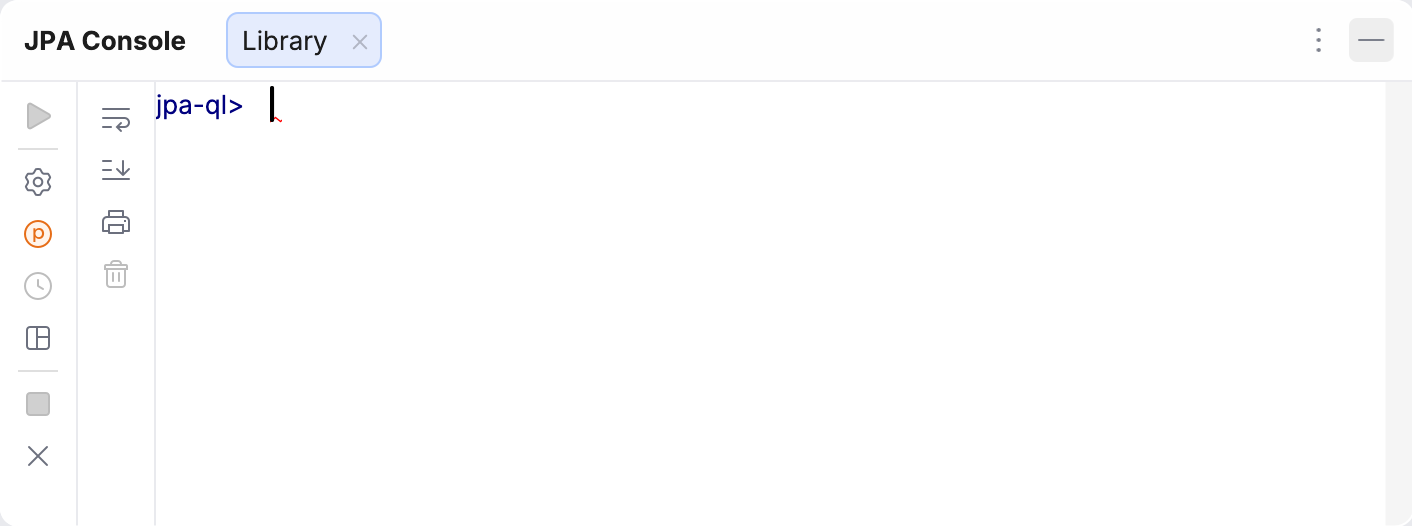
To learn what the icons in the console represent, refer to Reference: JPA Console.
Open the console with custom JVM options
The JPA Console runs in a separate Java process. You can run this process with custom JVM options by creating a run configuration and then selecting it when you open the console.
Open the Run/Debug Configurations dialog:
In the main toolbar, click the run widget and select Edit Configurations….
Alternatively, go to .
On the left side of the dialog, select
 Add New Configuration |
  Application.
On the right side of the dialog, select .
In the VM options field, specify the options that you want to pass to the JVM when opening the JPA Console.
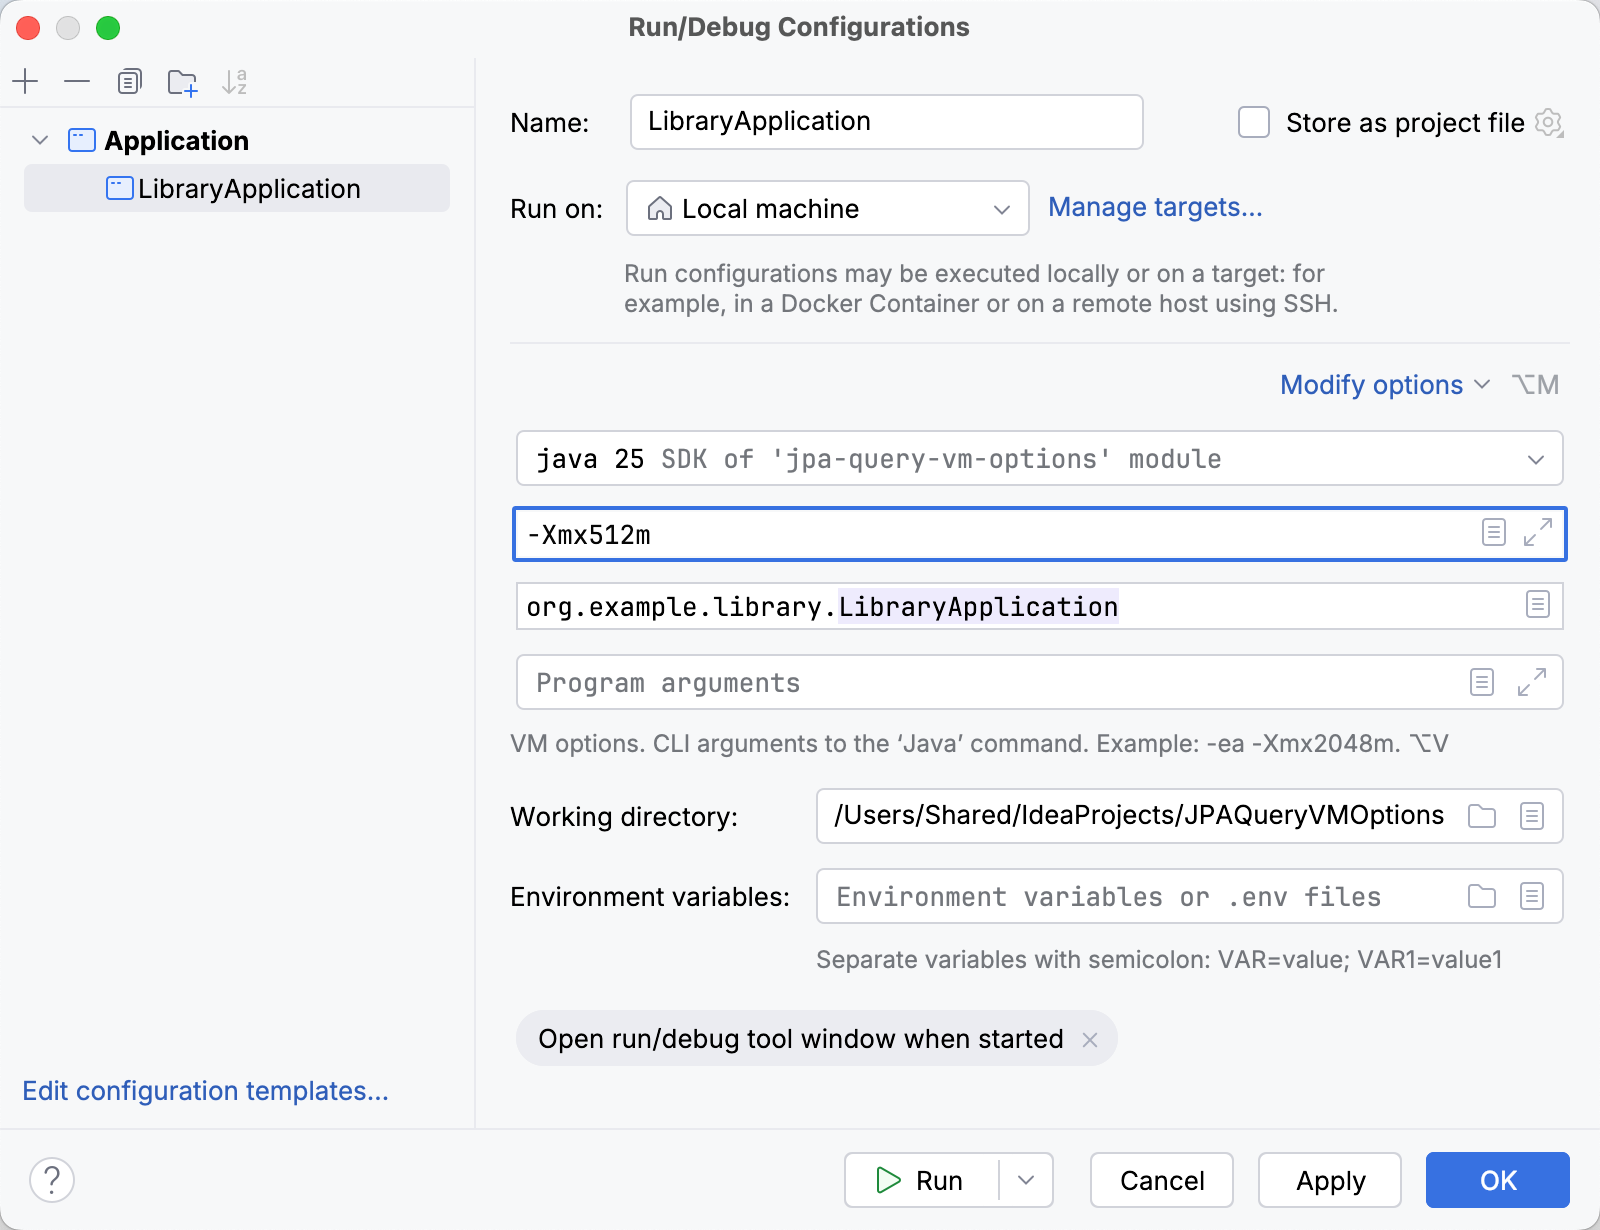
You can also set up other run configuration settings, but it is not required for the console.
Click Apply and then OK.
Open the Persistence tool window ().
Select a persistence unit.
In the tool window toolbar, select
JPA Console |  <Your Configuration Name>.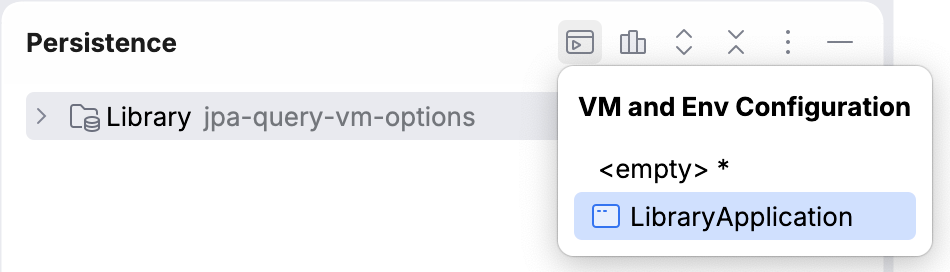
The JPA Console opens in a dedicated tool window with your JVM options applied. You can now run queries.
To learn what the icons in the console represent, refer to Reference: JPA Console.
Run queries
You can run queries in the JPA Console from either the console itself or from the editor.
IntelliJ IDEA runs your queries against a data source from the Database tool window. If there is more than one data source, the IDE looks for a match in the following configurations (in this order): a running Spring Debugger session, an explicit assignment in the Persistence tool window, or data source URL in Spring Boot configuration files. If IntelliJ IDEA cannot determine which data source to use, you will be prompted to select one.
Run a query from the JPA Console
Type or paste your query.
In the console toolbar, click
 Execute Query.
Alternatively, press Ctrl+Enter.
If the query accepts parameters, the Parameters dialog opens. Specify the values and click Execute.
IntelliJ IDEA executes the query and opens its results in a new tab.
Run a query from the editor
Place the caret at a query in the editor.
Right-click the query and select
 Show Context Actions | Run query in console.
Alternatively, press Alt+Enter and select
Run query in console.
If the query accepts parameters, the Parameters dialog opens. Specify the values and click Execute.
IntelliJ IDEA executes the query and opens its results in the JPA Console.
Run a Spring Data query method from the editor
If your project uses Spring Data, you can run your repository methods right from the editor gutter. This feature is available for the following method types:
Methods where the query is derived from the method name
Methods annotated with
@Querythat define explicit JPQL or SQL queriesMethods annotated with
@NativeQuerythat define explicit SQL queriesMethods where the name references a
@NamedQueryor a@NamedNativeQuerydeclared in the repository's entity class
Open a Spring Data repository in the editor.
In the gutter, click
 Run query in console next to a query method.
If the query accepts parameters, the Parameters dialog opens. Specify the values and click Execute.
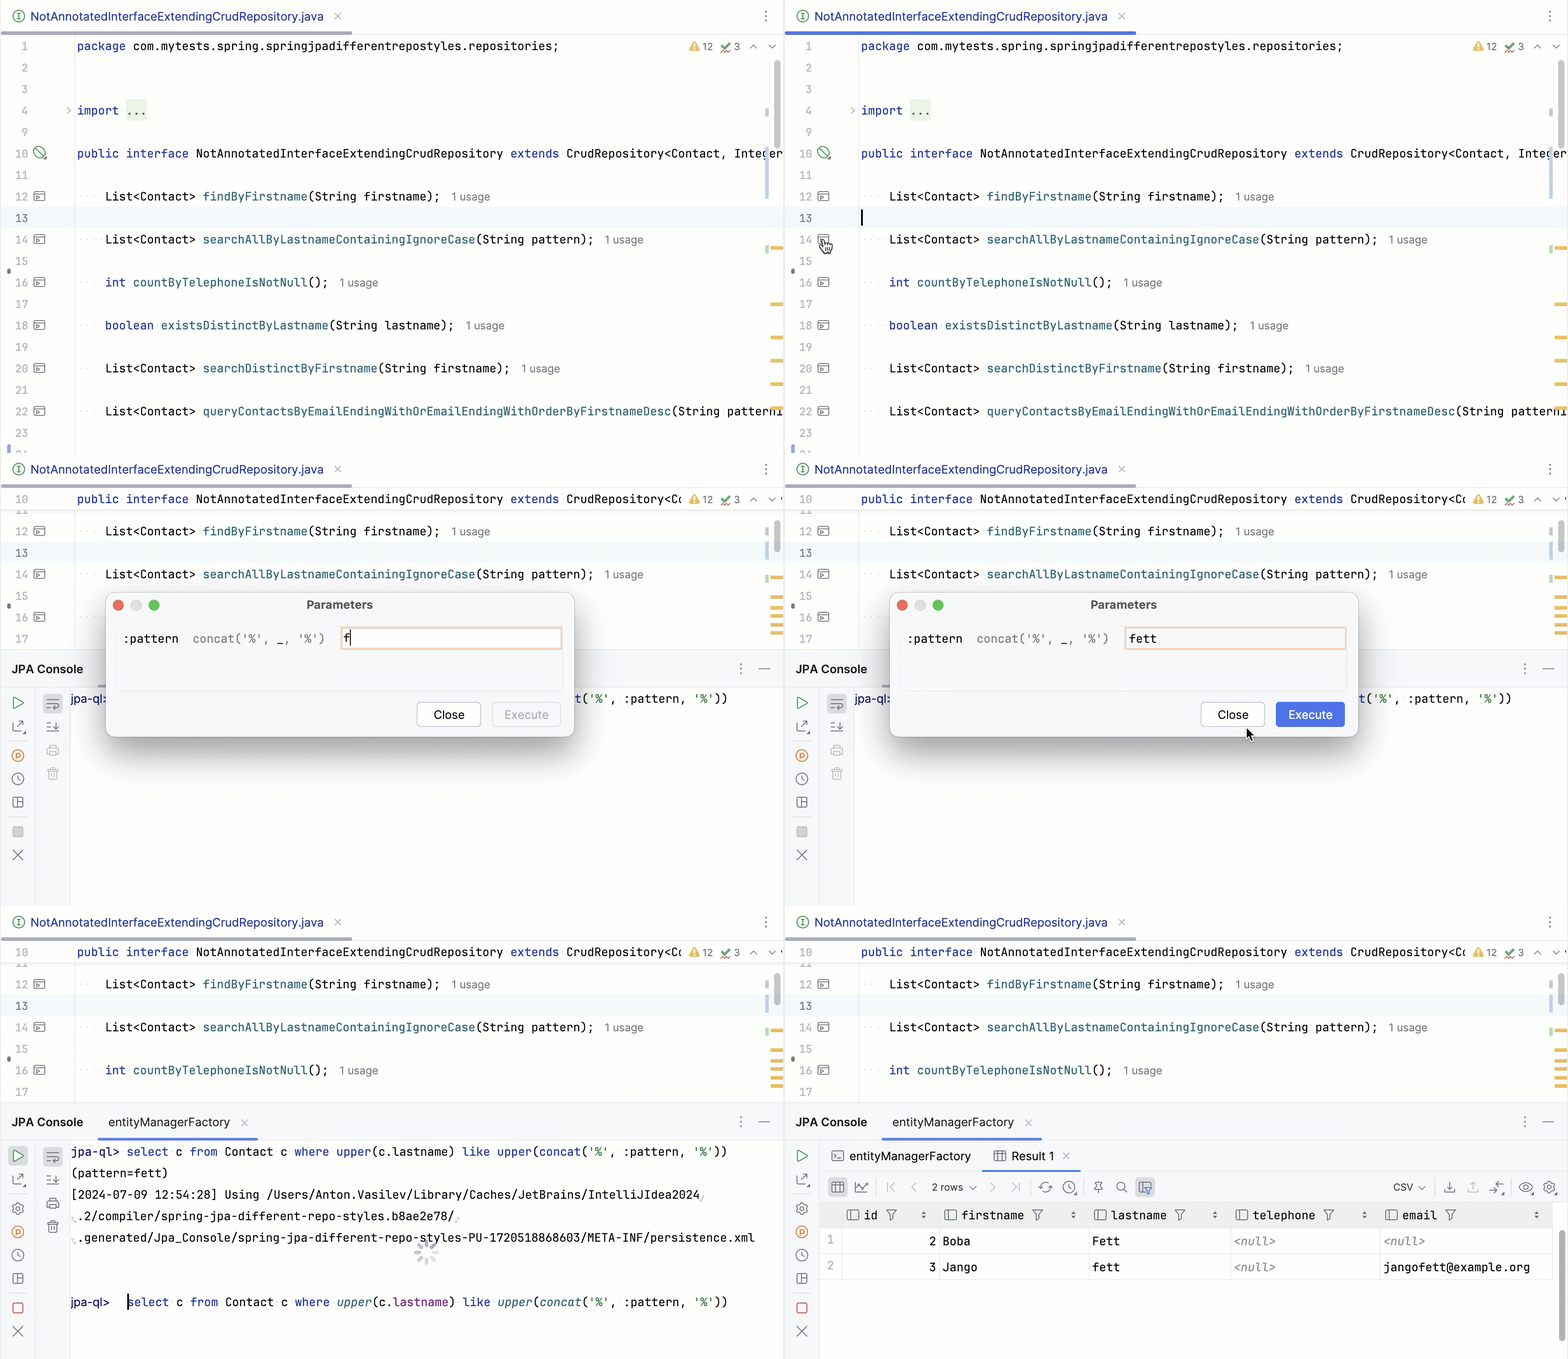
If you ran a JPQL query, the IDE opens the query's results in the JPA Console. If you ran a native SQL query, it opens the results in the Services tool window instead.
Reference: JPA Console
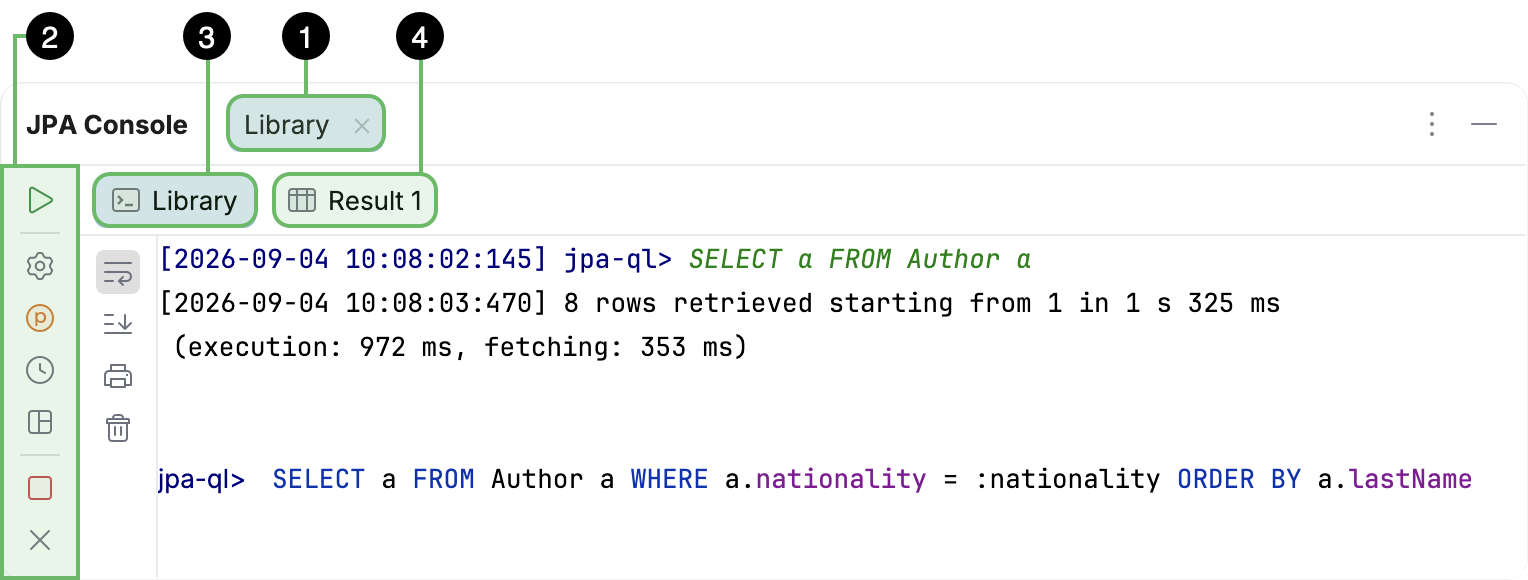
The JPA Console is made up of the following components:
Session tab: holds a single console session and includes the other components. The tab is named after the persistence unit.
Main toolbar: lets you execute queries, configure query execution settings, and manage the console session.
 Output tab: displays the console log and lets you type queries. The tab is named after the persistence unit.
 Result tab: displays the result of a single executed query and lets you customize how the result is displayed. Each query execution opens a new tab.
Main toolbar
Execute Query (Ctrl+Enter)
Run the currently typed query.

Open Query Execution Settings…
Open the Query Execution page in the Settings dialog.

View Parameters
Open the Parameters pane to view the parameters accepted by the query and set their values.

Browse Query History (Ctrl+Alt+E)
Open the History dialog to view all the queries that you have run for this persistence unit and, optionally, copy a selected one to the console.

Restore Default Layout
Restore the original console layout.

Terminate Process (Ctrl+F2)
Disconnect the console from the database but keep the session tab open.

Close (Ctrl+Shift+F4)
Disconnect the console from the database and close the currently open session tab.
Output tab

Soft-Wrap
Wrap long lines in the console log.

Scroll to End
Jump to the bottom of the console log.

Print…
Open the Print dialog.

Clear All
Clear the console log.
Result tab

Switch to Table
View the result in the form of a database table.
Learn more from Explore values.

Switch to Chart
View the result in the form of a chart.
Learn more from Visualize data.

Reload Page (Ctrl+F5)
Reload the data.

Table Result Auto Refresh
Select how often the data should auto-refresh.

Pin Tab
Pin the currently open result tab.

Find on Current Page
Search the data on the currently displayed page for a specific value.

Table Result Local Filter
Enable filtering for all columns or clear all filters.
Learn more from Use the local filter.

Record View
Open a side pane to view the data in the selected record.
Learn more from Single record view.

Table Coloring Options
Configure color mapping for table cells.
Learn more from Apply a heatmap.

Show Geo Viewer
Open an interactive map where you can view geocoordinates from the result.
Learn more from View geographical data.

Data Extractor
Select an output format for the data.
Learn more from Data extractors.

Export Data (table view)
Open the Export Data dialog.
Export to PNG (chart view)
Download the chart as a PNG image.

Import
Open the Import dialog.

Compare Data
Compare this result with a result from a query console.

View as
Select a data view mode.
Learn more from Data view modes.

Show Options Menu (table view)
Open a list with the following options:
Show Value Editor: open the value editor to view the data from the selected cell.
Show Aggregate View: open the aggregate view.
Show Column List: display a list of all columns in the table.
Paste Format: select how to format text pasted from the clipboard.
Reset View: restore the initial table layout.
View Query: view the query that generated the result.
Copy Query to Console: copy the query to the console.
Copy Query to Clipboard: copy the query to the clipboard.
Open Data Views Settings: open the Data Editor and Viewer settings.
Open Data Views Appearance Settings: open the Data Editor and Viewer appearance settings.
Show Series Settings (chart view)
Open the Series Settings pane to configure the chart display options.
Productivity tips
Retrieve all records from an entity's table
You can quickly retrieve all records from a database table by invoking a dedicated action in its entity class. This executes a SELECT entity FROM <ClassName> entity statement in the JPA Console.
Open an entity class in the editor.
In the gutter, select
 Show Entity actions | Run Query in JPA Console.
Alternatively, place the caret at the class name, press Alt+Enter, and select
Run Query in JPA Console.
Navigate to an entity class from a query
You can quickly navigate to an entity class declaration or an entity field declaration from any JPQL, HQL, or EQL query. This applies to queries in both the JPA Console and in the editor.
Hold Ctrl and click an entity name or field name in the query.
Place the caret at an entity name or field name in the query and press Ctrl+B.
Place the caret at an entity name or field name in the query. From the main menu, select .