Hibernate Debugger
Install the Hibernate Debugger plugin
Hibernate Debugger is an IntelliJ IDEA plugin that lets you inspect database queries run in your application and trace them back to where your code triggers them. It works with applications that use Hibernate 6 or later, either directly or through a framework like Spring.
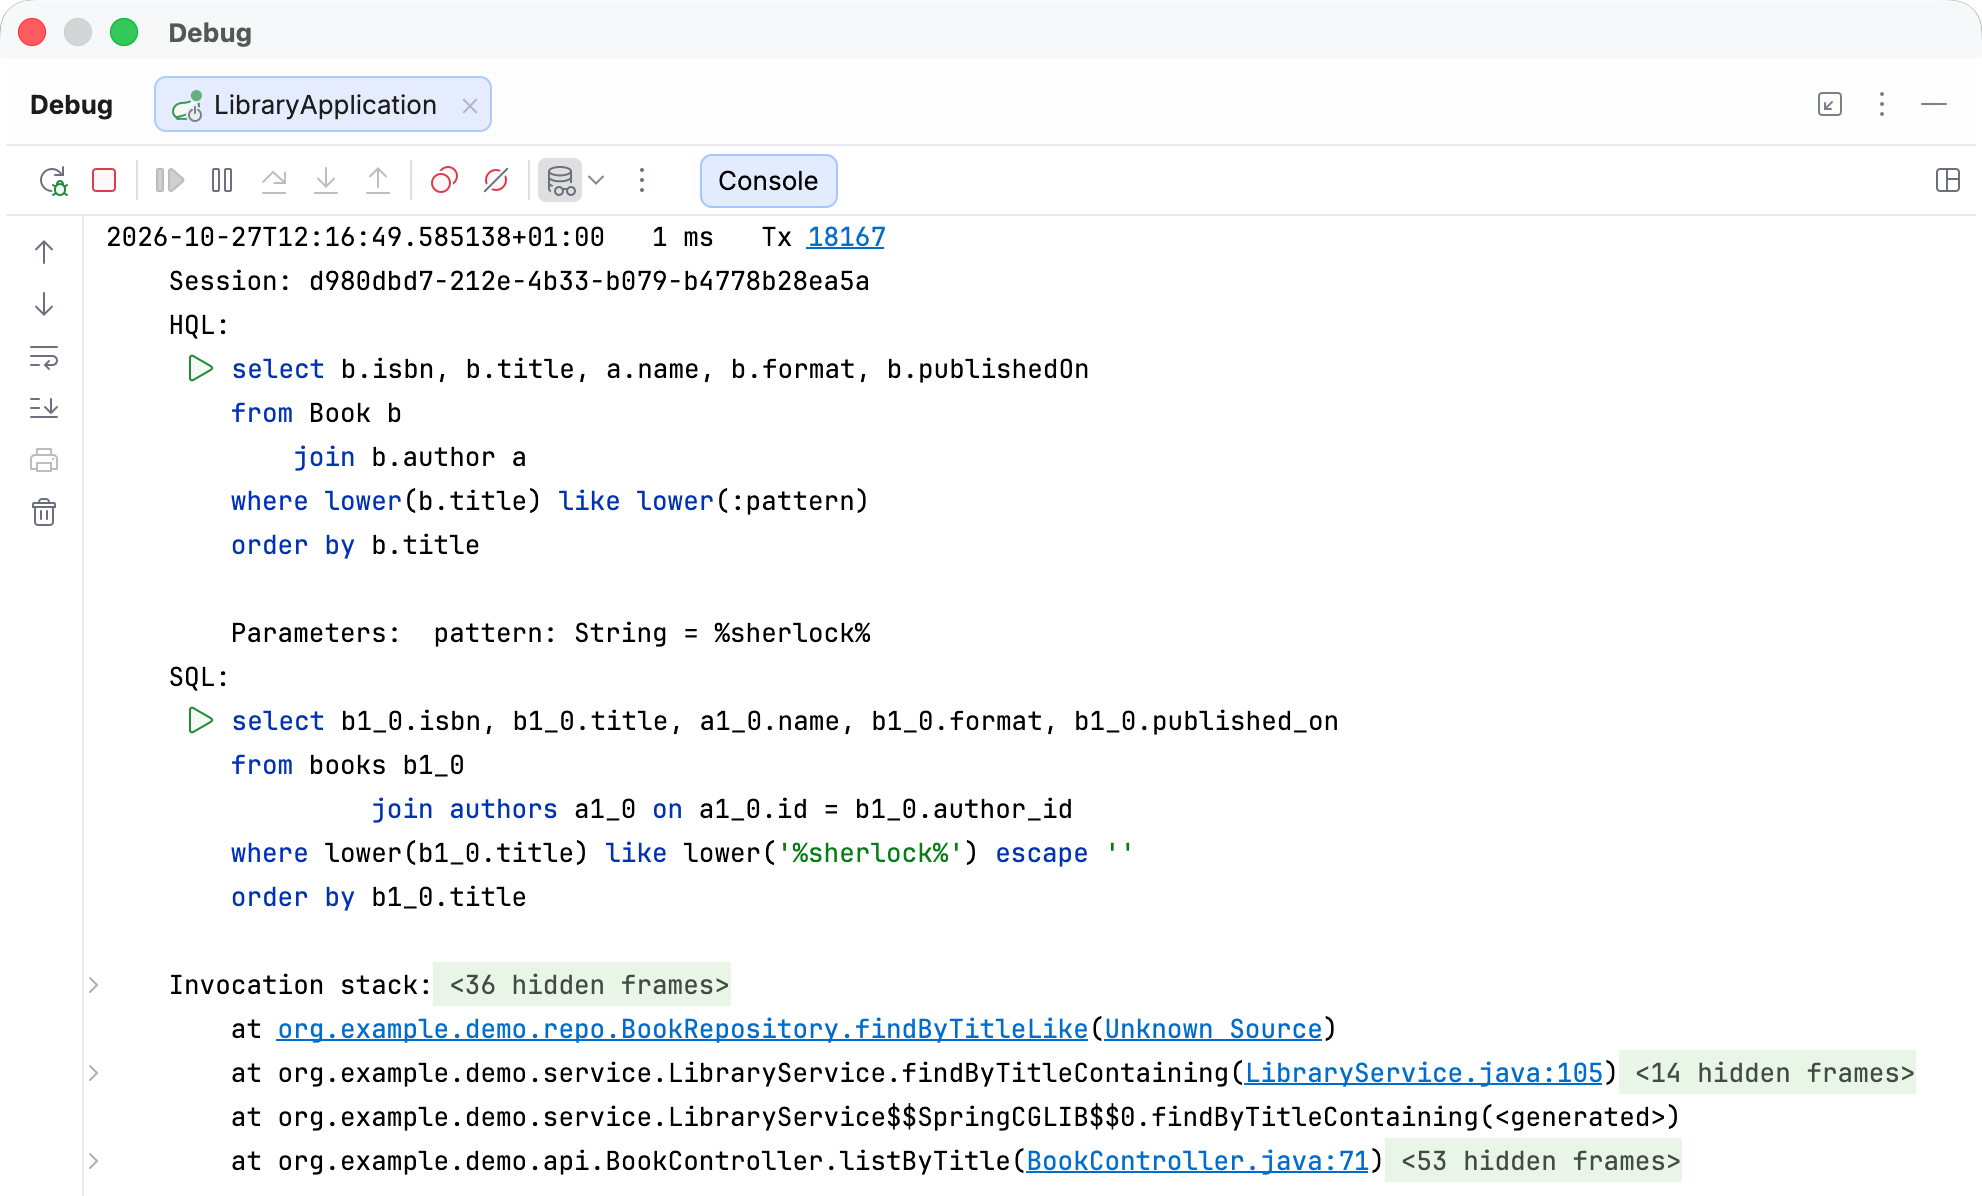
You can use Hibernate Debugger to perform the following debugging tasks:
Check what HQL statements a particular operation triggers and what SQL Hibernate sends to the database as a result.
Find slow queries and potential N+1 problems.
Locate the code that triggered a particular query.
Rerun captured HQL and SQL in the IDE.
Explore the databases your application connects to.
Prerequisites
The following plugins are installed and enabled:
Jakarta EE: Persistence (JPA) (bundled)
Database Tools and SQL (bundled)
To check if the plugins are enabled, open Settings (Ctrl+Alt+S) and go to Plugins.
Your build file (pom.xml or build.gradle) includes Hibernate 6 or later. Common ways to add it include:
 Spring Boot starter:
spring-boot-starter-data-jpafrom Spring Boot version 3.0 or laterDirect dependency:
hibernate-coreversion 6 or later
Log and inspect database queries
Hibernate Debugger works inside the IntelliJ IDEA debugger. Whenever your application runs a query through Hibernate during a debugging session, the plugin logs information about it in the debugger console. The log shows the executed SQL and any related HQL, along with runtime details such as the execution time, transaction ID, and the code that triggered the query.
Query logging is on by default.
Inspect a query with Hibernate Debugger
In your application, perform an action that interacts with a database.
Go to the Debug tool window and open the Console tab.
Find the Hibernate Debugger log entries for the action you performed. Each entry is collapsed into a single highlighted line and shows the executed SQL statement.
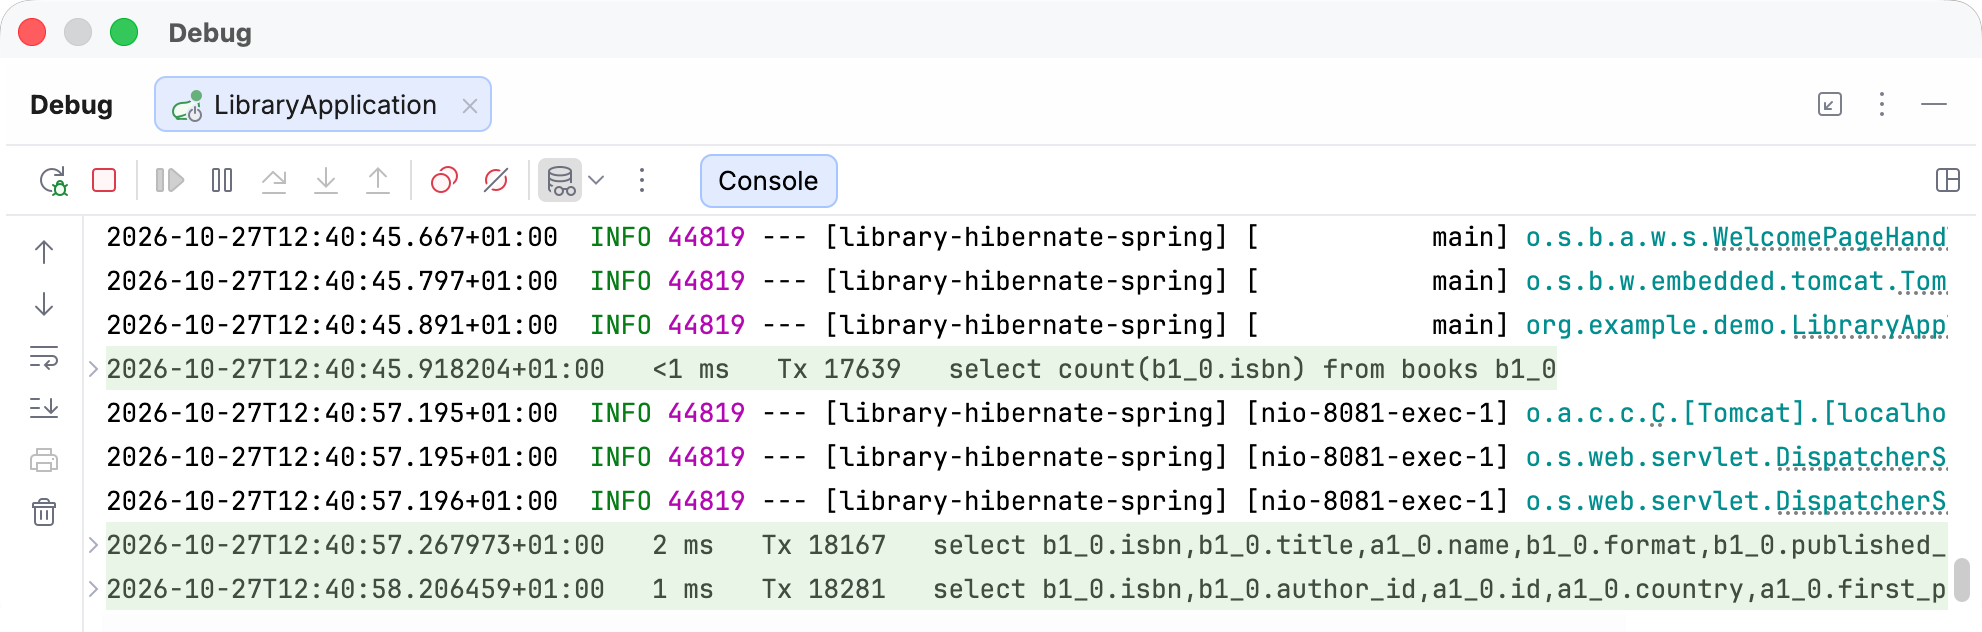
Click a highlighted line to open the log entry.
To learn how to interpret log entries, refer to Reference: Hibernate Debugger log entries.
Filter logged queries
While the debugging session is running, go to the Debug tool window and open the Console tab.
In the debugger toolbar, click
 SQL Log Settings and Filters.
Select one or more filters:
Show only suspected N+1 queries: display only the queries from transactions that are suspected to have an N+1 problem. You can then trace their origin in code.
Filter by duration: specify the minimum duration in milliseconds to display only the queries that took this amount of time or longer to execute.
Filter by transaction: specify the transaction ID to display only the queries that were executed in this transaction.
If you select several filters, only the log entries that match all of them are displayed. The filters apply to the current debugging session and are cleared when you close the session tab.
Identify N+1 queries and trace their origin in code
The N+1 query problem is a common performance issue in applications that use object-relational mapping (ORM) frameworks. It occurs when an application runs one query to fetch a list of records and then a separate query to fetch related data for each record.
Hibernate Debugger detects transactions with potential N+1 queries and lets you filter out queries from other transactions.
Start a debugging session.
In your application, invoke the actions that you want to check for N+1 queries.
Go to the Debug tool window and open the Console tab.
In the debugger toolbar, click
SQL Log Settings and Filters and select Show only suspected N+1 queries.Look for highlighted lines that share the same transaction ID and SQL query.
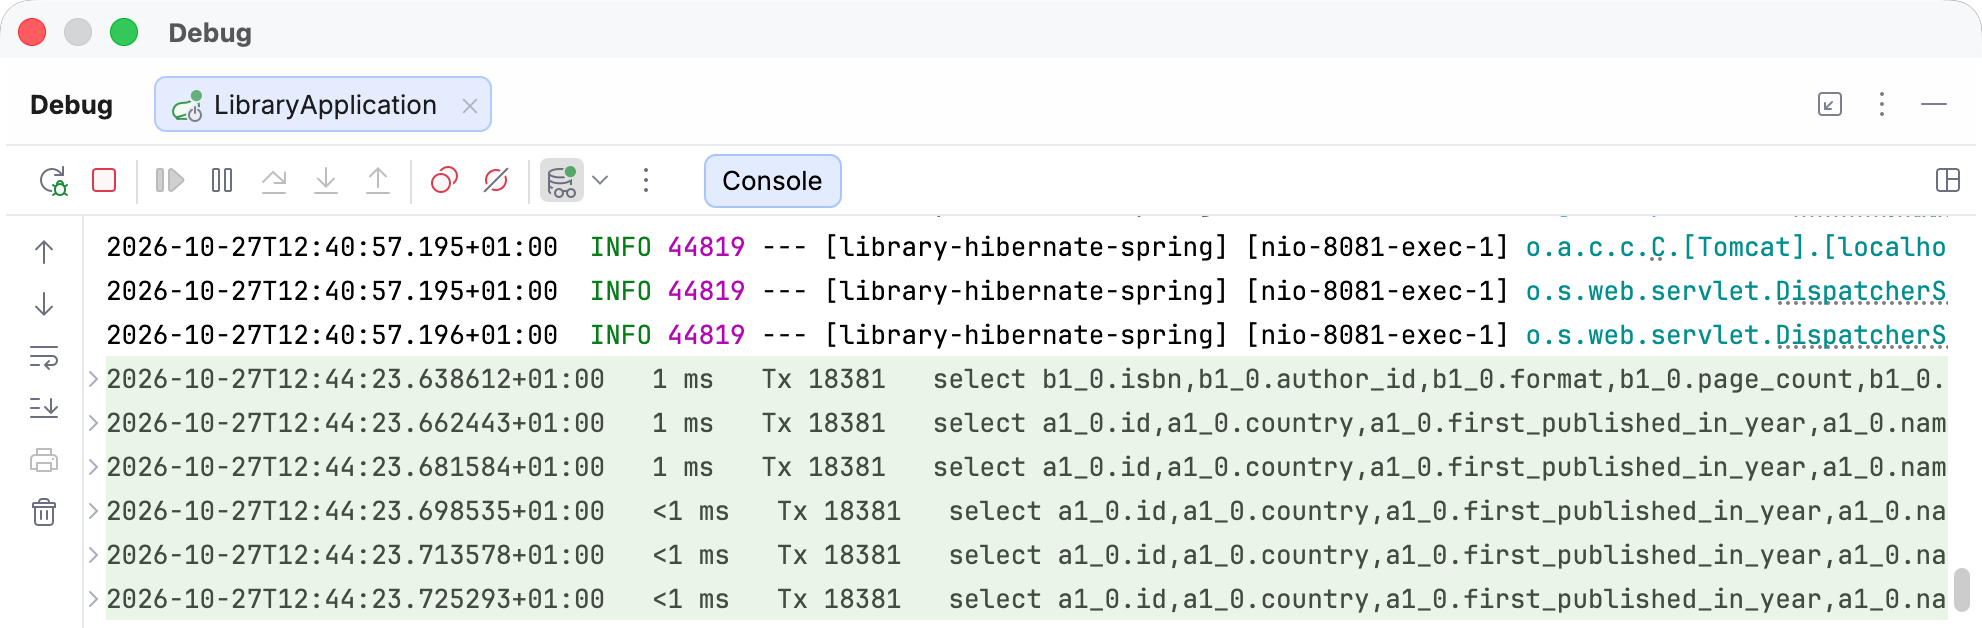
Click one of the highlighted lines to open its log entry and then expand its Invocation stack section. It contains the sequence of method calls that led to the repeated query's execution.
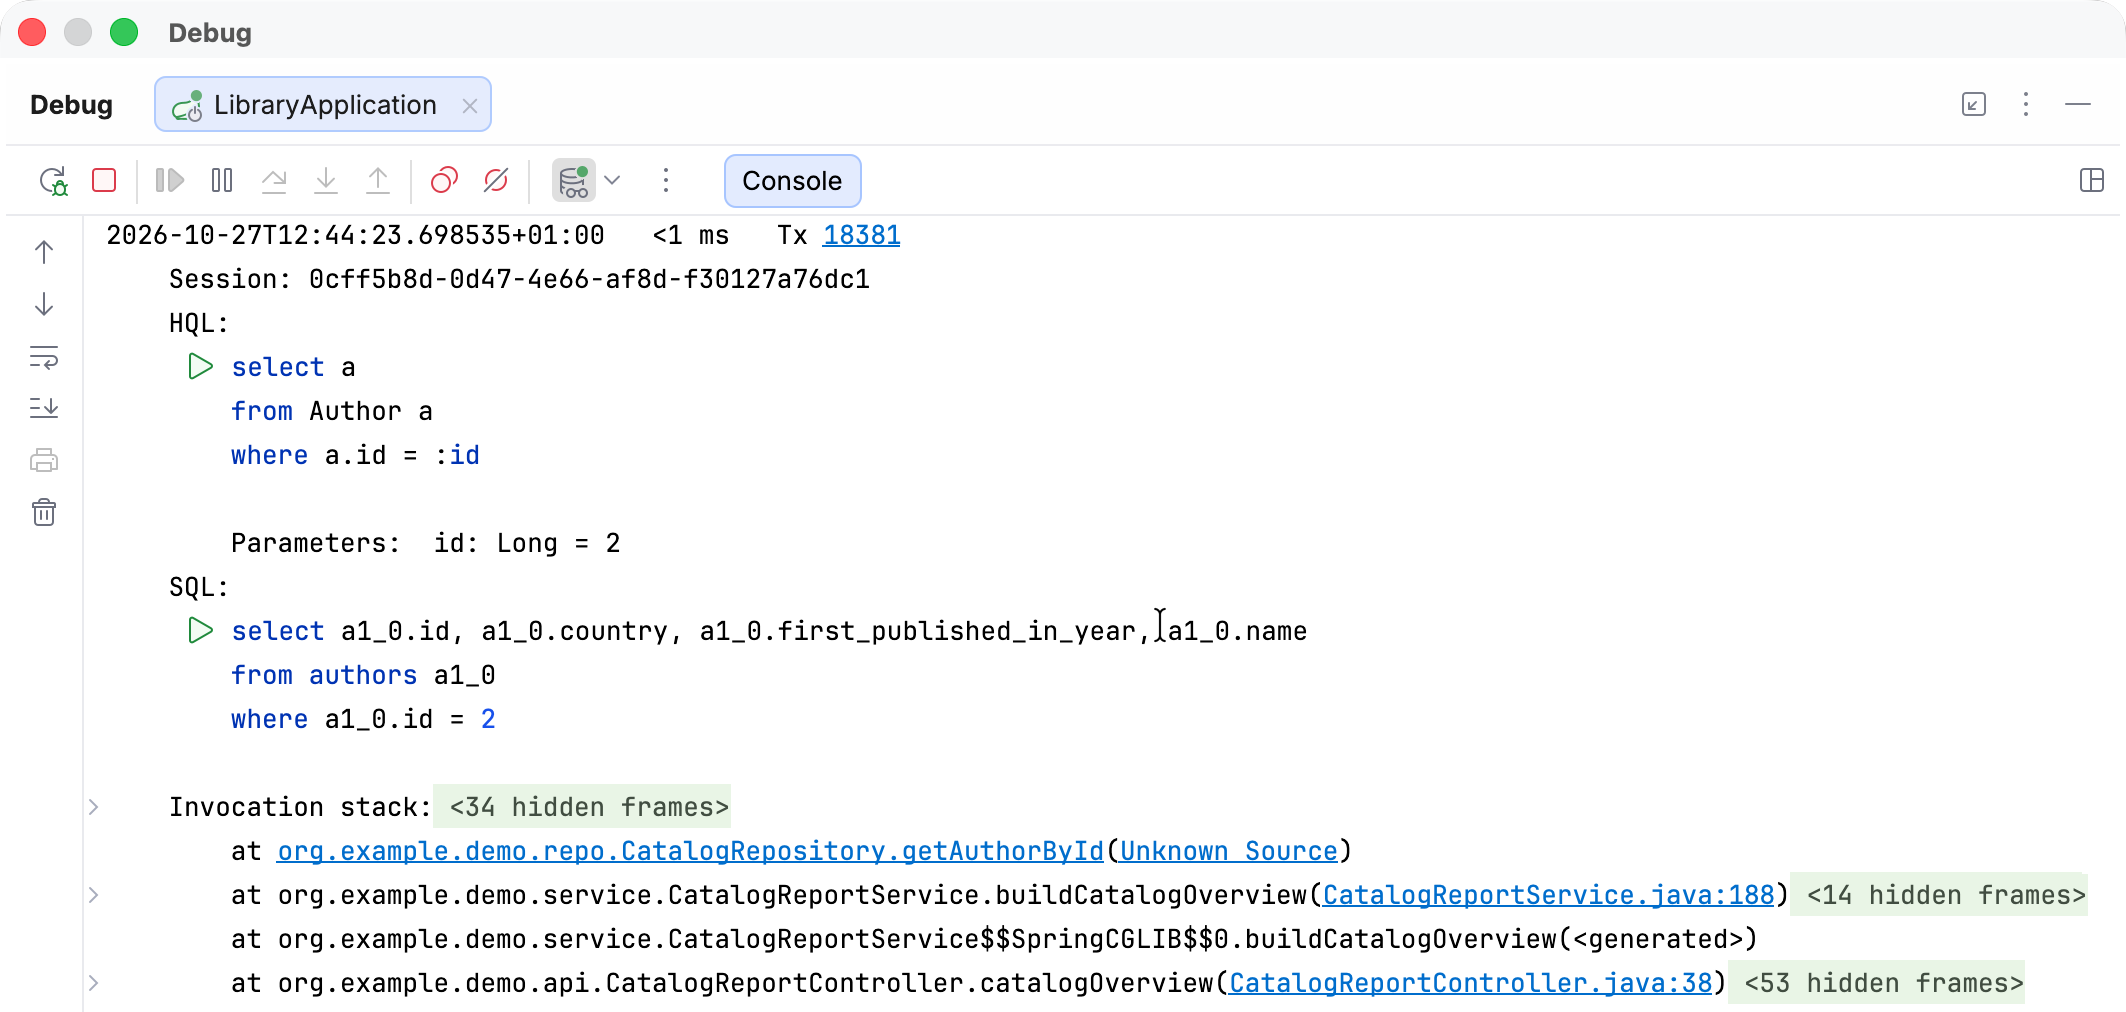
Locate the top stack line that ends with a file name and line number from your project code (not library or framework-generated code) and click them.
IntelliJ IDEA opens the file at the line where your code triggered the query. Examine the method, its surrounding code, and the methods that call it to find out why the query runs repeatedly.
Stop logging queries
While the debugging session is running, go to the Debug tool window.
In the debugger toolbar, click
SQL Log Settings and Filters and clear the Log database queries option. 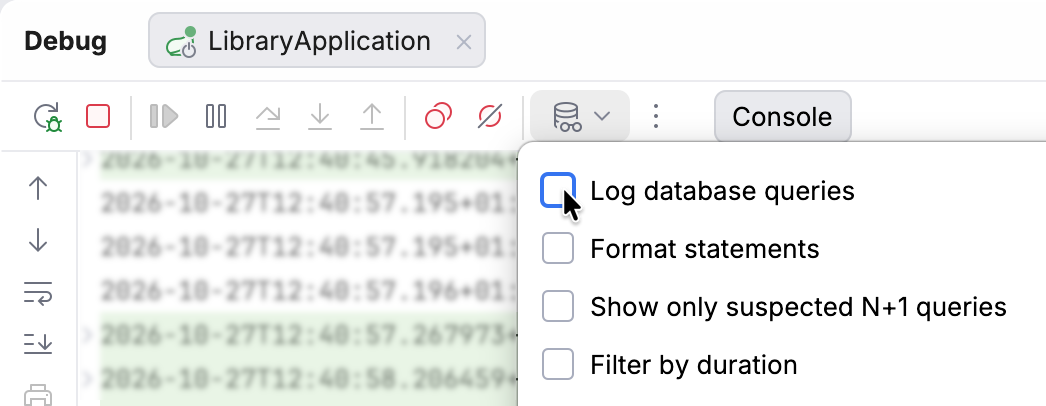
Turning off query logging applies to all debugging sessions in the project. You can turn it back on at any time by selecting Log database queries again.
Rerun captured queries
You can rerun queries captured by Hibernate Debugger without having to trigger them again in your application. HQL statements are rerun in the JPA Console and SQL statements in a query console.
Rerun an HQL query
Rerunning HQL can be useful when, for example, you want to check which records a query fetches, compare its results before and after your application commits changes to the database, or run it separately from other queries in a sequence.
Open the Hibernate Debugger log entry for the query you want to rerun.
Click
 Execute query next to the HQL. If some parameter values cannot be restored, you will be prompted to specify them.
The JPA Console executes the query and displays its results.
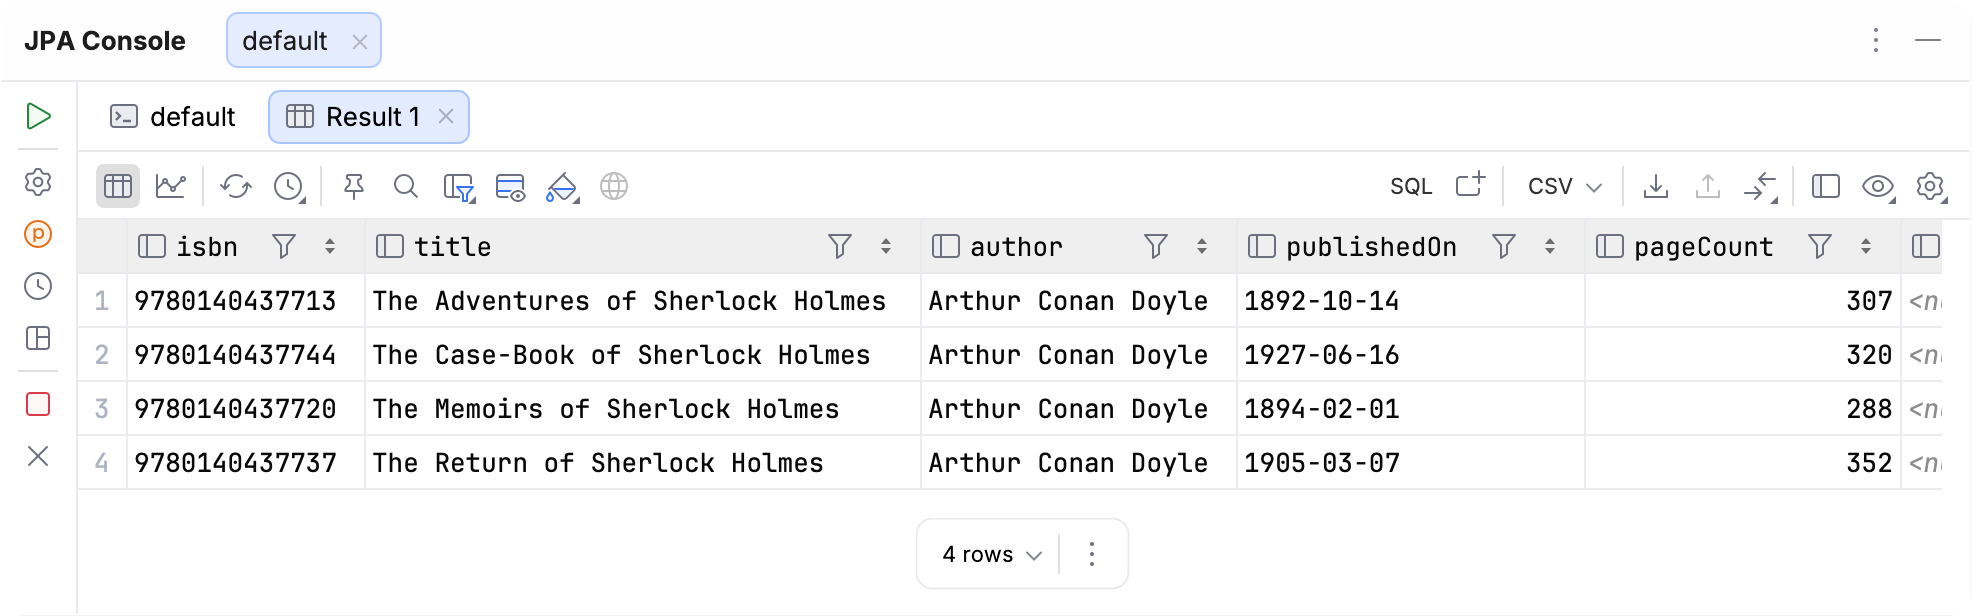
(Optional) Rerun the query with different parameter values:
Switch from the result tab to the console tab.
In the query toolbar, click
 View Parameters. This opens a pane with parameter values on the right side of the console.
Edit the parameter values and rerun the query by pressing Ctrl+Enter.
Rerun an SQL query
Rerunning SQL can be useful when, for example, you want to check which records Hibernate fetches during lazy loading or how long a slow query takes when it runs directly against the database.
Open the Hibernate Debugger log entry for the query you want to rerun.
Click
Execute query next to the SQL. A database-specific query console executes the query and the Services tool window displays its results.
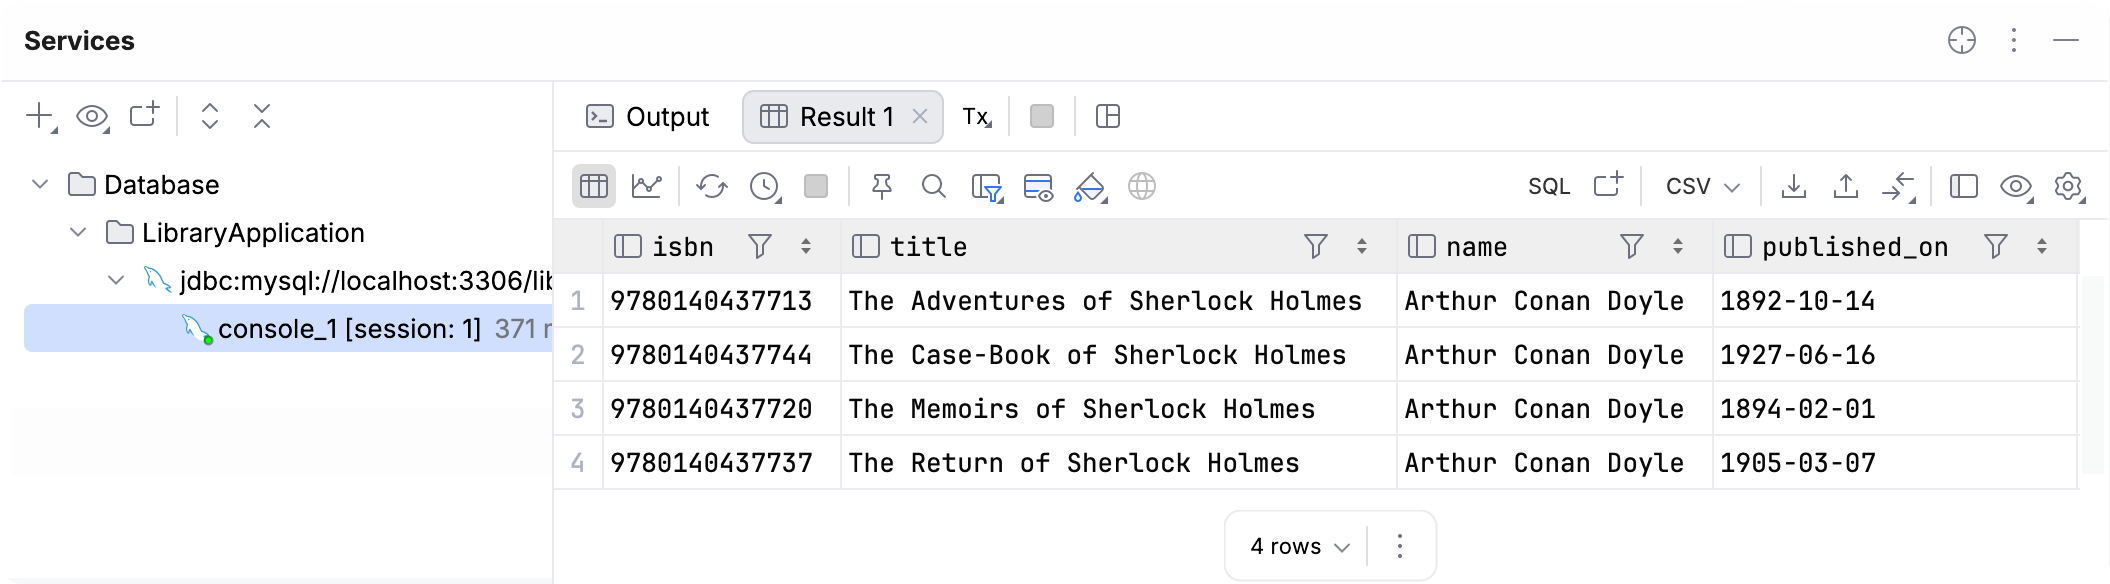
(Optional) Rerun the query with different parameter values:
In the editor, go to the query console tab that IntelliJ IDEA opened. The SQL query is already there with its original parameter values.
Edit the parameter values and rerun the query by pressing Ctrl+Enter.
Access the database while debugging
When a query result does not match what you expect, the cause may not be in the code, but in the data. To help you examine both, Hibernate Debugger adds database connections from your debugging session to the Database tool window.
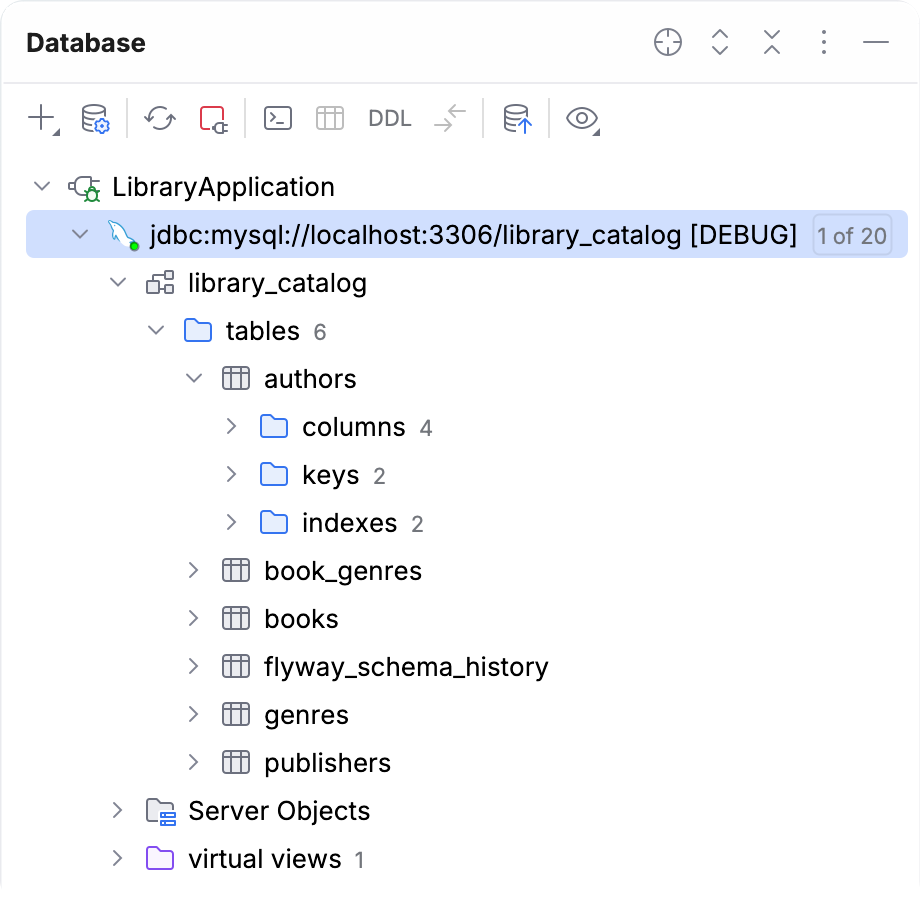
Here are a few examples of how you can work with the data sources from your debugging session in IntelliJ IDEA:
Look up, add, edit, or delete database records in the data editor and viewer.
Execute queries against your database in a query console or the JPA Console.
Create entity classes for existing tables by reverse engineering the database.
Bring the database schema in line with your entity classes by generating Flyway migrations or Liquibase changelogs.
Data sources created by Hibernate Debugger are removed when the debugging session ends. To keep a data source permanently, create a copy of it while the session is still running.
Keep a data source after the debugging session ends
While the debugging session is running, go to the Database tool window.
Find the folder named after your debugging session and select the data source you want to keep.
Right-click the data source and select Copy/Paste |
 Duplicate.
Alternatively, press Ctrl+D.
The Data Sources and Drivers dialog opens. If needed, rename the data source or adjust its connection details.
Click OK to save the copy.
The copied data source is placed in the same folder as the original. To prevent the copy from being removed, right-click it and select .
Reference: Hibernate Debugger log entries
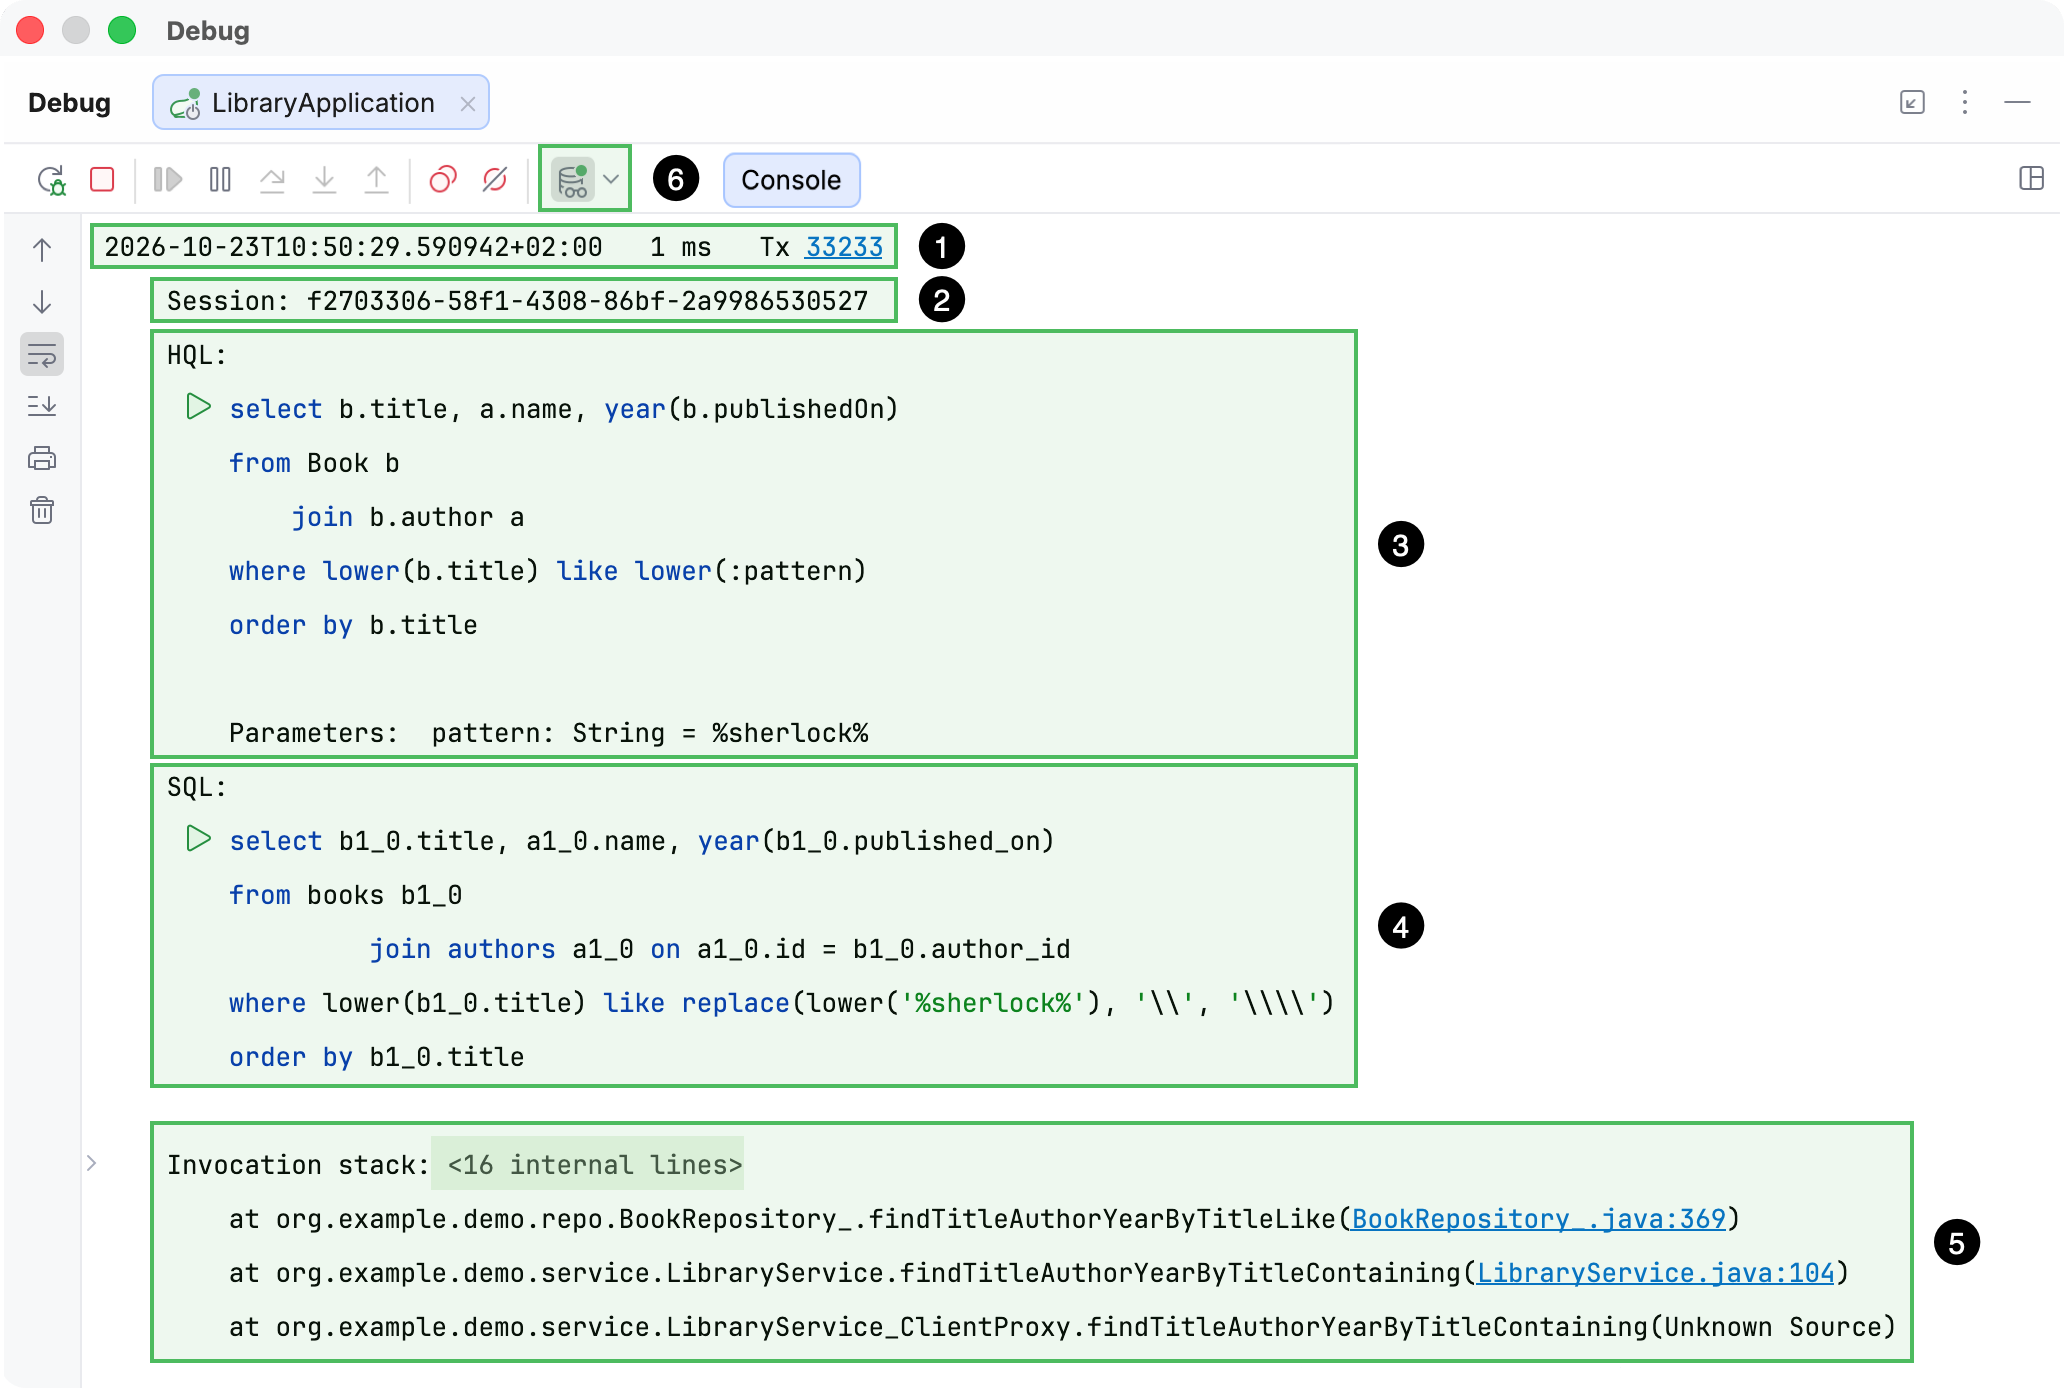
A Hibernate Debugger log entry includes the following sections:
The plugin also adds a toolbar icon (6) to the debugger, SQL Log Settings and Filters, which lets you filter log entries and change how they are displayed.
Header
The log entry header includes the following information:
Timestamp when Hibernate Debugger captured the query. It uses the local time in the ISO 8601 format with the UTC offset.
Time that it took to execute the query.
ID of the Hibernate transaction in which the query was executed. This value is assigned by the debugger. A dash means that Hibernate Debugger could not find out which transaction the query belongs to.
You can filter the log entries to only display queries from this transaction by clicking the ID and selecting Filter by this transaction.
Session ID
This ID identifies the Hibernate session that sent the query to the database. It is assigned by Hibernate.
A dash means that Hibernate Debugger could not find out which session sent the query.
HQL statement
This is the query that your application handed to Hibernate and that Hibernate turned into the SQL statement below. In your code, the query can come from a repository method, a query string (HQL, JPQL, JDQL), or the Jakarta Persistence Criteria API, but here it is always displayed as an HQL statement.
If the HQL contains parameters, their values are listed on a separate line in one of the following formats:
name: Type = value: named parameter?1: Type = value: positional parameter__param_0: Type = value: generated parameter (for example, derived from a repository method name)?unknown: Type = value: parameter whose name could not be determinedname: <unbound>: parameter that had no value when the HQL was executed
The Execute query icon lets you rerun the HQL statement in the JPA Console with the same parameter values. If the icon has an error indicator ( ), it means that some parameter values cannot be passed to the console. In this case, the console will prompt you to enter the missing values before rerunning the HQL.
SQL statement
This is the SQL statement that Hibernate sent to the database. It can be translated by Hibernate from the HQL above it, generated by Hibernate on its own, or written in your code as a native SQL query.
If the statement contains parameters, their values are displayed within the statement.
The Execute query icon lets you rerun the SQL statement in a query console with the same parameter values.
Invocation stack
The invocation stack shows the method calls that led to Hibernate sending the SQL statement to the database. Like in any Java stack trace, the most recent call is at the top. Calls in library code (such as Hibernate or Spring) are collapsed by default.
Each line in the invocation stack represents one method call. For example, consider this simplified stack:
The highlighted line represents a call to searchBooks(). The example stack provides the following details about it:
searchBooks()was called byBookController.listBooks().It is declared in the
BookServiceclass, which belongs to thecom.example.librarypackage.It is implemented in the
BookService.javasource file.At line 24 of that file, it called
BookRepository.findByTitle().
Most stack lines end with a file name and line number that show where this method called the next one. You can click them to navigate to that call in the editor. If a line ends with Unknown Source or <generated> instead, the call was usually made from code that a framework generated directly in compiled form, so there is no source file for it.
Example from a Spring Data JPA application
In this example, the call sequence is as follows (read from the bottom up):
A chain of calls in library code (collapsed into
<53 hidden frames>) resulted in a call toBookController.listBooks()in the project code.BookController.listBooks()calledBookService.searchBooks().The call went to
BookService$$SpringCGLIB$$0. This is a proxy generated by Spring at runtime, so<generated>is displayed instead of the file name.The proxy started a chain of calls in Spring library code (collapsed into
<14 hidden frames>) that resulted in a call toBookService.searchBooks().
BookService.searchBooks()calledBookRepository.findByTitle().The call went to the method's implementation provided by Spring Data. This implementation was generated at runtime, so
Unknown Sourceis displayed instead of the file name.The implementation of
findByTitle()started a chain of calls in Spring and Hibernate library code (collapsed into<36 hidden frames>) that resulted in Hibernate sending the SQL statement to the database.
Settings and filters
Item | Description |
|---|---|
Log database queries | Turn query logging on or off. For more information, refer to Stop logging queries. |
Format statements | Change how statements are displayed in the debugger console:
|
Show only suspected N+1 queries | Display only the queries from transactions that are suspected to have an N+1 problem, meaning that the same query is executed repeatedly. For more information, refer to Identify N+1 queries and trace their origin in code. |
Filter by duration | Specify the minimum duration in milliseconds to display only the queries that took this amount of time or longer to execute. |
Filter by transaction | Specify the transaction ID to display only the queries that were executed in this transaction. |