# Analyze data flow
When working with large codebases, it is sometimes difficult to figure out how data is processed and how the workflows could be improved to make the code more performant and readable. To facilitate this, IntelliJ IDEA dataflow analysis enables you to trace all the possible data transformations without running the program. The information can be used to improve the design of the app and diagnose bugs before they manifest themselves.
Data flow analysis provides the information on:
* What happens to the data downstream of a method or expression: what are the consumers and what possible values can be produced.
* All the possible input values a method can have and where particular values are coming from.
* Whether a variable can possibly be `null`. Using this information, you can prevent unexpected NullPointerExceptions and optimize your workflows by removing redundant null checks and `@Nullable` annotations.
Procedure: View analysis results
1. Place the caret at an identifier that represents the data you want to analyze. You can choose to analyze the symbol at a declaration, in a statement, in the parameters of a method, and so on.

2. In the main menu, go to `Code | Analyze Code | Data Flow to Here` to analyze data upstream (producers) or `Code | Analyze Code | Data Flow from Here` to analyze data downstream (consumers).
3. Specify the scope of the analysis. If you want to exclude tests, clear the Include test sources checkbox.
Also, if you are interested in a particular value or expression result, you can specify it in the Filter field to only show the relevant results (available in Dataflow to here).
| Filter examples |
| --- |
| null/non-null values | `null` `!null` |
| String | `"Hello"` |
| enum | `SPRING` `SUMMER` `FALL` `WINTER` |
| boolean | `true` `false` |
| int/long | `0` `>0` `<=100` `!=9` |
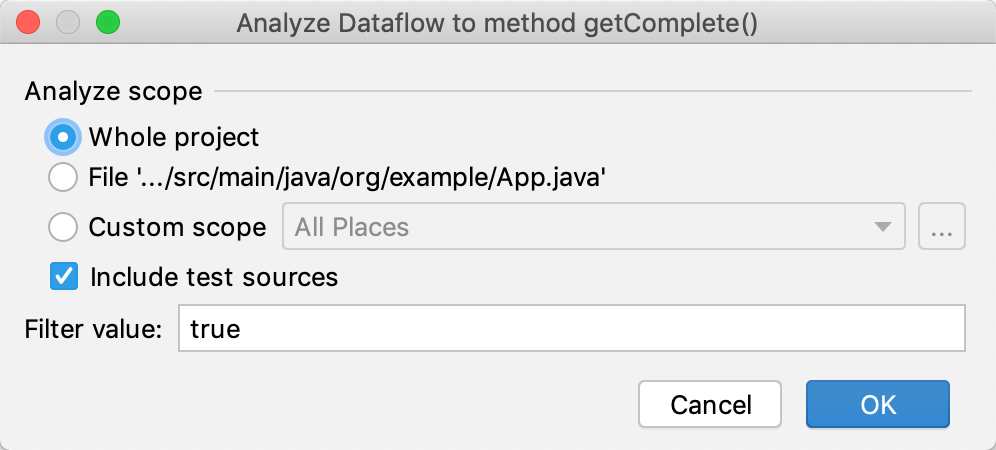
A tool window opens containing the results of the analysis. They are organized in nodes, each representing a data flow step.
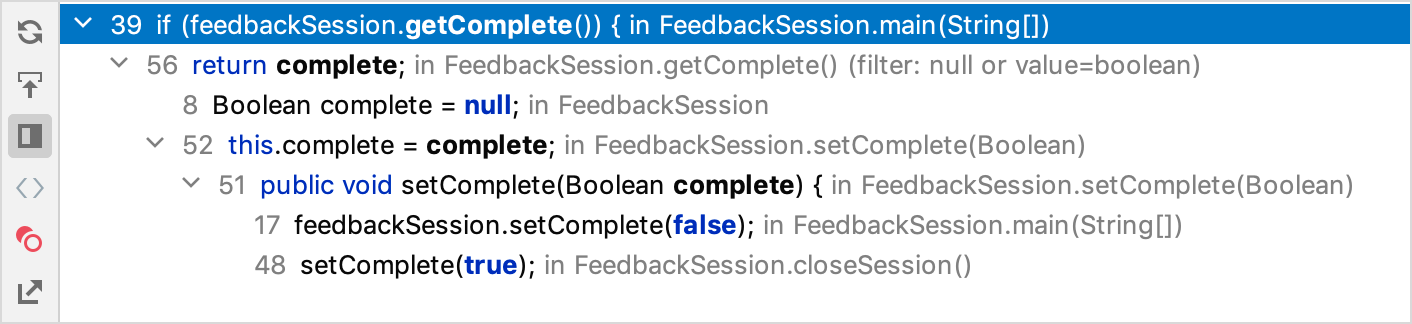
In the example:
* The `getComplete()` method returns the value of the `complete` variable.
* The `complete` variable can be assigned `null` during initialization or get any value in the `setComplete` method.
* The `setComplete()` method is called at lines 17 and 48 and assign the values `false` and `true` respectively.
> **Tip:**
> Double-clicking an entry takes you to the corresponding fragment in the code. Also, you can do this with a single click (the Navigate with single click button) or preview the code in a separate tab (the Preview usages button).
Procedure: Refresh results
* If the code has changed, and you want to analyze the same expression again, click Refresh in the Analyze tool window.
Procedure: Analyze possible values
When viewing Data flow to here, you can group the nodes by value to get the summary on the possible values or analyze their origin.
* To get the information about specific values, click Group by leaf expression in the left part of the Analyze tool window.
* To get the information about null/non-null values, click Group by leaf expression nullness in the left part of the Analyze tool window.
Procedure: Export to file
If you want to share the results of the analysis in text format, use the Export option.
1. Select the analysis tab you want to export.
2. Click Export to text file  in the left part of the Analyze tool window.
3. If you want to copy the results to clipboard, click Copy. To export the results to a file, select the file in the Export to file field and click Save.
## Analyze stack traces
When your program crashes with an exception, you can use the stack trace as the input for data flow analysis. This helps you track where inappropriate values may come from.
```JAVA
public class ArrayTest {
static int[] ints = new int[5];
public static void main(String[] args) {
ArrayTest arrayTest = new ArrayTest();
int a = arrayTest.getRandomElement(ints);
System.out.println(a);
}
private int getRandomElement(int[] array) {
int index = new java.util.Random().nextInt(20);
return array[index];
}
}
```
The code above creates a fixed-size array and tries to access a random element from it. Sometimes it throws an `ArrayOutOfBoundsException` because the index may be greater than the length of the array.
Procedure:
1. In the stack trace, click the source reference of the frame that threw the exception.
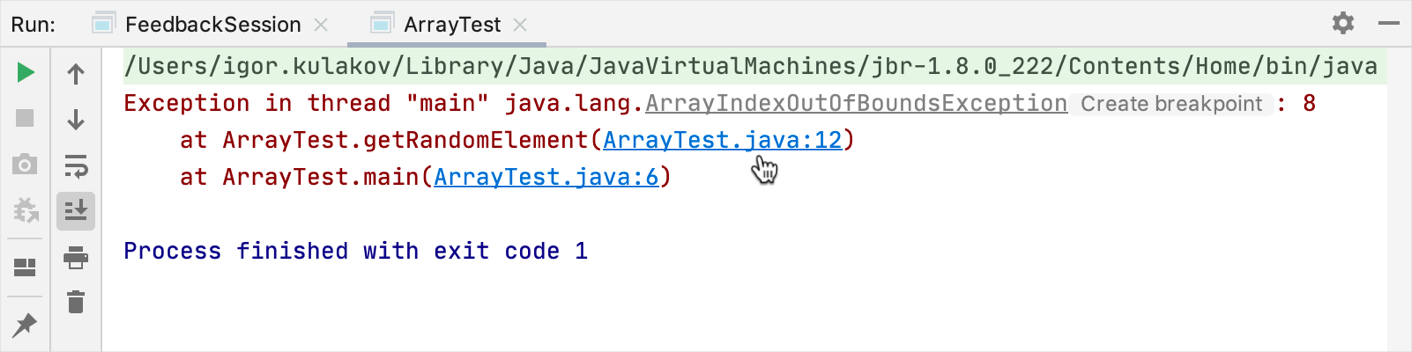
The editor takes you to the corresponding line in the source.
2. Click the popup to find the source of the value that caused the exception.

Dataflow to here opens with the filters applied.