# Analyze external stack traces
You might want to analyze exceptions received by someone else to investigate a problem, such as a deadlock or unresponsive UI.
With IntelliJ IDEA, you can unscramble and view an exception stack trace or a [full thread dump](thread-dumps.html). While viewing, you can use them to navigate to the source code as if they were coming from the Run or Debug tool window.
Procedure: Install the ZKM-Unscramble plugin
This functionality relies on the plugin, which you need to install and enable.
> **Note:**
> The ZKM-Unscramble plugin is not available in IntelliJ IDEA without the Ultimate subscription.
1. Press `Ctrl+Alt+S` (Windows), `⌘ Comma` (macOS), `⌘ Comma` (IntelliJ IDEA Classic (macOS)), `⌘ Comma` (macOS System Shortcuts), `Ctrl+Alt+S` (XWin), `Ctrl+Alt+S` (GNOME), `Ctrl+Alt+S` (KDE), `Ctrl+Alt+S` (Emacs), `Ctrl+Alt+S` (Sublime Text), `⌘ Comma` (Sublime Text (macOS)), `Ctrl+Alt+S` (NetBeans), `Ctrl+Alt+S` (Visual Studio), `⌘ Comma` (Visual Studio (macOS)), `Ctrl+Alt+S` (Eclipse), `⌘ Comma` (Eclipse (macOS)) to open settings and then select `Plugins`.
2. Open the Marketplace tab, find the ZKM-Unscramble plugin, and click Install (restart the IDE if prompted).
Procedure:
1. In the main menu, go to `Code | Analyze Stack Trace or Thread Dump`.
2. In the Analyze Stack Trace dialog that opens, paste the external stack trace or thread dump into the Put a stack trace or a complete thread dump here: text area.
3. Specify whether you want to have the stack trace unscrambled.
To do that, select the Unscramble stack trace checkbox, select the desired unscrambler and log file.
4. If the stack trace text is corrupted (lines are cut or wrapped, or too long, and so on) after processing with some software (for example, a bug tracker or a mail client), click Normalize.
5. If you want to explicitly specify the directory with the corresponding dSYM files, select the Use additional directory to search for missing dSYMs checkbox and enter the desired directory in the field or choose it from the file system.
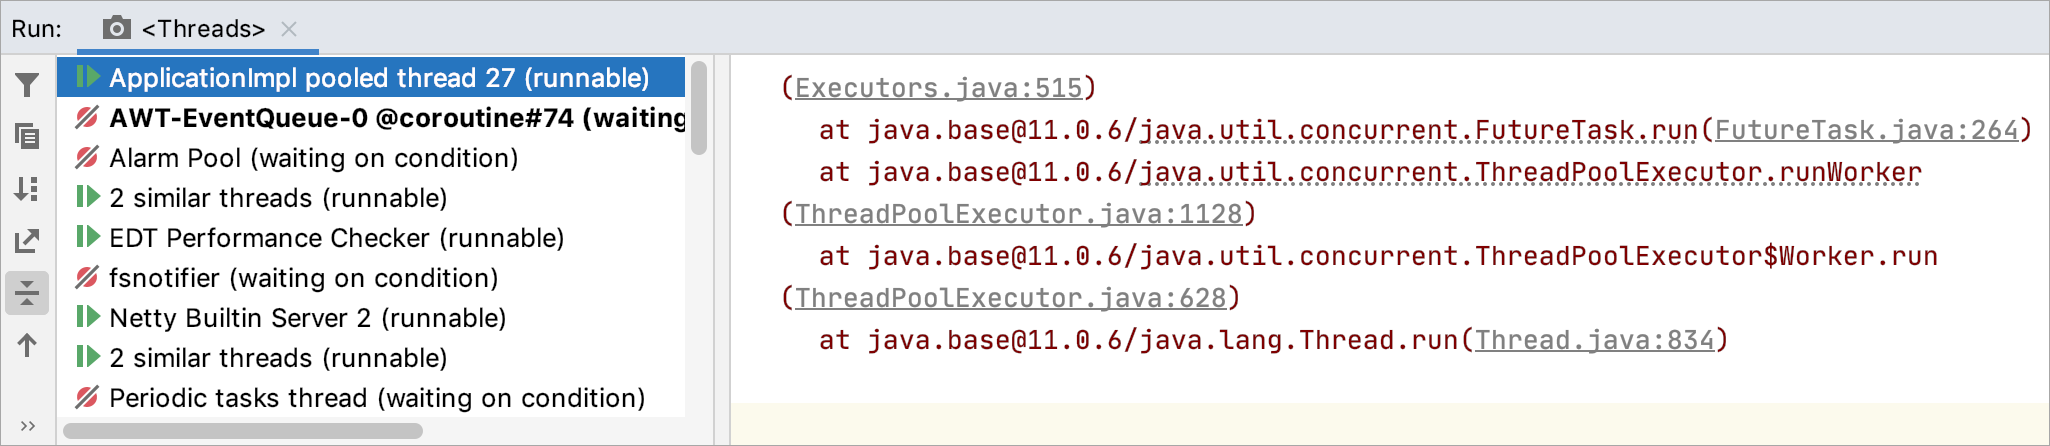
6. Click OK. The stack trace is displayed in the [Run](run-tool-window.html) tool window.
To jump to the code that caused the problem, scroll to the stack trace line you need and click the link to the source file. The file opens in the editor.
> **Tip:**
> In case of thread dump, IntelliJ IDEA will present all threads in a readable way and sort them to show first those most probably responsible for the deadlock or hang-problem.
The icons near thread names indicate the thread's state:
| Icon | Description |
| --- | --- |
|  | Running/active – the default state, in which a thread is actively executing code |
|  | (for Kotlin coroutines) Running – a coroutine is actively executing code |
|  | Sleeping – occurs when a thread is in `Thread.sleep`, or when it is parking or waiting on a condition |
|  | Carrier thread – a platform thread that is currently executing a virtual thread, or a coroutine in the [created/unknown](thread-dumps.html#kotlin_coroutines) state |
|  | Waiting – occurs when a thread is waiting on an object monitor, or a coroutine is suspended |
|  | Socket – occurs when a thread is performing network I/O |
|  | I/O – occurs when a thread is performing a non-network I/O operation |
|  ,  | EDT (Event Dispatch Thread) – the UI thread in Swing applications.  is for idle EDT, and  is for active. |
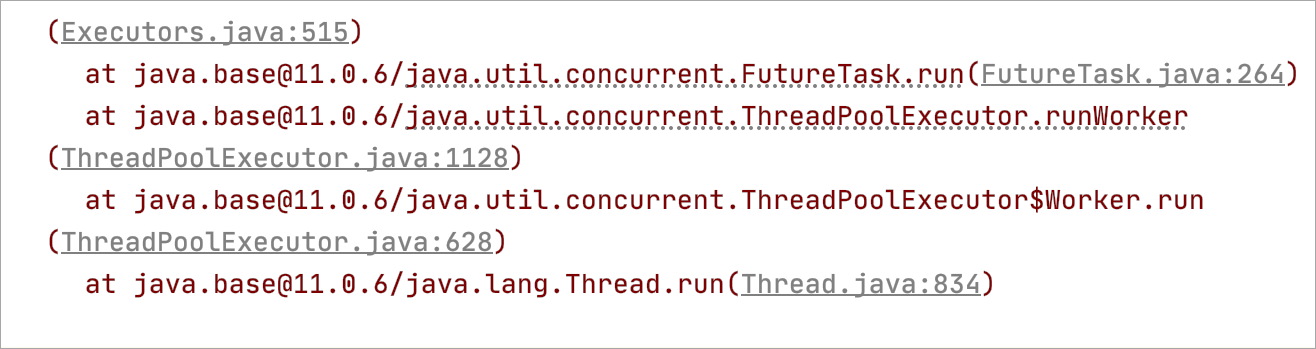
Some calls in the Run tool window have a dotted underline. These calls occur inside a `try` block and can throw a checked exception.
## Analyze Stack Trace dialog
Use this dialog to reach a navigable console stack trace for external applications. From each message in this stack trace, you can navigate right to the source code that cased the reported problem.
| Item | Description |
| --- | --- |
| Unscramble stack trace | Select this checkbox to unscramble the external stack trace, if your source code is scrambled. |
| Unscrambler | Here you can select the unscrambler tool. IntelliJ IDEA ships with the Zelix Klass Master unscrambler plugin. You can develop your own plugin to unscramble stack trace of the code being processed with any other obfuscator. |
| Log file | Specify the location of the unscrambler log file. |
| Put a stack trace or a complete thread dump here | Paste here the external stack trace or thread dump. |
| Automatically detect and analyze thread dumps copied to the clipboard outside of IntelliJ IDEA | If this checkbox is selected, IntelliJ IDEA will monitor and analyze the contents of the clipboard. You can select this checkbox only once, and your clipboard will be scanned every time you switch to IntelliJ IDEA. As soon as something looking like a stack trace gets copied to the clipboard, IntelliJ IDEA will show this stack trace in the corresponding tool window. |
| Highlight files changed in last days | Select this checkbox to specify the time period in which you want to check last changes in stack traces. The default time period is set to 31 days. |
| Normalize | If the stack trace text is corrupted (lines are cut or wrapped, or too long, and so on) after processing with some software (for example, bug tracker or mail client), click this button to restore the normal stack trace structure. |
## See also
### Reference
[Run tool window](run-tool-window.html)