# Code coverage
> **TL;DR**
> Manage suites: `Run | Manage Coverage Reports` `Ctrl+Alt+F6` (Windows), `⌘ ⌥ F6` (macOS), `⌘ ⌥ F6` (IntelliJ IDEA Classic (macOS)), `⌘ ⌥ F6` (macOS System Shortcuts), `Ctrl+Alt+6` (XWin), `Ctrl+Alt+6` (GNOME), `Ctrl+Alt+6` (KDE), `Ctrl+Alt+F6` (Emacs), `Ctrl+Alt+F6` (Sublime Text), `⌘ ⌥ F6` (Sublime Text (macOS)), `Ctrl+Alt+F6` (NetBeans), `Ctrl+Alt+F6` (Visual Studio), `⌘ ⌥ F6` (Visual Studio (macOS)), `Ctrl+Alt+F6` (Eclipse), `⌘ ⌥ F6` (Eclipse (macOS))
>
>
>
> Coverage settings: `Settings `Ctrl+Alt+S` (Windows), `⌘ Comma` (macOS), `⌘ Comma` (IntelliJ IDEA Classic (macOS)), `⌘ Comma` (macOS System Shortcuts), `Ctrl+Alt+S` (XWin), `Ctrl+Alt+S` (GNOME), `Ctrl+Alt+S` (KDE), `Ctrl+Alt+S` (Emacs), `Ctrl+Alt+S` (Sublime Text), `⌘ Comma` (Sublime Text (macOS)), `Ctrl+Alt+S` (NetBeans), `Ctrl+Alt+S` (Visual Studio), `⌘ Comma` (Visual Studio (macOS)), `Ctrl+Alt+S` (Eclipse), `⌘ Comma` (Eclipse (macOS)) | Build, Execution, Deployment | Coverage`
Code coverage in IntelliJ IDEA lets you analyze which lines of code were executed during a particular run. It helps determine the share of code covered by tests and identify areas that lack sufficient test coverage.
Procedure: Enable the Code Coverage for Java plugin
This functionality relies on the Code Coverage for Java plugin, which is bundled and enabled in IntelliJ IDEA by default. If the relevant features are not available, make sure that you did not disable the plugin.
1. Press `Ctrl+Alt+S` (Windows), `⌘ Comma` (macOS), `⌘ Comma` (IntelliJ IDEA Classic (macOS)), `⌘ Comma` (macOS System Shortcuts), `Ctrl+Alt+S` (XWin), `Ctrl+Alt+S` (GNOME), `Ctrl+Alt+S` (KDE), `Ctrl+Alt+S` (Emacs), `Ctrl+Alt+S` (Sublime Text), `⌘ Comma` (Sublime Text (macOS)), `Ctrl+Alt+S` (NetBeans), `Ctrl+Alt+S` (Visual Studio), `⌘ Comma` (Visual Studio (macOS)), `Ctrl+Alt+S` (Eclipse), `⌘ Comma` (Eclipse (macOS)) to open settings and then select `Plugins`.
2. Open the Installed tab, find the Code Coverage for Java plugin, and select the checkbox next to the plugin name.
## Run with coverage
Procedure:
The entry points for running coverage analysis are the same as you would normally use to [run an application](running-applications.html):
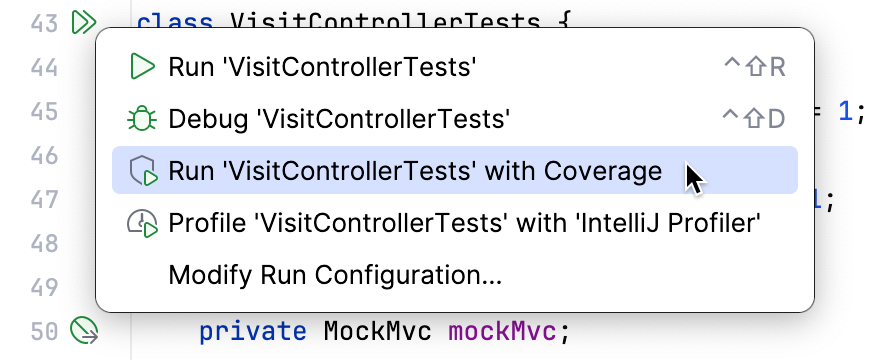
* For main method definitions, click  Run in the editor gutter, then select Run with Coverage
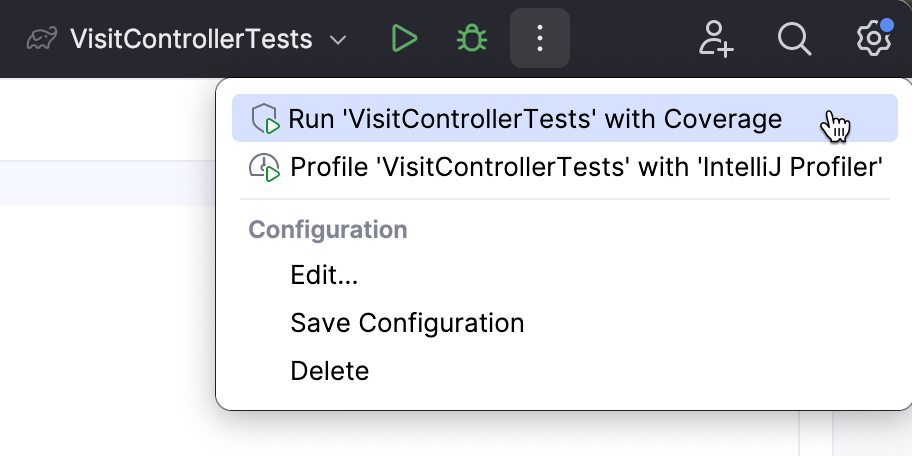
* For [run configurations](run-debug-configuration.html), click  More Actions in the [Run widget](new-ui.html#window_header), then select Run with Coverage
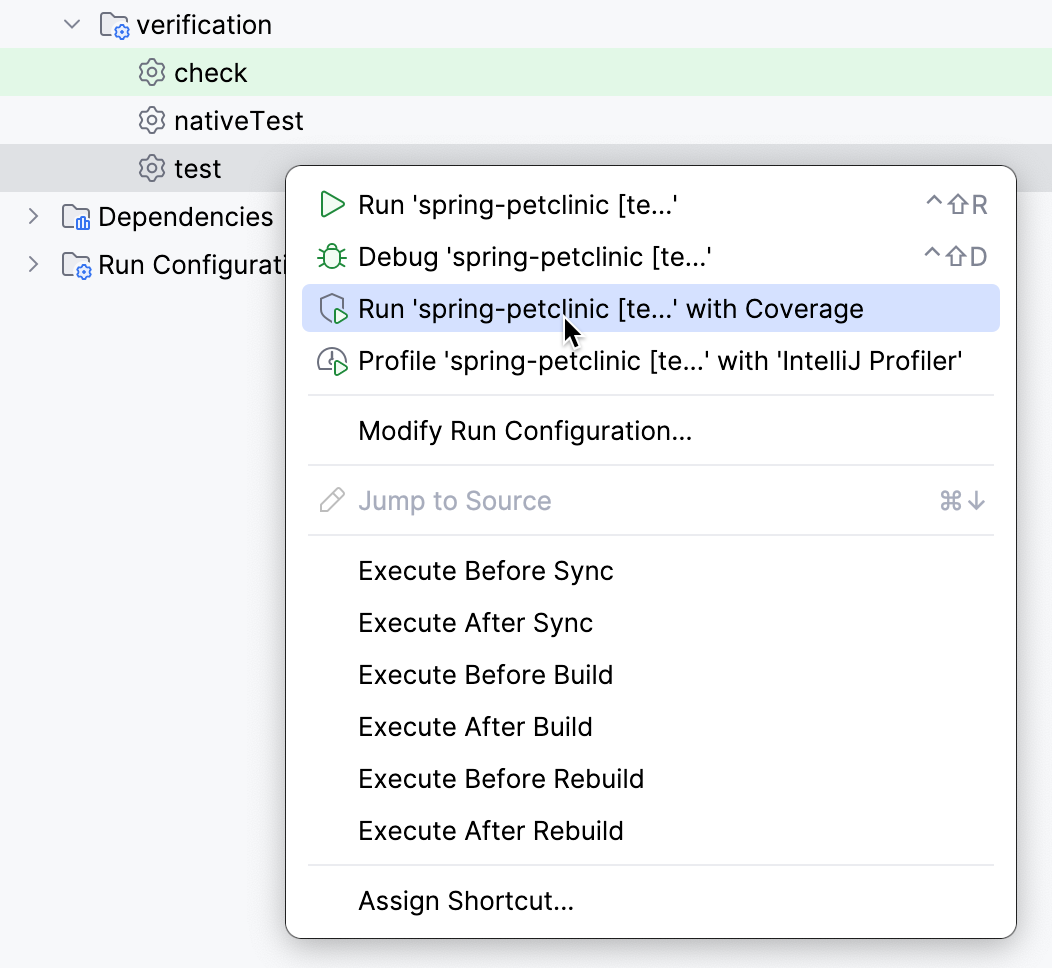
* For Gradle tasks, go to Gradle tool window, right-click the task, and select Run with Coverage
Coverage analysis executes the corresponding run configuration with the coverage agent attached. This agent instruments the bytecode to keep track of the execution line-by-line. After the execution completes, the results of the analysis appear in the IDE.
## Coverage suites
A coverage suite is a collection of code coverage data from a specific run. Each coverage suite stores data from either a single run configuration (if it was [run with coverage](#run_with_coverage)) or from an [imported coverage data file](#add-remove-coverage-suite).
IntelliJ IDEA stores coverage suites in the `coverage` folder of the [IDE system directory](directories-used-by-the-ide-to-store-settings-caches-plugins-and-logs.html#system-directory):
Windows:
`%LOCALAPPDATA%\JetBrains\IntelliJIdea2026.2\coverage`
macOS:
`~/Library/Caches/JetBrains/IntelliJIdea2026.2/coverage`
Linux:
`~/.cache/JetBrains/IntelliJIdea2026.2/coverage`
IntelliJ IDEA can display results from one or more coverage suites at the same time, and you can select which suites to show. If multiple suites are selected, the IDE displays their merged results: this means that a line is considered covered if it was executed in at least one of the suites.
Procedure: Select which coverage suites to display
1. In the main menu, go to `Run | Manage Coverage Reports…` (`Ctrl+Alt+F6` (Windows), `⌘ ⌥ F6` (macOS), `⌘ ⌥ F6` (IntelliJ IDEA Classic (macOS)), `⌘ ⌥ F6` (macOS System Shortcuts), `Ctrl+Alt+6` (XWin), `Ctrl+Alt+6` (GNOME), `Ctrl+Alt+6` (KDE), `Ctrl+Alt+F6` (Emacs), `Ctrl+Alt+F6` (Sublime Text), `⌘ ⌥ F6` (Sublime Text (macOS)), `Ctrl+Alt+F6` (NetBeans), `Ctrl+Alt+F6` (Visual Studio), `⌘ ⌥ F6` (Visual Studio (macOS)), `Ctrl+Alt+F6` (Eclipse), `⌘ ⌥ F6` (Eclipse (macOS))).
2. In the Choose Coverage Suite to Display dialog that opens, select the suites you want to display results from.
* If you want to hide all code coverage results, click No Coverage instead. This deselects all coverage suites and closes the dialog.
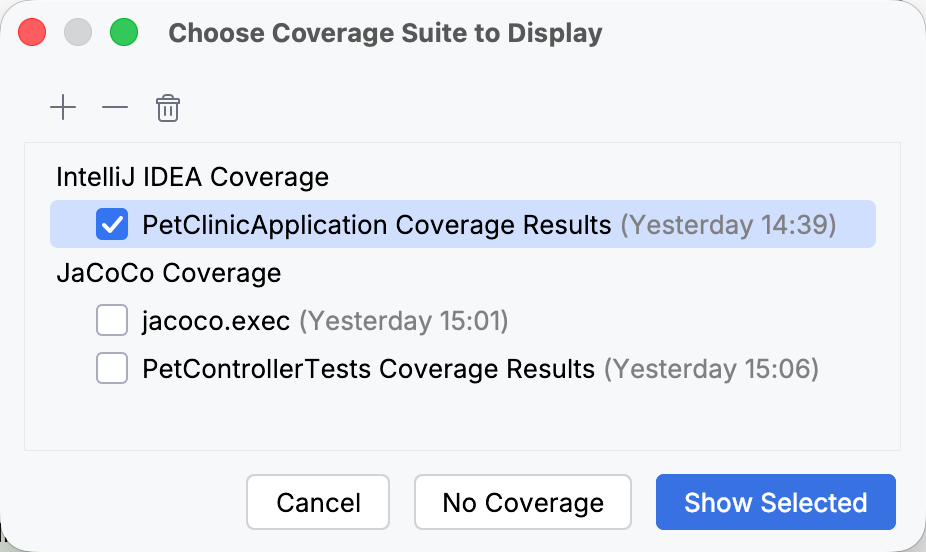
3. Click Show Selected.
IntelliJ IDEA loads the code coverage results and opens the [Coverage tool window](#coverage-tool-window).
Procedure: Add and remove coverage suites
If you want to review code coverage results from a file that was generated outside IntelliJ IDEA (for example, by a build server or another developer), you can add the file as a separate coverage suite. This applies to files generated by [JaCoCo](https://www.jacoco.org/jacoco/) (`.exec` or `.xml`) and the IntelliJ IDEA runner (`.ic`).
> **Tip:**
> If you want to view results from a JaCoCo `.exec` file, you can double-click that file in the Project tool window. Note that this automatically loads this file as your only active suite and hides the results from other suites.
You can also remove suites from the IDE or completely delete them from disk.
1. In the main menu, go to `Run | Manage Coverage Reports…` (`Ctrl+Alt+F6` (Windows), `⌘ ⌥ F6` (macOS), `⌘ ⌥ F6` (IntelliJ IDEA Classic (macOS)), `⌘ ⌥ F6` (macOS System Shortcuts), `Ctrl+Alt+6` (XWin), `Ctrl+Alt+6` (GNOME), `Ctrl+Alt+6` (KDE), `Ctrl+Alt+F6` (Emacs), `Ctrl+Alt+F6` (Sublime Text), `⌘ ⌥ F6` (Sublime Text (macOS)), `Ctrl+Alt+F6` (NetBeans), `Ctrl+Alt+F6` (Visual Studio), `⌘ ⌥ F6` (Visual Studio (macOS)), `Ctrl+Alt+F6` (Eclipse), `⌘ ⌥ F6` (Eclipse (macOS))).
2. In the Choose Coverage Suite to Display dialog that opens, choose an action from the toolbar:
* To import an external coverage file, click  Add and browse for the file.
* To remove a coverage suite from the IDE but keep it on disk, select the suite and click  Remove.
* To delete a coverage suite from both the IDE and the disk, select the suite and click  Delete.
## Read coverage data
IntelliJ IDEA shows coverage results in:
* Coverage tool window
* Project tool window
* Editor
> **Note:**
> Code coverage is only supported for the code that belongs to your current project.
Code coverage results are displayed in the Coverage tool window, in the Project tool window, and in the editor after you [launch at least
one run configuration with coverage](#run_with_coverage).
### Project tool window
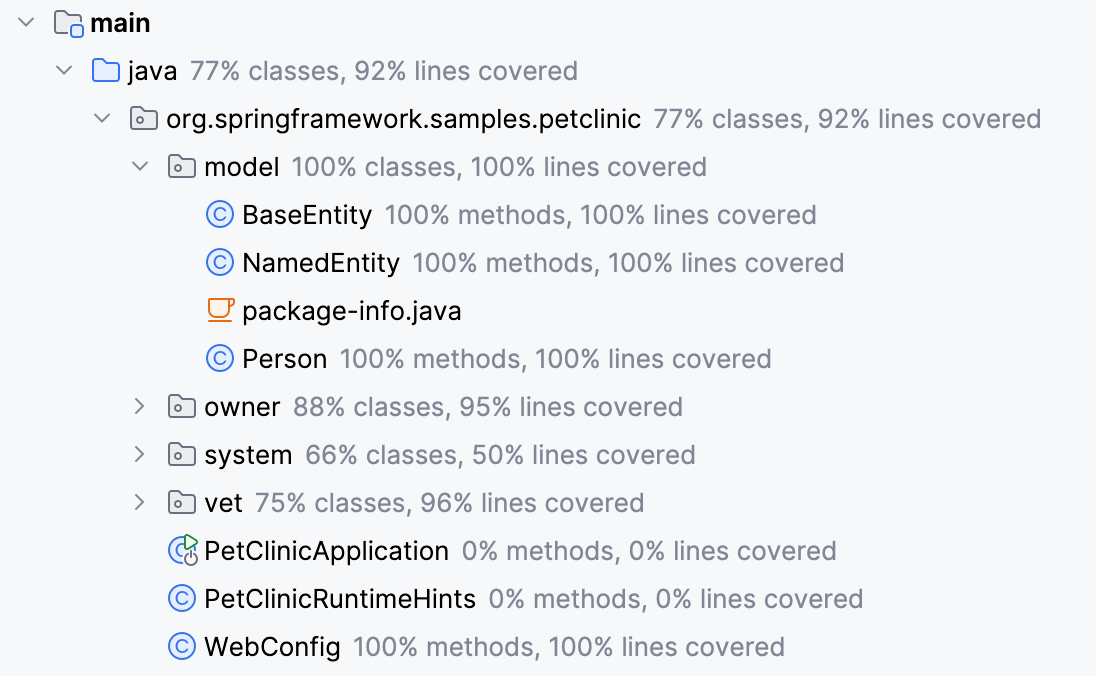
The Project tool window displays:
* the percentage of the covered classes and lines for directories
* the percentage of the covered methods and lines for classes
### Coverage tool window
The report breaks down the project by coverage percentage of classes, methods, lines, and branches.
> **Note:**
> If a class contains lambdas, anonymous, or inner classes, their coverage will be shown in the containing class coverage
Branch coverage shows the percentage of the executed branches in statements like `if-else` or `switch`. It is available for the JaCoCo runner and for the IntelliJ IDEA runner with the [Branch Coverage](#tracing) option enabled.
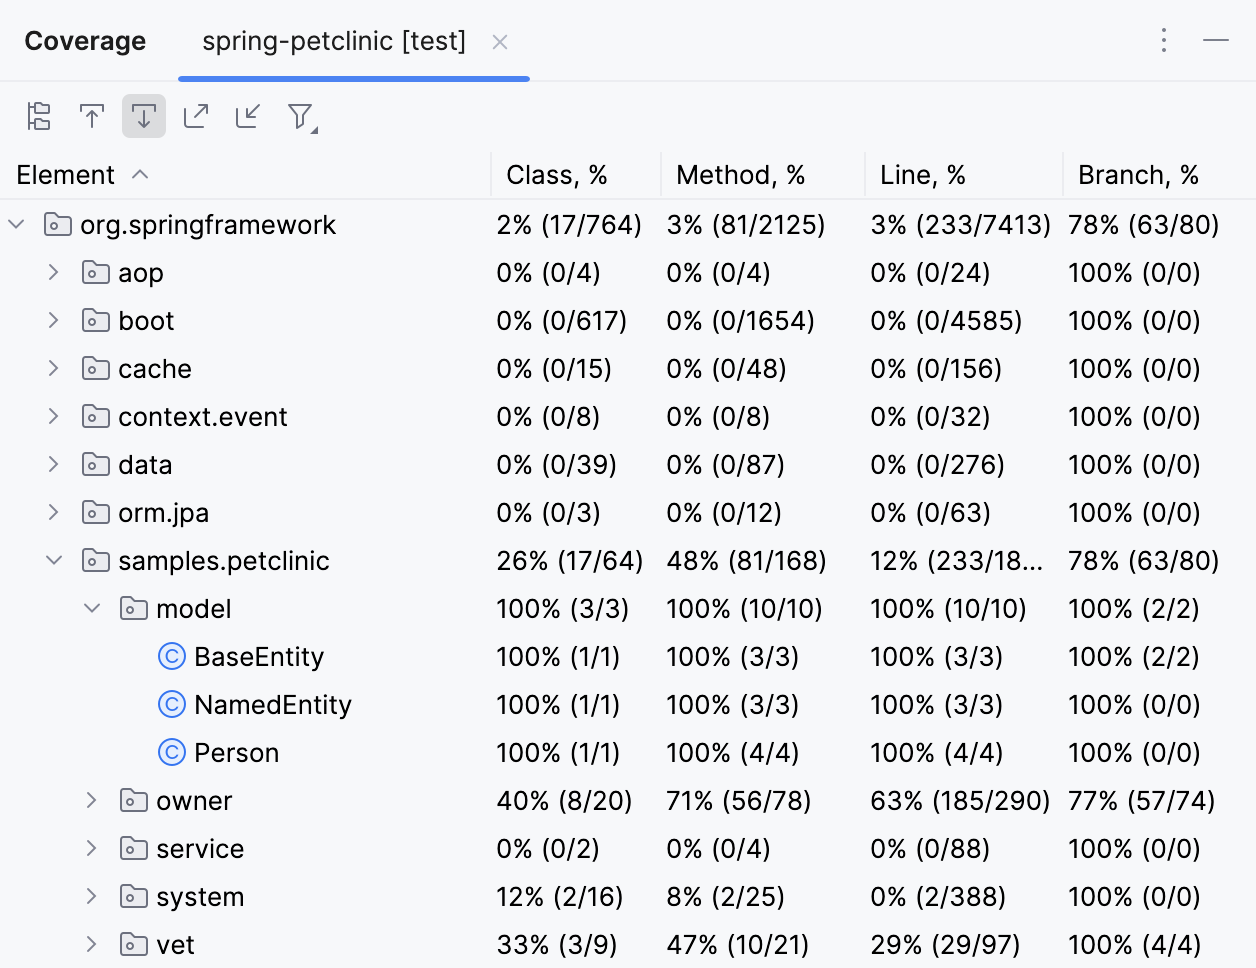
The Coverage tool window has the following options:
| Item | Description |
| --- | --- |
|  | Select whether to show packages hierarchically or flatten the structure to show all of them on the same level. |
|  | If this option is on, IntelliJ IDEA automatically opens the selected item in the editor. Otherwise, you need to double-click items to open them. |
|  | If this option is on, IntelliJ IDEA automatically locates in the tool window the files that you open in the editor. |
|  | Generate a code coverage report and save it to the specified directory. For more information, refer to [Generate coverage report](#report). |
|  | Import a coverage suite from disk. |
|  | Filter coverage results. You can configure the following filters: * Show Only Modified Classes – only show classes that have been changed in the current feature branch, relative to a protected VCS branch. > **Note:** > This option requires committed changes in a feature branch Select this option to focus on updates that are not yet in the remote VCS branch. Enable if at least one protected remote VCS branch is present. * Show Only Classes With Uncommitted Changes – only show classes that have not been committed to a VCS. > **Note:** > This option is not shown when Show Only Modified Classes is available * Hide Fully Covered Classes – only show classes that are not fully covered with tests. Select this option when you want to exclude elements that are typically fully covered or do not have executable lines in them, such as interfaces. |
### Editor
The editor displays the coverage status of individual code lines. The status is indicated by color-coded markers in the gutter:
* Green (): the code line was executed.
* Yellow (): the code line was executed partially. This happens when the code line contains conditional logic (such as an `if/else` statement, a loop, or a `switch` statement), but only some of its branches were run.
* Red (): the code line was not executed.
To open a popup with coverage statistics for a specific line, click its coverage marker in the gutter. Depending on which coverage runner you used, the popup displays different information:
IntelliJ IDEA runner:
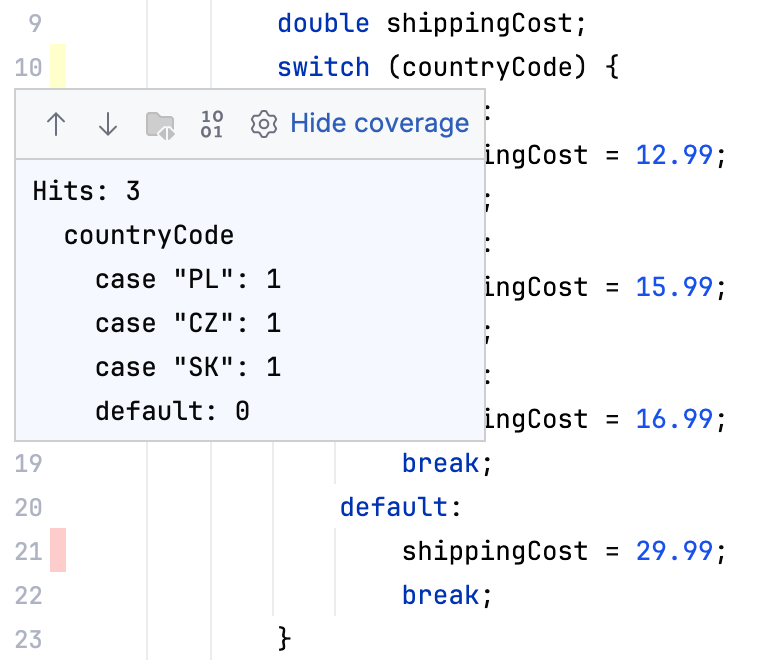
For the IntelliJ IDEA runner, the popup can display the following information:
* Hits: how many times the code line was executed.
* If the line contains conditional logic (such as an `if/else` statement, a ternary operator, or a loop): * true hits: how many times the condition was true. * false hits: how many times the condition was false.
* If the line contains a `switch` statement: * case : how many times a particular case was executed.
JaCoCo runner:
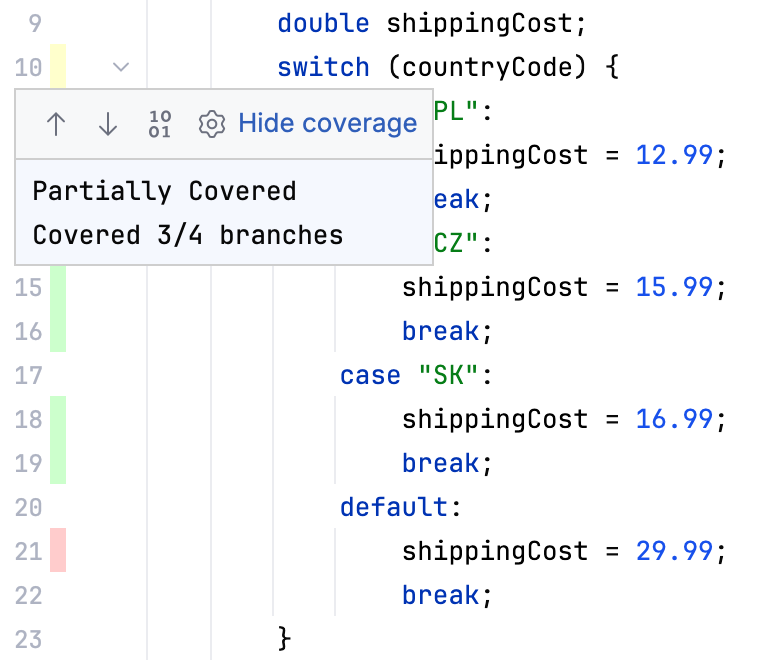
For the JaCoCo runner, the popup can display the following information:
* Fully Covered: the code line was executed. If it contains conditional logic, all possible branches were run.
* Partially Covered: the code line was executed, but only some branches of its conditional logic were run.
* Uncovered: the code line was not executed at all.
* Covered / branches: how many branches of the conditional logic were run vs. the total number of branches.
Additionally, the popup includes the following icons:

: Previous
:
:
:
: Navigate to the previous coverage marker and open its statistics.

: Next
:
:
:
: Navigate to the next coverage marker and open its statistics.

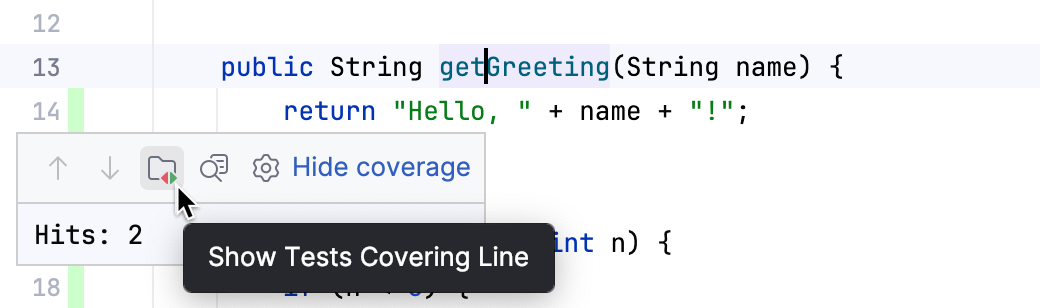
: Show Tests Covering Line
:
:
:
: Show tests that cover the code line in a separate popup.
:
:
:
:
:
: > **Note:**
: > This option is only available if the following criteria are met:
: >
: >
: >
: > * The coverage analysis was run through a [JUnit](run-debug-configuration-junit.html) or [TestNG](run-debug-configuration-testng.html) run configuration.
: >
: > * When the analysis was run, the [Coverage settings](#project_settings) were set the following way: * Choose coverage runner was set to IntelliJ IDEA. * Track per test coverage was selected.
: >
: > * The line was fully or partially covered in the analysis.

: Show Bytecode
:
:
:
: Show the bytecode of the current class in a separate tool window.

: Edit Coverage Colors
:
:
:
: Open `Settings | Editor | Color Scheme | General` to [customize
: the colors](configuring-colors-and-fonts.html#edit-colors) of coverage markers.

: Hide coverage
:
:
:
: Stop displaying coverage results in IntelliJ IDEA.
## Hide coverage data
Procedure:
Do one of the following:
* Close the tab with coverage statistics in the Coverage tool window (`View | Tool Windows | Coverage`).
* Click coverage highlighting in the gutter and select Hide coverage.
## Generate coverage report
Procedure:
1. Go to `Run | Generate Coverage Report`, or click  in the Coverage tool window.
> **Note:**
> This option only becomes available after you run the necessary tests with coverage.
2. In the Generate Coverage Report dialog, specify the directory to store the generated report and optionally select the Open generated HTML in browser checkbox.
## Configure code coverage
In IntelliJ IDEA, there are coverage settings that apply to individual run configurations, and those applicable per-project.
### Run configuration settings
For each [run configuration](run-debug-configuration.html), you can specify the scope of the coverage analysis.
Procedure: Configure classes and packages
1. Go to `Run | Edit Configurations` and click the run configuration on the left panel.
2. Click Modify options, then select the following options under Code Coverage:
* Specify classes and packages: select this option to configure classes and packages for which you want to see the coverage information.
* Exclude classes and packages: select this option to configure classes and packages that you want to exclude from coverage.
### Project settings
> **TL;DR**
> Coverage settings: `Settings `Ctrl+Alt+S` (Windows), `⌘ Comma` (macOS), `⌘ Comma` (IntelliJ IDEA Classic (macOS)), `⌘ Comma` (macOS System Shortcuts), `Ctrl+Alt+S` (XWin), `Ctrl+Alt+S` (GNOME), `Ctrl+Alt+S` (KDE), `Ctrl+Alt+S` (Emacs), `Ctrl+Alt+S` (Sublime Text), `⌘ Comma` (Sublime Text (macOS)), `Ctrl+Alt+S` (NetBeans), `Ctrl+Alt+S` (Visual Studio), `⌘ Comma` (Visual Studio (macOS)), `Ctrl+Alt+S` (Eclipse), `⌘ Comma` (Eclipse (macOS)) | Build, Execution, Deployment | Coverage`
For projects, you can configure the following options:
| Show options before applying coverage to the editor | Ask whether to make the recently collected [coverage suite]() active every time you run coverage analysis. In this case a dialog will appear, where you can choose to only display the new results, to add them to the existing results, or save them to storage without viewing. |
| Do not apply collected coverage | Only save the recently collected [coverage suite]() to storage after you have run coverage analysis. In this case, new coverage data will not be shown unless you explicitly select the corresponding suite in `Run \| Manage Coverage Reports`. |
| Replace active suites with the new one | Hide the currently shown [coverage suites]() and use the newly collected one after you have run coverage analysis. In this case, only the results from the most recent coverage run will be shown. |
| Add to the active suites | Add the newly collected [coverage suite]() to the list of active suites after you have run coverage analysis. This keeps the existing coverage results and adds the new results on top of it. |
| Activate Coverage View | Open the [Coverage tool window](#coverage-tool-window) every time you run coverage analysis. |
| Choose coverage runner | Select the coverage runner: IntelliJ IDEA or JaCoCo |
| Branch coverage always on for JaCoCo | Collect granular coverage data for `if` and `switch` statements' branches. |
| Track per test coverage only for IntelliJ IDEA runner | Lets you trace back to specific tests, during which a line was executed. For details, refer to [Per-test coverage](#track_coverage_per_test). |
| Collect coverage in test folders only for IntelliJ IDEA runner | Collect code coverage statistics for tests. By default, coverage data only shows which lines were covered in source roots. Use this option to enable coverage collection in test roots as well. |
| Ignore implicitly declared default constructors only for IntelliJ IDEA runner | Exclude the implicit default constructors from coverage statistics. No-arg constructors that are declared explicitly will remain included. |
| Exclude annotations only for IntelliJ IDEA runner | Exclude elements marked with the specified annotations from coverage results, for example, Lombok's `@Generated` elements. |
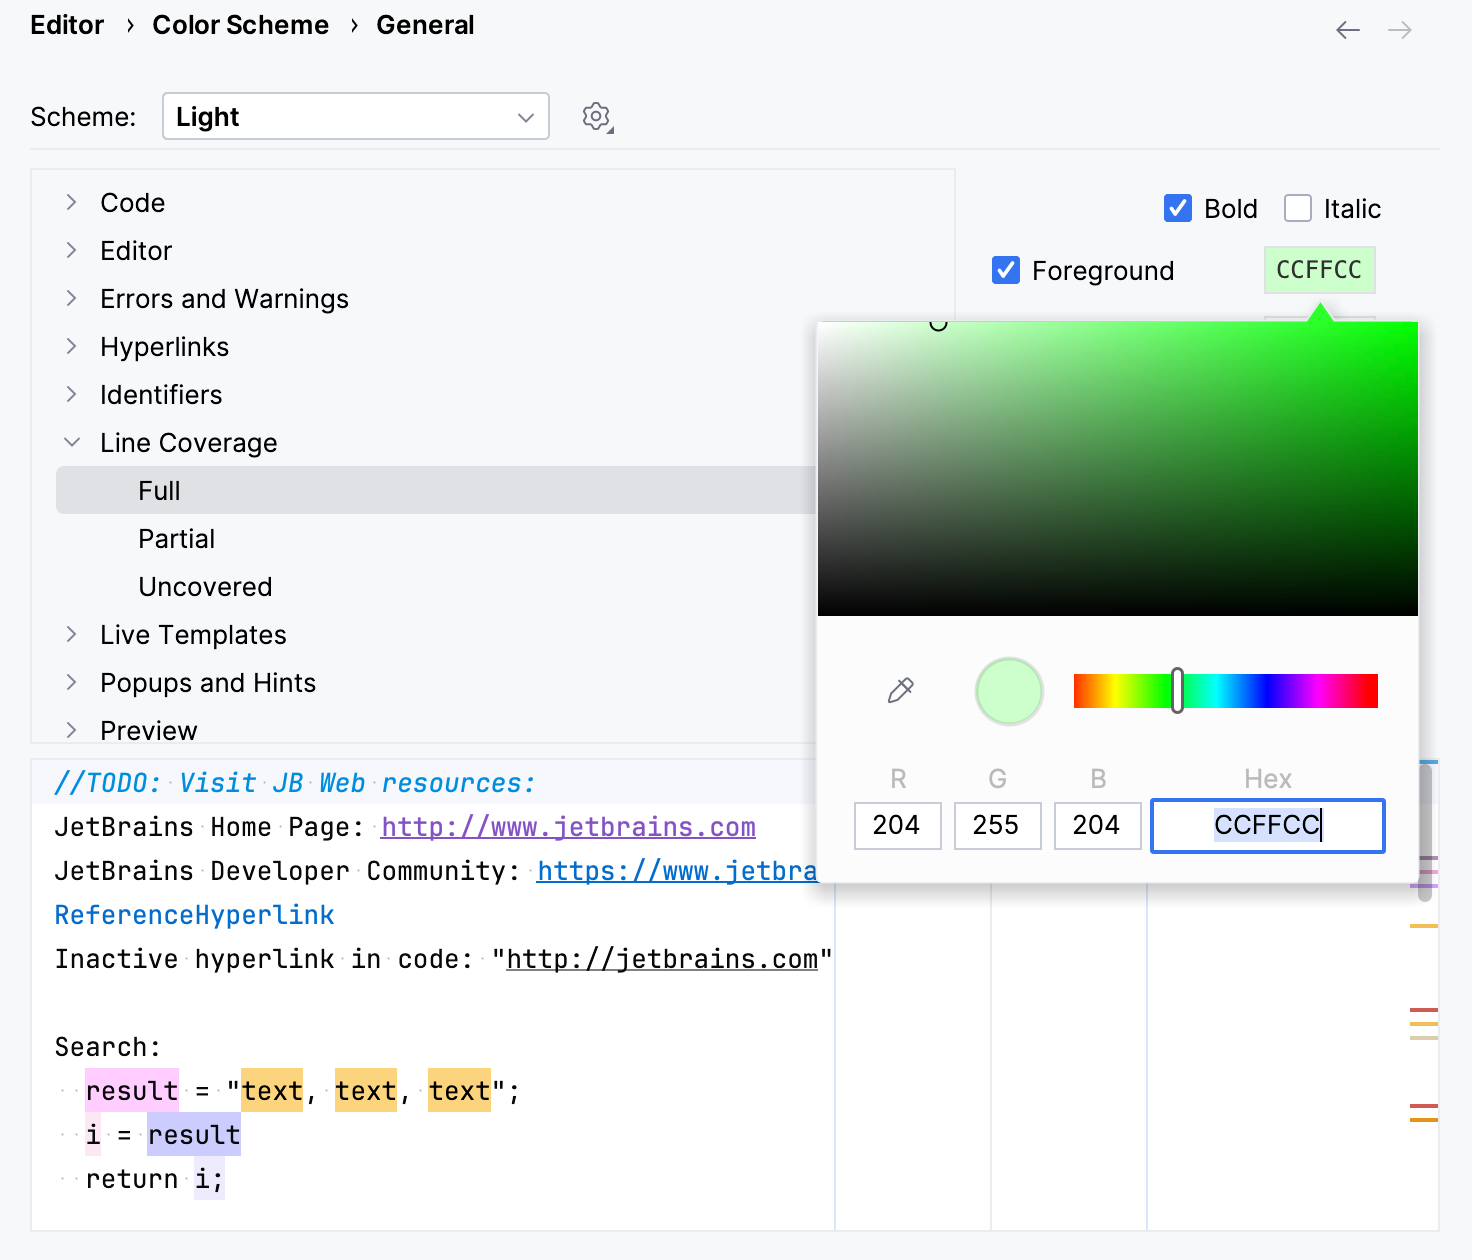
Procedure: Change colors of the coverage highlighting
1. Press `Ctrl+Alt+S` (Windows), `⌘ Comma` (macOS), `⌘ Comma` (IntelliJ IDEA Classic (macOS)), `⌘ Comma` (macOS System Shortcuts), `Ctrl+Alt+S` (XWin), `Ctrl+Alt+S` (GNOME), `Ctrl+Alt+S` (KDE), `Ctrl+Alt+S` (Emacs), `Ctrl+Alt+S` (Sublime Text), `⌘ Comma` (Sublime Text (macOS)), `Ctrl+Alt+S` (NetBeans), `Ctrl+Alt+S` (Visual Studio), `⌘ Comma` (Visual Studio (macOS)), `Ctrl+Alt+S` (Eclipse), `⌘ Comma` (Eclipse (macOS)) to open settings and then select `Editor | Color Scheme | General`.
2. In the list of components, expand the Line Coverage node and select a type of coverage: for example, Full, Partial or Uncovered.
3. Click the Foreground field to open the Select Color dialog.
4. Select a color, apply the changes, and close the dialog.
## Per-test coverage
When branch coverage is enabled, IntelliJ IDEA lets you track which lines of code are covered by each test and vice versa.
> **Note:**
> This feature is not supported for Gradle and test frameworks other than JUnit.
Procedure: Enable per-test coverage
In `Settings `Ctrl+Alt+S` (Windows), `⌘ Comma` (macOS), `⌘ Comma` (IntelliJ IDEA Classic (macOS)), `⌘ Comma` (macOS System Shortcuts), `Ctrl+Alt+S` (XWin), `Ctrl+Alt+S` (GNOME), `Ctrl+Alt+S` (KDE), `Ctrl+Alt+S` (Emacs), `Ctrl+Alt+S` (Sublime Text), `⌘ Comma` (Sublime Text (macOS)), `Ctrl+Alt+S` (NetBeans), `Ctrl+Alt+S` (Visual Studio), `⌘ Comma` (Visual Studio (macOS)), `Ctrl+Alt+S` (Eclipse), `⌘ Comma` (Eclipse (macOS)) | Build, Execution, Deployment | Coverage`, enable Branch coverage and Track per test coverage.
Procedure: Track tests per line
To navigate to tests covering a specific line:
* Click the coverage highlighting in the editor gutter, then select  Show Tests Covering Line.
Procedure: Track lines per test
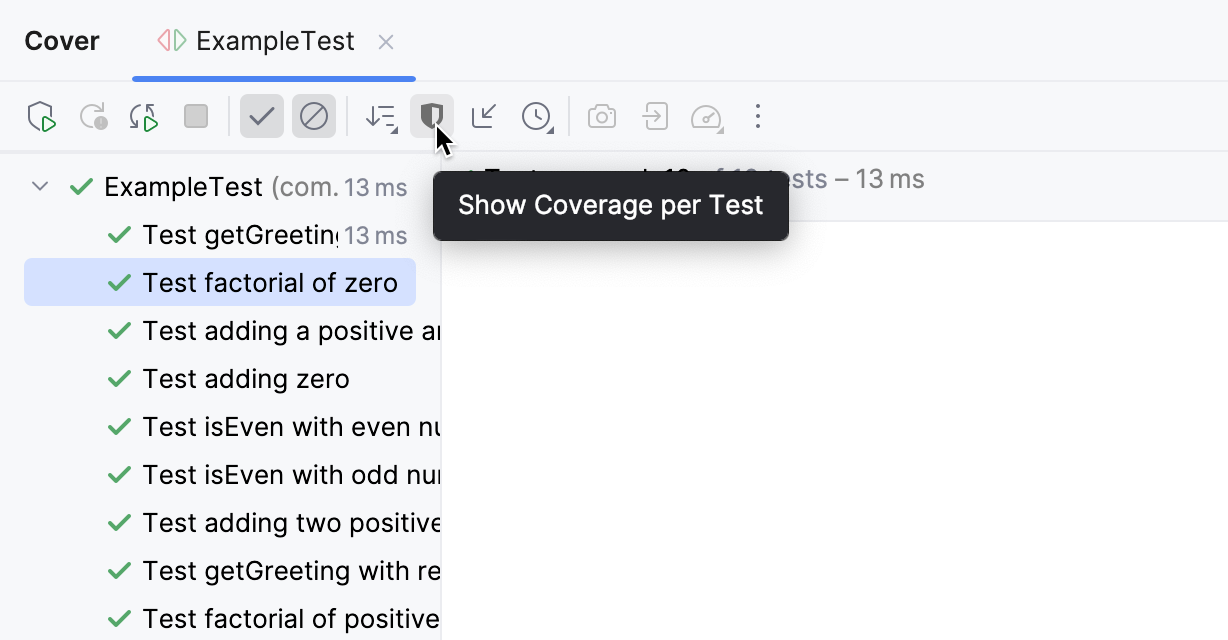
To only highlight the lines covered within a specific test:
* In the Cover tool window, select a test and click Show Coverage per Test on the toolbar.
> **Note:**
> Show Coverage per Test disables branch coverage. Coverage will be highlighted as full/none.
## See also
### Concepts
[Run/debug configurations](run-debug-configuration.html)
### External Links
[JaCoCo: Java Code Coverage Library](https://www.eclemma.org/jacoco/)