# Create and open memory snapshots
> **TL;DR**
> Profiler home page: `View | Tool Windows | Profiler`
Memory snapshots (heap dumps) are useful for identifying memory-related problems. You can analyze the heap to find memory leaks and locate the code that uses large amounts of memory resources. IntelliJ IDEA allows you to analyze `.hprof` snapshots regardless of whether they were taken in the IDE or any other external tool.
> **Note:**
> Memory snapshots reflect the state of a program at a particular instant. If you are interested in exploring objects created within a certain time frame, consider [allocation profiling](cpu-and-allocation-profiling-basic-concepts.html) as it might be more suitable for this use-case.
Procedure: Take a memory snapshot
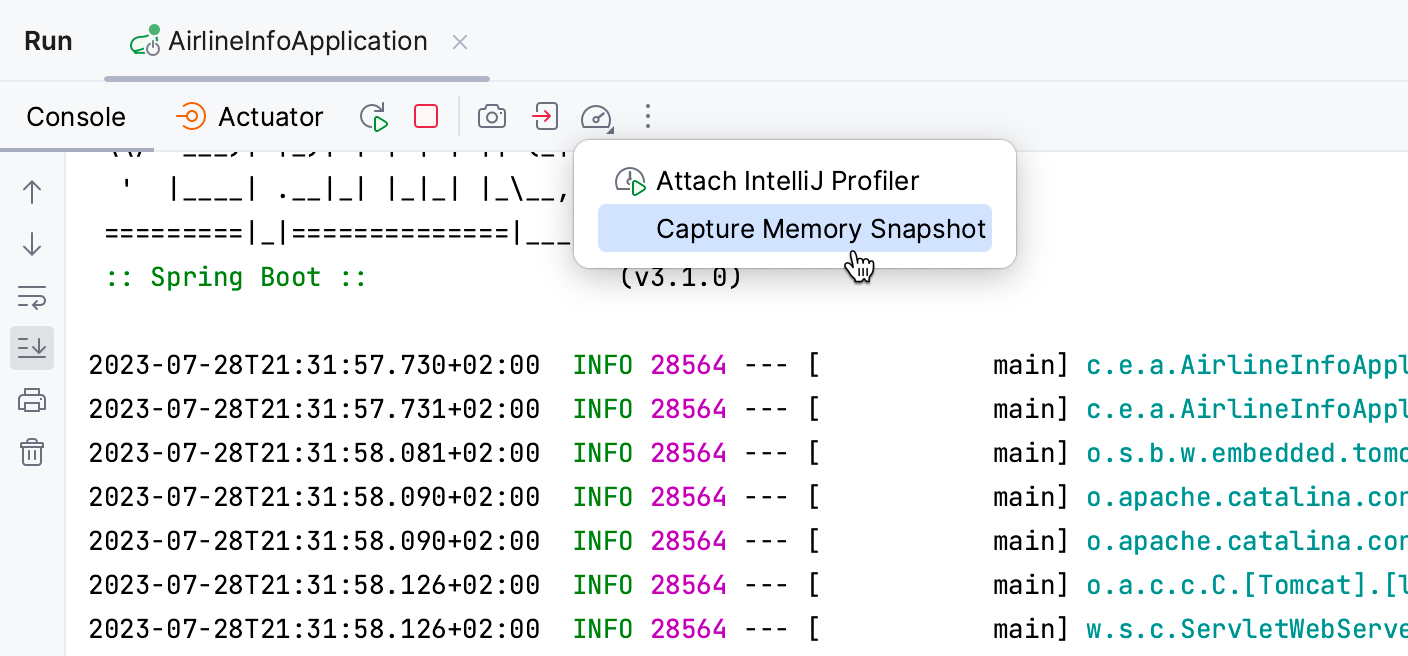
* If the process is already running through the Run or Services tool window, click `Profile the process | Capture Memory Snapshot`.
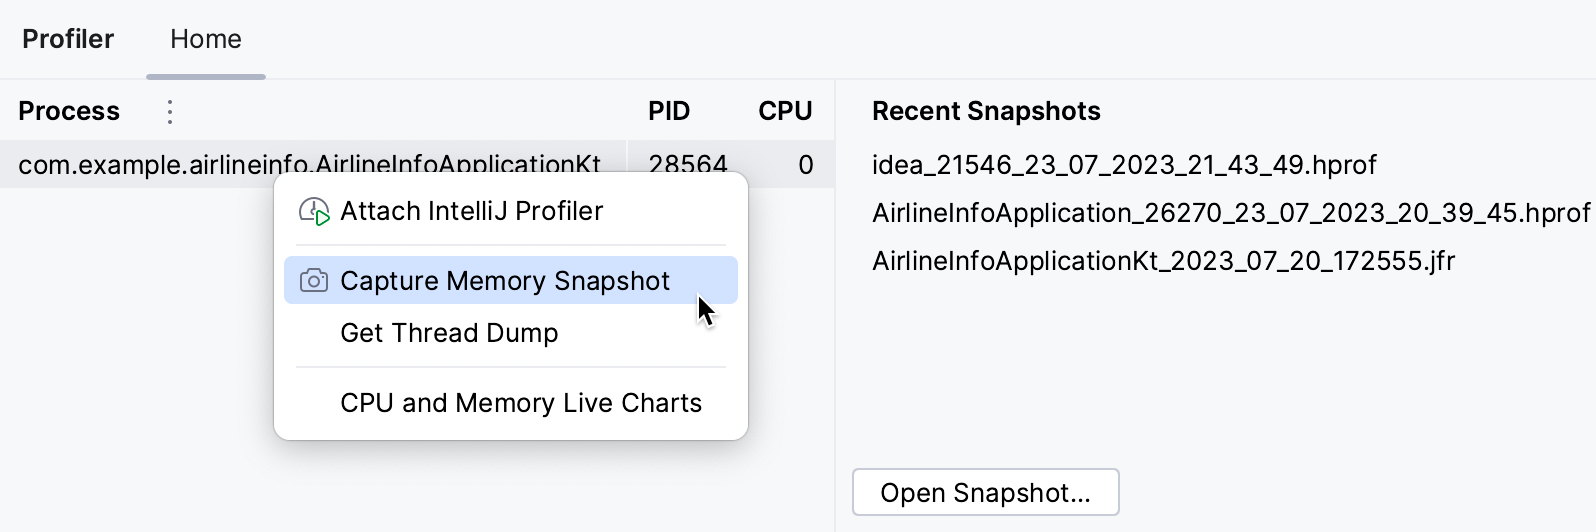
* For arbitrary processes: in the Profiler tool window (`View | Tool Windows | Profiler`), right-click the process and select Capture Memory Snapshot.
When the snapshot is captured, it opens for [analysis](read-the-memory-snapshot.html) right away.
> **Tip:**
> If you want to capture a heap dump when a program runs out of memory, use the `-XX:+HeapDumpOnOutOfMemoryError` VM option for that. For steps to add a VM option, refer to [Run/debug configurations](run-debug-configuration.html).
The snapshot also appears under Recent snapshots. From there, you can view the recent snapshots or open other snapshots that are stored elsewhere on your hard drive.
Procedure: Open an external memory snapshot
1. Open the Profiler tool window (`View | Tool Windows | Profiler`).
2. On the Recent Snapshots tab, click Open Snapshot, then select the `hprof` file that you want to open.
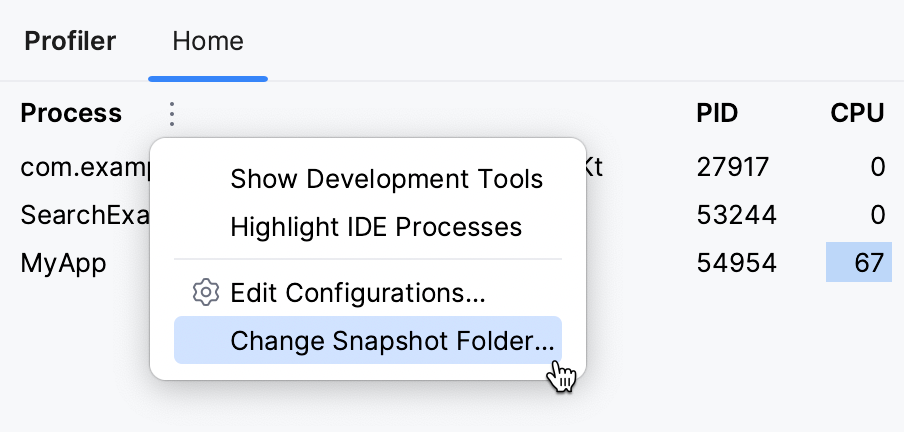
By default, the snapshots are stored in the user home directory. If you prefer another location, you can change that.
Procedure: Change the snapshots location
1. Open the Profiler tool window (`View | Tool Windows | Profiler`).
2. On the Home tab, click More, then select Change Snapshots' Folder… .
If you are developing an IDE plugin, you may want to take a memory snapshot of IntelliJ IDEA itself.
Procedure: Take a memory snapshot of the IDE
* In the main menu, go to `Help | Diagnostic Tools | Capture Memory Snapshot`.