# Examine suspended program
> **TL;DR**
> Debug tool window: `View | Tool Windows | Debug` or `Alt+5` (Windows), `⌘ 5` (macOS), `⌘ 5` (IntelliJ IDEA Classic (macOS)), `⌘ 5` (macOS System Shortcuts), `Alt+5` (XWin), `Alt+5` (GNOME), `Alt+5` (KDE), `Alt+5` (Emacs), `Alt+5` (Sublime Text), `⌘ 5` (Sublime Text (macOS)), `Alt+5` (NetBeans), `Alt+5` (Visual Studio), `⌘ 5` (Visual Studio (macOS)), `Alt+5` (Eclipse), `⌘ 5` (Eclipse (macOS))
After the debugger session has [started](starting-the-debugger-session.html) , the [Debug](debug-tool-window.html) tool window appears, and the program runs normally until one of the following happens:
* a [breakpoint](using-breakpoints.html) is hit
* you manually [pause](starting-the-debugger-session.html#pause-resume) the program
After that, the program is suspended, allowing you to examine its current state, control its further execution, and test various scenarios at runtime.
## Examine frames
The state of the program is represented by frames. When the program is suspended, the current frame stack is displayed on the Frames tab of the Debug tool window.
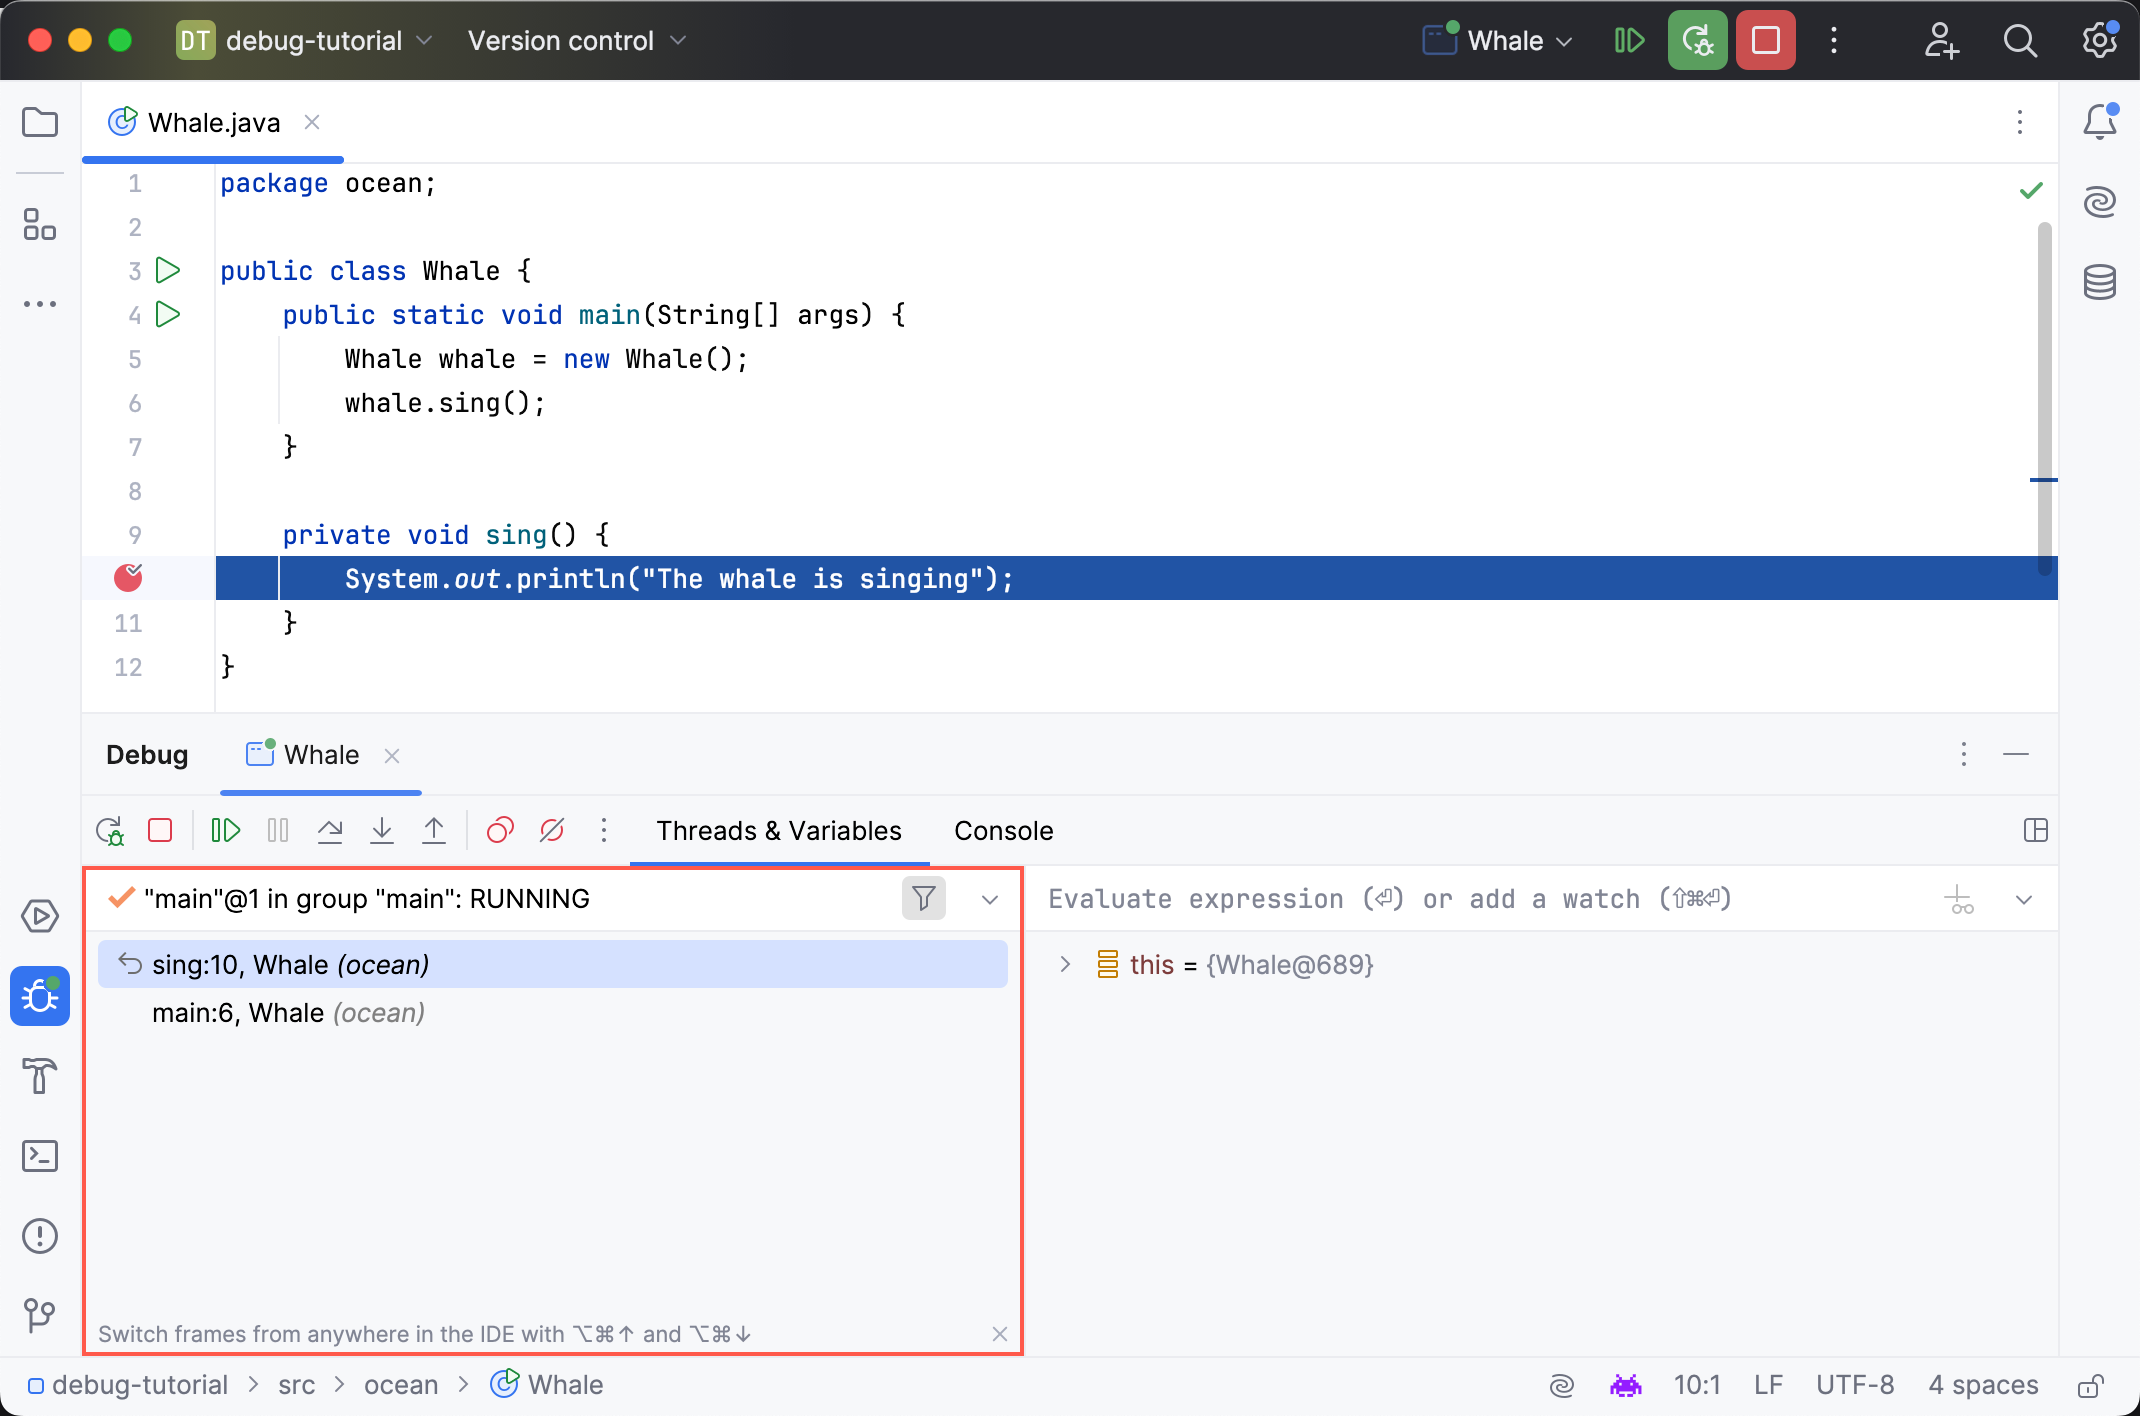
A frame corresponds to an active method or function call. It stores the local variables of the called method or function, its arguments, and the code context that enables expression evaluation.
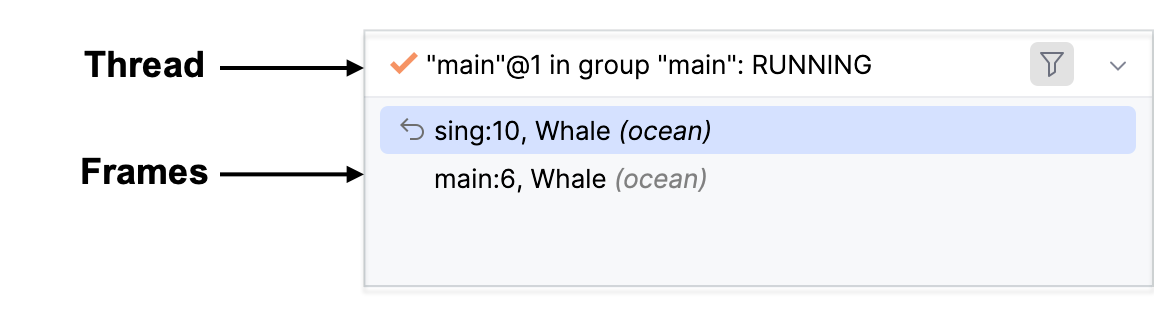
To better understand the concept of frames, let's look into what happens when a program is run. The execution of the program starts from the `main` method, which in turn calls other methods. Each of these methods may make additional method calls. The set of local variables and parameters for each method call is represented by a frame.
Each time a method is called, a new frame is added to the top of the stack. When the execution of a method is complete, the corresponding frame is removed from the stack (in the last in, first out fashion).
> **Tip:**
> When you select a frame, the corresponding file will open in a preview tab, which means that it will close when you navigate away from this frame. To open the file in a regular tab, double-click the frame.
>
>
>
> To change this behavior, click Show Options Menu  on the toolbar of the Debug tool window, then select Open Files in Preview Tab.
Examining frames helps you understand why particular parameters were passed to a method and what the state of the caller was at the time of calling.
### Thread Statuses
Thread statuses are provided by Java to reflect what is currently happening to the thread:
| Thread status | Description |
| --- | --- |
| MONITOR | The thread is waiting on a Java monitor. |
| NOT_STARTED | The thread has not yet been started. |
| RUNNING | The thread is active and running. |
| SLEEPING | The thread is sleeping because `Thread.sleep()` or `JVM_Sleep()` was called. |
| UNKNOWN | The thread status is unknown. |
| WAIT | The thread is waiting after `Object.wait()` or `JVM_MonitorWait()` was called. |
| ZOMBIE | The thread has completed execution. |
### Thread Icons
Icons near each thread indicate the status of the thread:
| Icon | Description |
| --- | --- |
|  | The current thread in suspended state. |
|  | An active thread. |
|  | The thread that has hit the current breakpoint. |
|  | A suspended thread. Threads are marked as suspended when they were paused by the debugger. |
|  | A frozen thread. Threads are marked as frozen when they were [manually paused](starting-the-debugger-session.html#pause-resume). |
> **Tip:**
> For capturing threads, virtual threads, and Kotlin coroutines in text format, refer to [Thread dumps](thread-dumps.html).
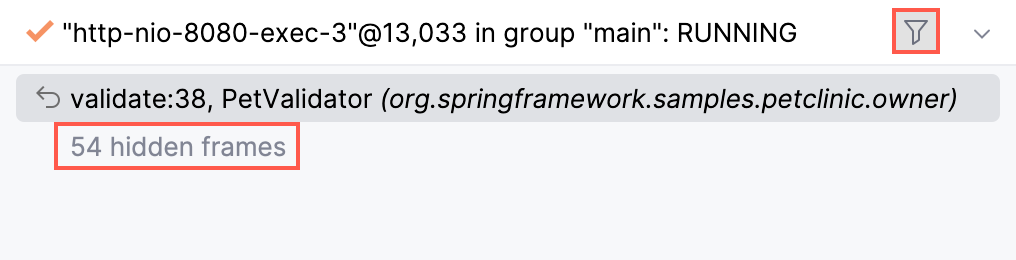
By default, IntelliJ IDEA hides the frames that correspond to framework and library calls.
Procedure: Show frames from libraries
* To reveal the hidden frames, press the Show All Frames toggle button  located in the top-right corner of the Frames pane.
Procedure: Configure packages to hide
1. Go to `Settings `Ctrl+Alt+S` (Windows), `⌘ Comma` (macOS), `⌘ Comma` (IntelliJ IDEA Classic (macOS)), `⌘ Comma` (macOS System Shortcuts), `Ctrl+Alt+S` (XWin), `Ctrl+Alt+S` (GNOME), `Ctrl+Alt+S` (KDE), `Ctrl+Alt+S` (Emacs), `Ctrl+Alt+S` (Sublime Text), `⌘ Comma` (Sublime Text (macOS)), `Ctrl+Alt+S` (NetBeans), `Ctrl+Alt+S` (Visual Studio), `⌘ Comma` (Visual Studio (macOS)), `Ctrl+Alt+S` (Eclipse), `⌘ Comma` (Eclipse (macOS)) | Build, Execution, Deployment | Debugger | Stepping`.
2. Specify the packages that you want to hide under `Do not step into classes`.
3. Make sure the `Hide stack frames using stepping filters` is enabled.
Procedure: Copy stack to clipboard
* To copy the call stack for the current thread, right-click anywhere on the Frames tab and select Copy Stack.
Procedure: Export threads
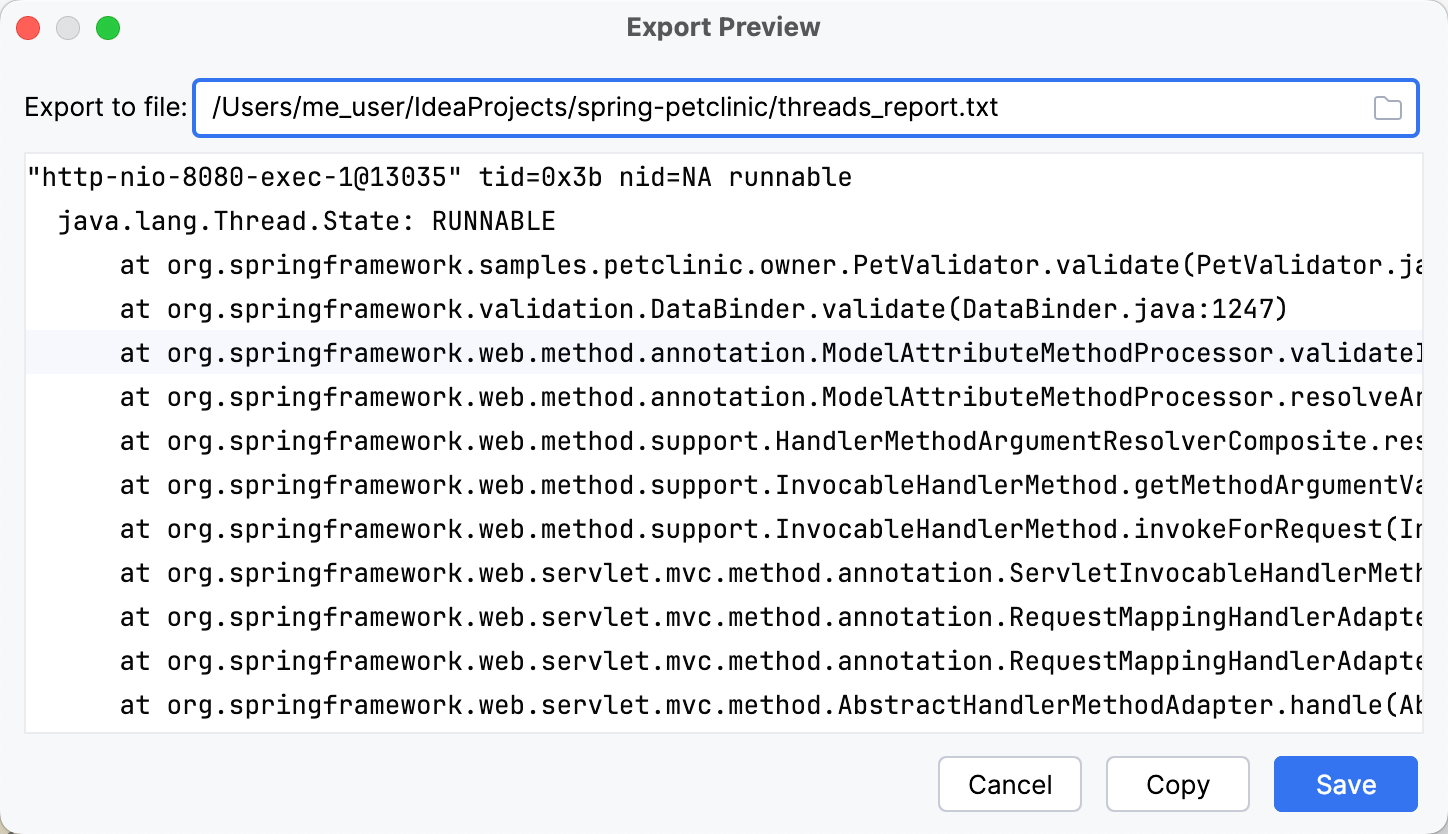
If you need to get a report containing the state of each thread and its stack trace, use the Export Threads option. This is useful when you need to share the information about the threads in text format.
1. Right-click anywhere on the Frames pane and select Export Threads from the menu.
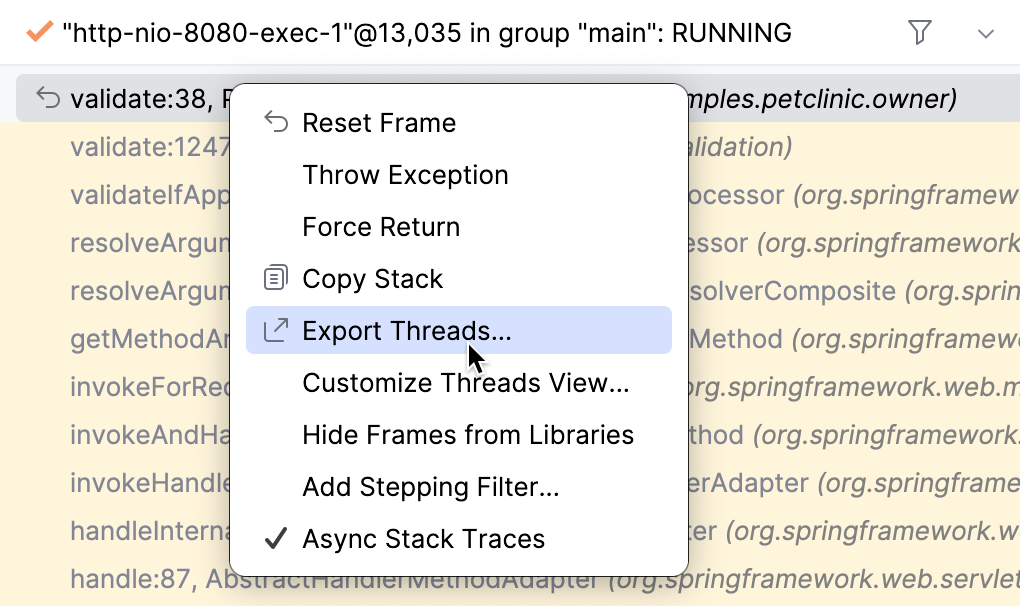
2. To save a report as a text file, specify the path to the file in the Export Threads dialog and click Save, or click Copy to copy it to the clipboard.
## Examine/update variables
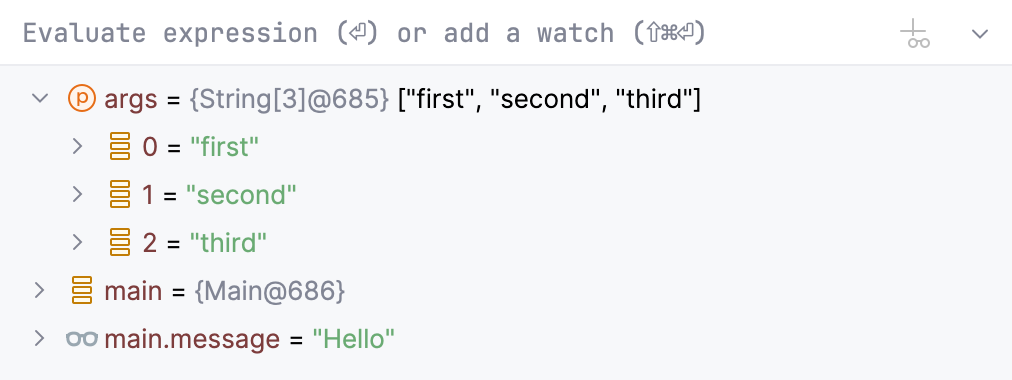
The Variables tab shows the list of the variables in the selected [frame/thread](#examine-frames). Examining the variables can help you understand why the program operates in a certain way.
> **Tip:**
> Be mindful of variable scope and lifetime. If a variable is not present on the list, this means the variable is out of scope for the current [frame](#examine-frames) at the current execution point.
The icon on the left of each variable indicates its type.
### Variable types
| Icon | Description |
| --- | --- |
|  | Static members of the enclosing class |
|  | Fields of an object (both static and nonstatic) |
|  | Fields containing a self-referencing object (for example, `cause` in `Throwable` before the field gets initialized) |
|  | Final fields |
|  | Static fields |
|  | A thrown exception (only displayed when an [exception breakpoint](using-breakpoints.html) was hit) |
|  | A method return value (only displayed when the Show Method Return Values option is enabled) |
|  | Method parameters |
|  | Enum constants |
|  | Local arrays |
|  | Local primitive types |
|  | [Watches](#watches) and auto-variables. |
|  | Local reference variables |
Procedure: Pin fields
If an object has numerous fields, you can pin some of them, so that they are always displayed at the top of the list. This priority will apply to all instances of the corresponding class.
* In the Variables pane, click the icon that indicates the variable type.
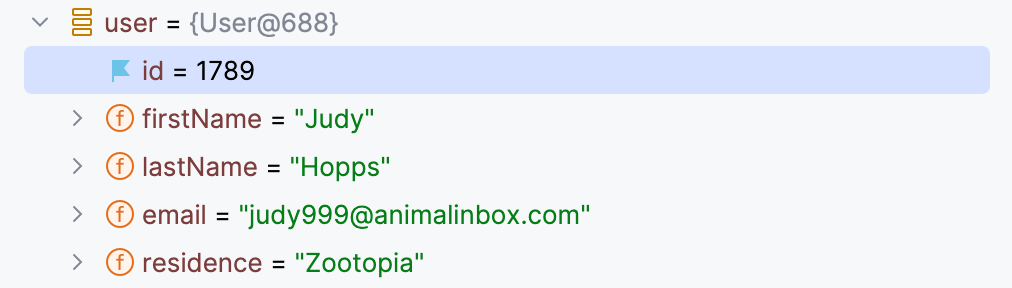
When a field is pinned, a blue flag  replaces the original icon. To unpin the field, click this flag.
Procedure: Copy variables
When examining variables, you may need to copy a variable name or value to paste it somewhere else or [compare](#compare) it with another variable.
* To copy the name of a variable, right-click the variable and select Copy Name.
* To copy the value that a variable holds, right-click the variable and select Copy Value `Ctrl+C` (Windows), `⌘ C` (macOS), `⌘ C` (IntelliJ IDEA Classic (macOS)), `⌘ C` (macOS System Shortcuts), `Ctrl+C` (XWin), `Ctrl+C` (GNOME), `Ctrl+C` (KDE), `Ctrl+Insert` (Emacs), `Ctrl+C` (Sublime Text), `⌘ C` (Sublime Text (macOS)), `Ctrl+C` (NetBeans), `Ctrl+C` (Visual Studio), `⌘ C` (Visual Studio (macOS)), `Ctrl+C` (Eclipse), `⌘ C` (Eclipse (macOS)). For types other than `String`, the `toString` representation is copied.
Procedure: Compare variables with clipboard
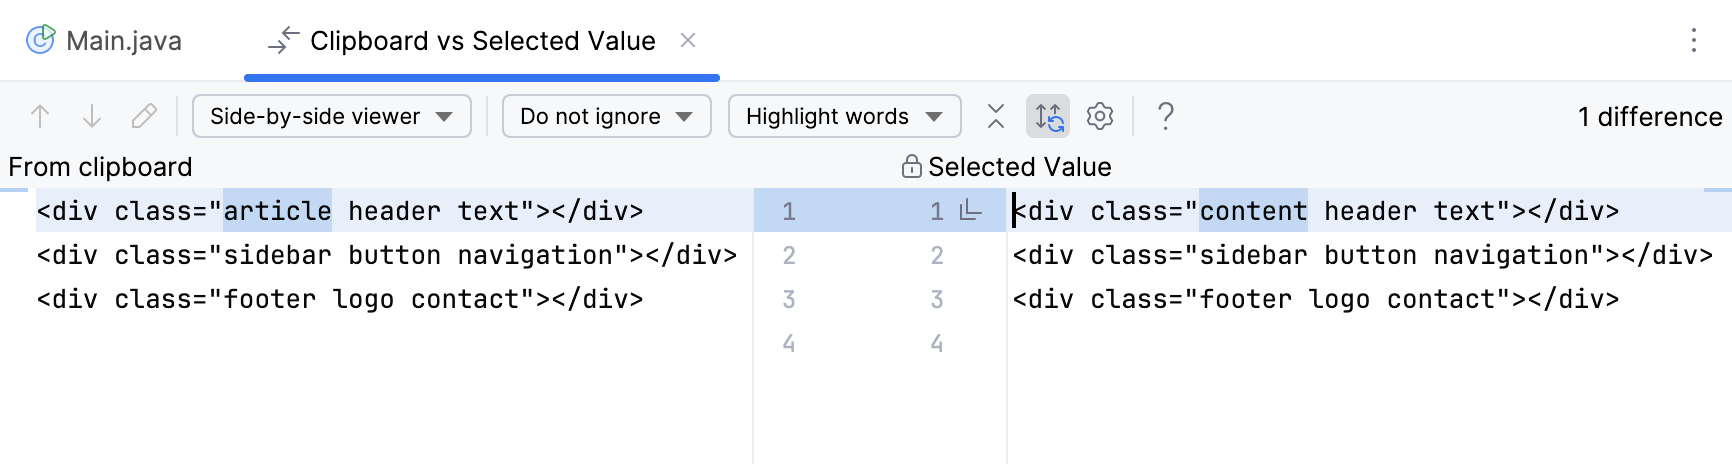
To compare a variable value with some other value, use the Compare Value with Clipboard option. This is helpful, for example, when a variable holds a long string, and you need to compare it with another long string.
1. Copy the content you want to compare, for example, from a text file.
2. In the Variables tab, right-click a variable and select Compare Value with Clipboard.
3. Examine the differences in the Diff Viewer that opens. For more information about Diff Viewer, refer to [Comparing Files and Folders](comparing-files-and-folders.html).
Procedure: View variables in a dedicated dialog
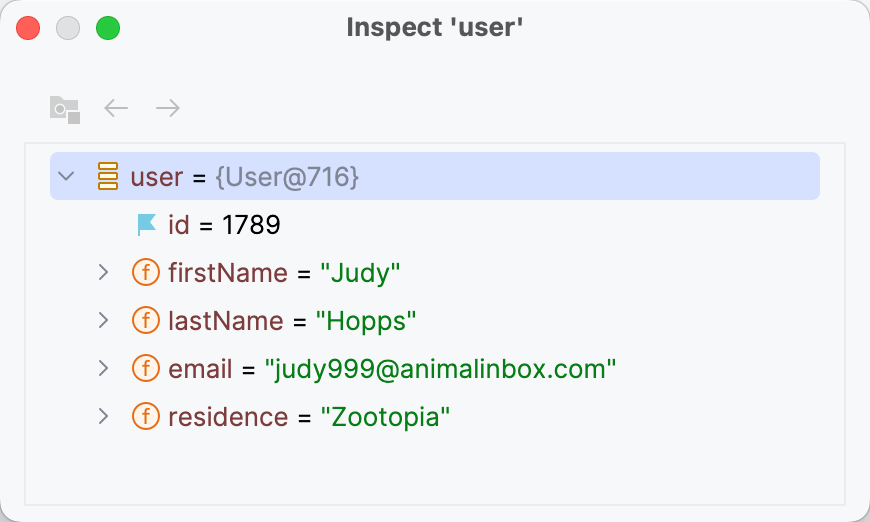
IntelliJ IDEA allows you to inspect variables in a dedicated dialog. This is useful when you need to keep track of some variable (or the object whose reference it holds) and at the same time be able to navigate between frames and threads.
* Right-click a variable or a watch and select Inspect.
Procedure: Set variable values
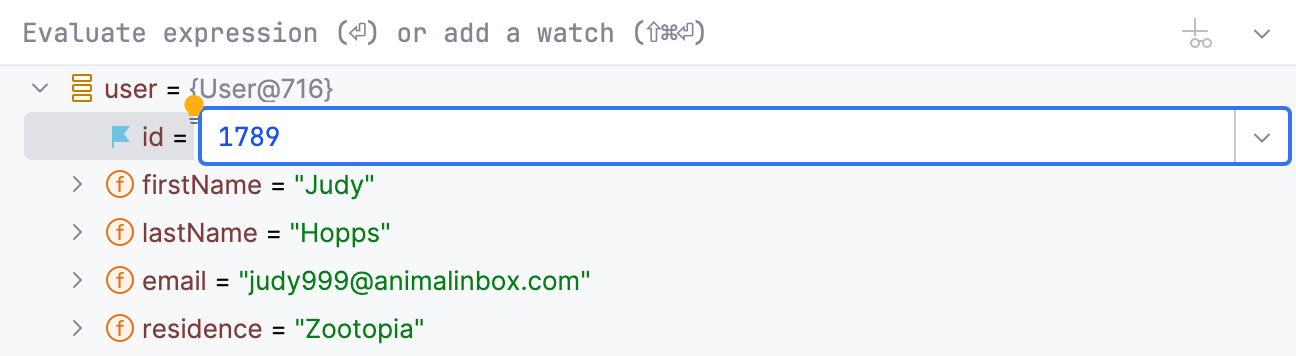
If you want to test how the program would behave with certain data or change its flow at runtime, you can achieve that by changing the variable values.
1. Select a variable and press `F2` (Windows), `F2` (macOS), `F2` (IntelliJ IDEA Classic (macOS)), `F2` (macOS System Shortcuts), `F2` (XWin), `F2` (GNOME), `F2` (KDE), `F2` (Emacs), `F2` (Sublime Text), `F2` (Sublime Text (macOS)), `F2` (NetBeans), `F2` (Visual Studio), `F2` (Visual Studio (macOS)), `F2` (Eclipse), `F2` (Eclipse (macOS)). Alternatively, select Set Value from the context menu.
2. Enter the value for the variable and press `Enter` (Windows), `⏎` (macOS), `⏎` (IntelliJ IDEA Classic (macOS)), `⏎` (macOS System Shortcuts), `Enter` (XWin), `Enter` (GNOME), `Enter` (KDE), `Enter` (Emacs), `Enter` (Sublime Text), `⏎` (Sublime Text (macOS)), `Enter` (NetBeans), `Enter` (Visual Studio), `⏎` (Visual Studio (macOS)), `Enter` (Eclipse), `⏎` (Eclipse (macOS)).
instance="rm"/>
Procedure: Navigate to source code
You can navigate to declarations from the Variables pane.
* To navigate to the code where the variable is declared, right-click the variable and select Jump to Source `F4` (Windows), `⌘ ↓` (macOS), `F4` (IntelliJ IDEA Classic (macOS)), `F4` (macOS System Shortcuts), `F4` (XWin), `F4` (GNOME), `F4` (KDE), `F4` (Emacs), `F4` (Sublime Text), `F4` (Sublime Text (macOS)), `F4` (NetBeans), `F4` (Visual Studio), `⌘ ↓` (Visual Studio (macOS)), `F12` (Eclipse), `F3` (Eclipse (macOS)).

* To navigate to the class declaration of the variable type, right-click the variable and select Jump to Type Source `Shift+F4` (Windows), `⇧ F4` (macOS), `⇧ F4` (IntelliJ IDEA Classic (macOS)), `⇧ F4` (macOS System Shortcuts), `Shift+F4` (XWin), `Shift+F4` (GNOME), `Shift+F4` (KDE), `Shift+F4` (Emacs), `Shift+F4` (Sublime Text), `Shift+F4` (Sublime Text (macOS)), `Shift+F4` (NetBeans), `Shift+F4` (Visual Studio), `⇧ F4` (Visual Studio (macOS)), `Shift+F4` (Eclipse), `⇧ F4` (Eclipse (macOS)).

* To navigate to a method body from a stack trace element, click Navigate near the stack trace element on the Variables pane.

Procedure: Examine incoming references
IntelliJ IDEA provides you with the information on the currently existing objects, which hold a reference to the objects on the Variables tab. The feature also detects indirect references, like those in anonymous classes using outside variables.
* To view the list of referring objects, right-click a variable on the Variables tab and select Show Referring Objects.
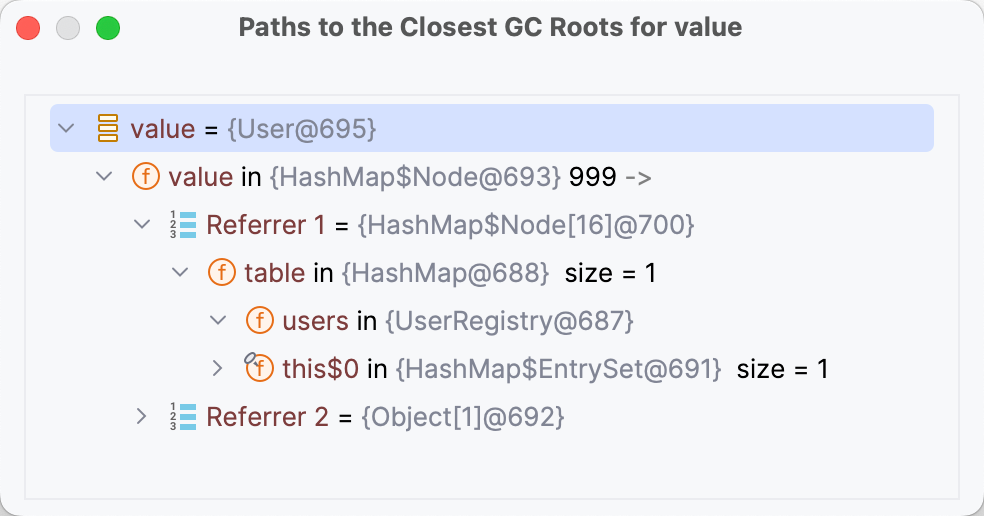
The Referring Objects dialog opens, allowing you to inspect the references to the selected object and trace reference chains down to the GC roots.
When you need the summary on all existing objects of some type, you can get it using the [Memory](analyze-objects-in-the-jvm-heap.html) tab of the Debug tool window.
## Browse collections' contents
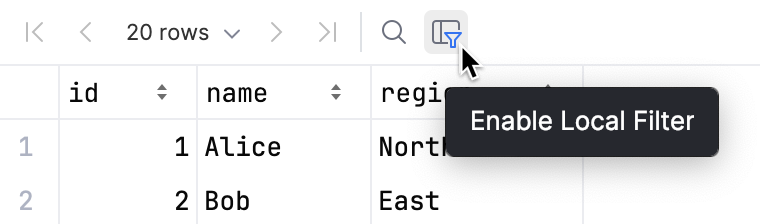
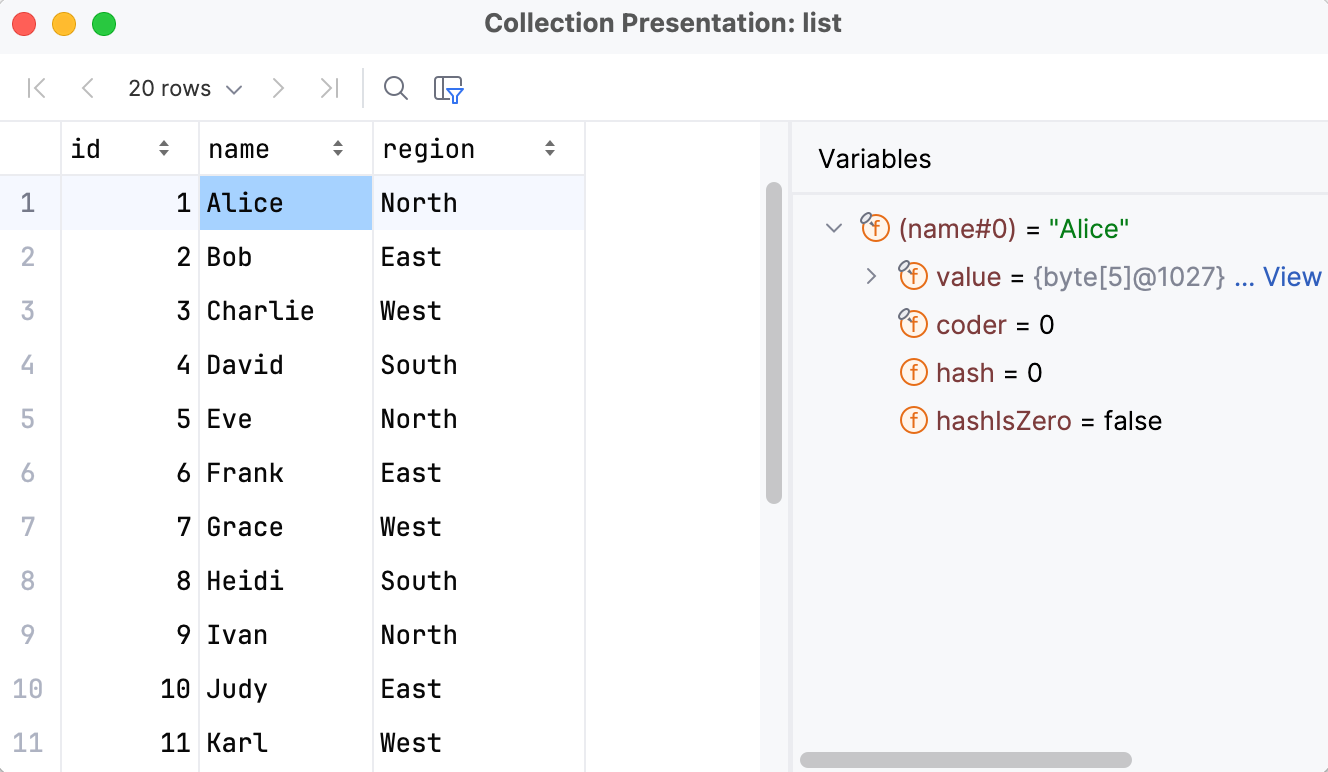
For arrays and lists, you can get a paginated list of entries along with a structure view for inspecting individual objects.
Procedure:
1. In the Variables view or in the editor, click View near a collection object.
2. For custom sorting or filtering, use the icons in the column headers and the dialog's toolbar.
## Evaluate expressions
IntelliJ IDEA lets you evaluate expressions during a debugging session to obtain additional details about the program state or test various execution scenarios at runtime.
> **Note:**
> When evaluating expressions, be mindful of variable scope and lifetime. All expressions are evaluated in the context of the current execution point.
This feature only works if the program was suspended after hitting a breakpoint(not [paused](starting-the-debugger-session.html#pause-resume) ).
If there are breakpoints inside methods called within the expression, they will be ignored.
### Evaluate a simple expression in the editor
To quickly evaluate an expression, point at it in the editor. Note that method calls cannot be evaluated this way.
Procedure:
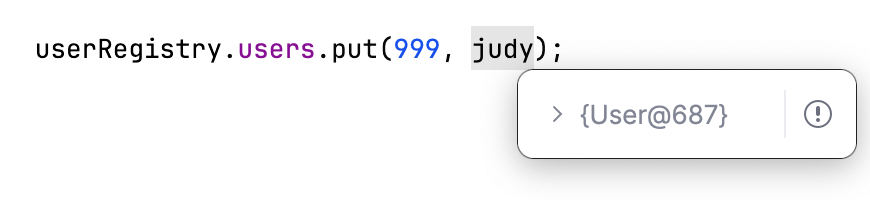
1. Point at the expression you want to evaluate. The result of the expression appears in a tooltip.
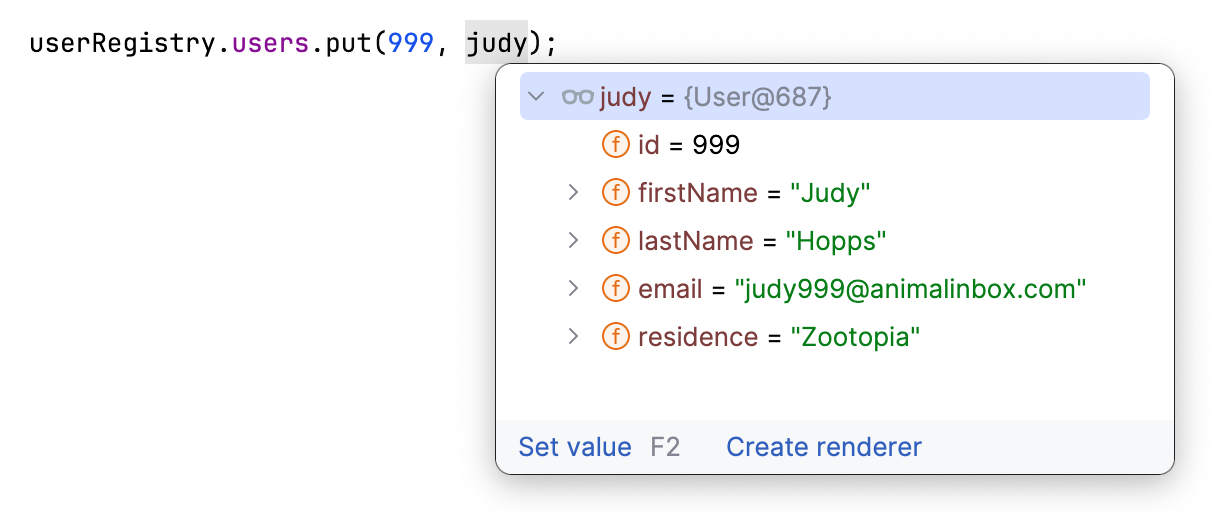
2. To view child elements of the resulting object, click  or press `Ctrl+F1` (Windows), `⌘ F1` (macOS), `⌘ F1` (IntelliJ IDEA Classic (macOS)), `⌘ F1` (macOS System Shortcuts), `Ctrl+F1` (XWin), `Ctrl+F1` (GNOME), `Ctrl+1` (KDE), `Ctrl+F1` (Emacs), `Ctrl+F1` (Sublime Text), `⌘ F1` (Sublime Text (macOS)), `Ctrl+F1` (NetBeans), `Ctrl+F1` (Visual Studio), `Ctrl+F1` (Visual Studio (macOS)), `Ctrl+F1` (Eclipse), `⌘ F1` (Eclipse (macOS)).
If you find value tooltips distracting, you can increase the delay or disable them altogether. To do this, in the Settings dialog (`Ctrl+Alt+S` (Windows), `⌘ Comma` (macOS), `⌘ Comma` (IntelliJ IDEA Classic (macOS)), `⌘ Comma` (macOS System Shortcuts), `Ctrl+Alt+S` (XWin), `Ctrl+Alt+S` (GNOME), `Ctrl+Alt+S` (KDE), `Ctrl+Alt+S` (Emacs), `Ctrl+Alt+S` (Sublime Text), `⌘ Comma` (Sublime Text (macOS)), `Ctrl+Alt+S` (NetBeans), `Ctrl+Alt+S` (Visual Studio), `⌘ Comma` (Visual Studio (macOS)), `Ctrl+Alt+S` (Eclipse), `⌘ Comma` (Eclipse (macOS))) , go to `Build, Execution, Deployment | Debugger | Data Views` and set the Show value tooltip and Value tooltip delay options according to your preference.
### Evaluate a complex expression in the editor
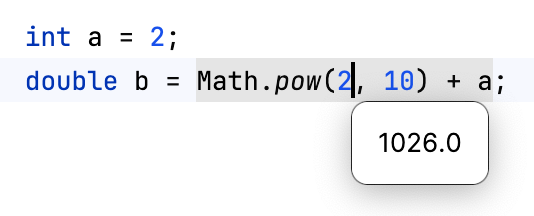
If you want to evaluate an expression in the code that involves a method call or indicate a specific portion of the expression to evaluate, use the Quick Evaluate Expression option.
Procedure:
* Hold `Alt` (Windows), `Alt` (macOS), `Alt` (IntelliJ IDEA Classic (macOS)), `Alt` (macOS System Shortcuts), `Alt` (XWin), `Alt` (GNOME), `Alt` (KDE), `Alt` (Emacs), `Alt` (Sublime Text), `Alt` (Sublime Text (macOS)), `Alt` (NetBeans), `Alt` (Visual Studio), `Alt` (Visual Studio (macOS)), `Alt` (Eclipse), `Alt` (Eclipse (macOS)) and click the expression you want to evaluate.
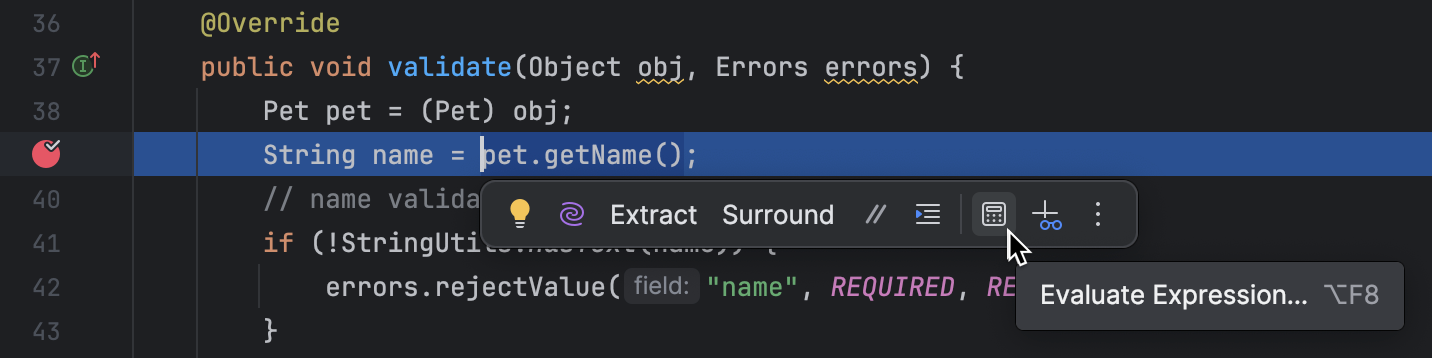
* Alternatively, select the expression then press `Ctrl+Alt+F8` (Windows), `⌘ ⌥ F8` (macOS), `⌘ ⌥ F8` (IntelliJ IDEA Classic (macOS)), `⌘ ⌥ F8` (macOS System Shortcuts), `Ctrl+Alt+8` (XWin), `Ctrl+Alt+8` (GNOME), `Ctrl+Alt+8` (KDE), `Ctrl+Alt+F8` (Emacs), `Ctrl+Alt+F8` (Sublime Text), `⌘ ⌥ F8` (Sublime Text (macOS)), `Ctrl+Alt+F8` (NetBeans), `Ctrl+Alt+F8` (Visual Studio), `⌘ ⌥ F8` (Visual Studio (macOS)), `Ctrl+Alt+F8` (Eclipse), `⌘ ⌥ F8` (Eclipse (macOS)) or select Evaluate Expression from the floating toolbar that appears.
> **Tip:**
> When calling methods, make sure you are aware of their possible side effects (for example, changes to an outside variable), as they may alter the program flow or result.
>
>
>
>
>
>
> ```JAVA
> int hasSideEffects() {
> // returns the number of entries in the list
> someVariable++;
> return list.size();
> }
> ```
>
>
>
> In the example, the value of `someVariable` will increment each time this `hasSideEffects()` is evaluated, which may affect the behavior of the program.
You can configure Quick Evaluate Expression to work for a piece of code on just selecting it (without using the menu/shortcut). Use this option carefully, as you can accidentally call methods when it is enabled.
Procedure: Evaluate expressions on selecting code
* Go to `Settings | Build, Execution, Deployment | Debugger | Data Views` and set the Show value tooltip on code selection option.
### Evaluate arbitrary expressions
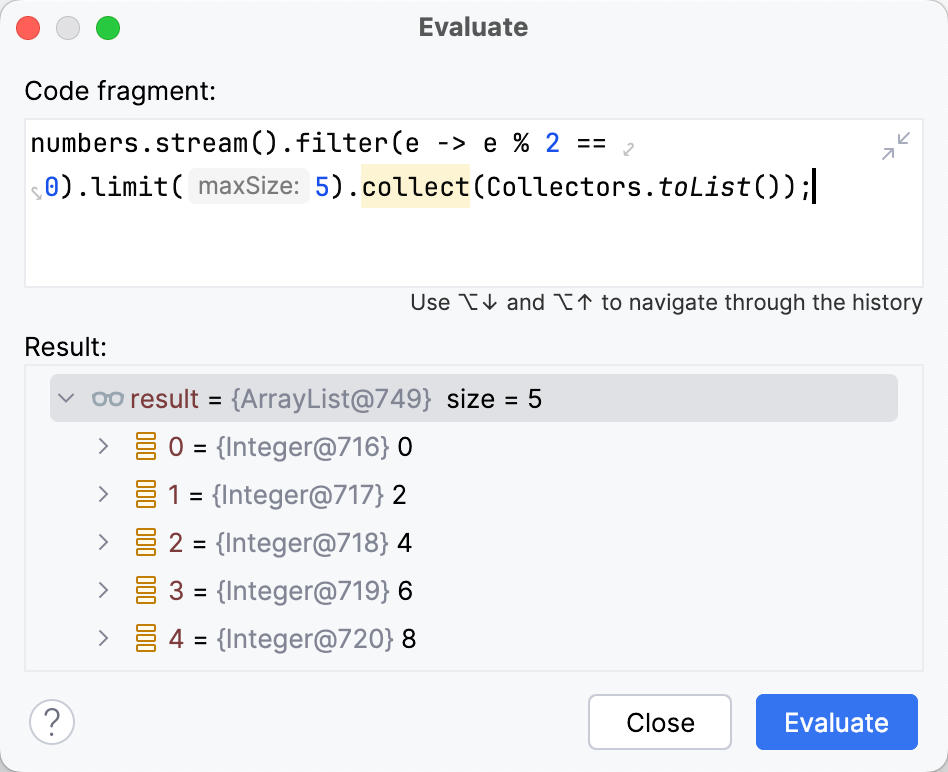
Evaluating arbitrary expressions is the most flexible evaluating option. It lets you evaluate any custom code as long as it is in the context of the current frame. Using it, you can evaluate declarations, method calls, switch expressions, anonymous classes, lambdas, loops, and so on.
Procedure:
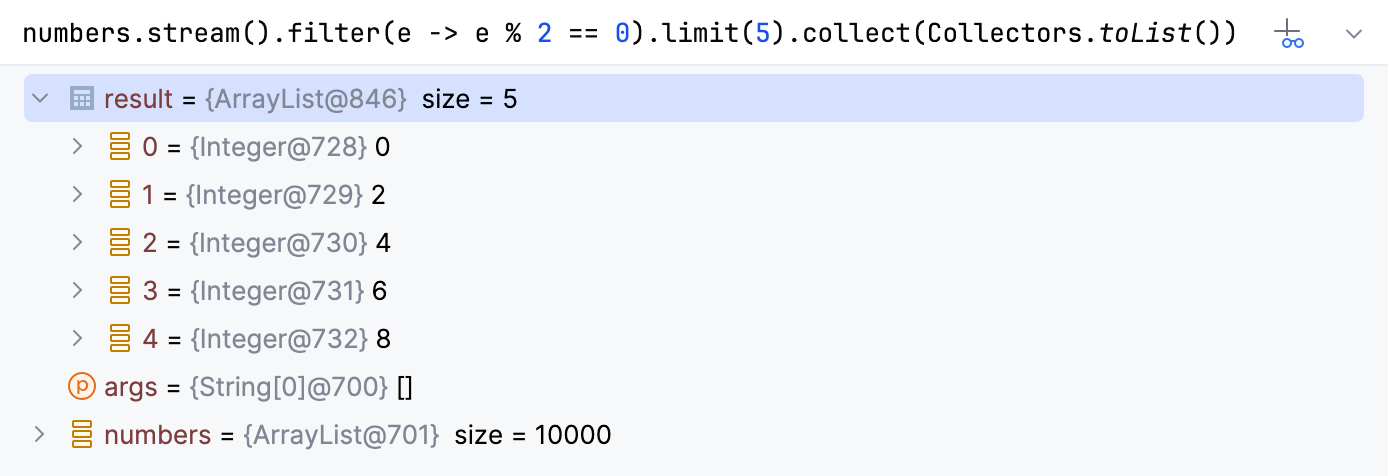
1. To evaluate an arbitrary expression, enter it in the Evaluate expression field in the Variables pane and press `Enter` (Windows), `⏎` (macOS), `⏎` (IntelliJ IDEA Classic (macOS)), `⏎` (macOS System Shortcuts), `Enter` (XWin), `Enter` (GNOME), `Enter` (KDE), `Enter` (Emacs), `Enter` (Sublime Text), `⏎` (Sublime Text (macOS)), `Enter` (NetBeans), `Enter` (Visual Studio), `⏎` (Visual Studio (macOS)), `Enter` (Eclipse), `⏎` (Eclipse (macOS))

2. The result is displayed right below. You can also [add the expression to watches](#watches) by clicking  in the right-hand part of the expression field.
If you want to evaluate long code blocks, you may want to use a dedicated dialog for that:
Procedure: Evaluate expressions in a dedicated dialog
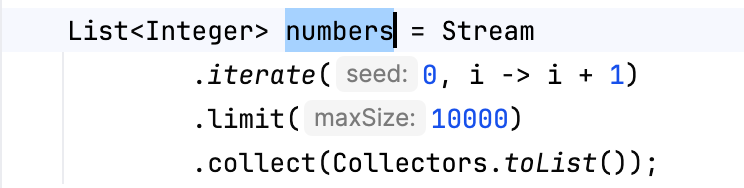
1. If you want to start with some expression or a variable, which is currently in front of you (for example, in the editor or on the Variables pane), select it.
2. Go to `Run | Debugging Actions | Evaluate Expression` `Alt+F8` (Windows), `⌥ F8` (macOS), `⌥ F8` (IntelliJ IDEA Classic (macOS)), `⌘ ⌃ L` (macOS System Shortcuts), `Alt+F8` (XWin), `Alt+Shift+8` (GNOME), `Alt+Shift+8` (KDE), `Alt+F8` (Emacs), `Alt+F8` (Sublime Text), `⌥ F8` (Sublime Text (macOS)), `Ctrl+F9` (NetBeans), `Shift+F9` (Visual Studio), `⇧ F9` (Visual Studio (macOS)), `Ctrl+U` (Eclipse), `⌘ U` (Eclipse (macOS)) or select Evaluate Expression from the context menu. The shortcut may not work on Ubuntu (for correct operation, [adjust the shortcut configuration](configuring-keyboard-and-mouse-shortcuts.html)).
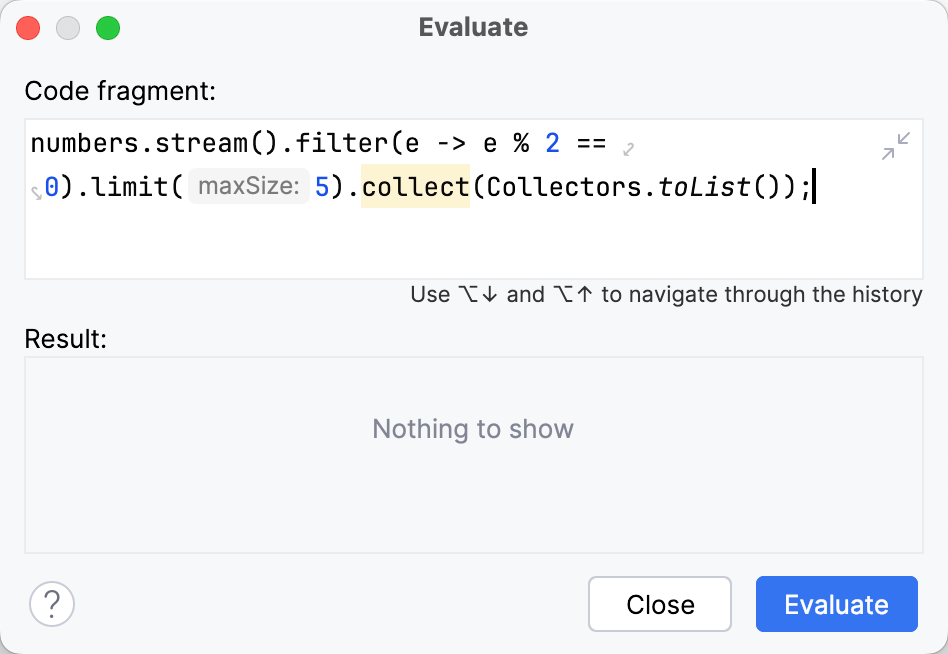
3. In the Evaluate dialog, modify the selected expression or enter a new one in the Expression field. Click Expand `Shift+Enter` (Windows), `⇧ ⏎` (macOS), `⇧ ⏎` (IntelliJ IDEA Classic (macOS)), `⇧ ⏎` (macOS System Shortcuts), `Shift+Enter` (XWin), `Shift+Enter` (GNOME), `Shift+Enter` (KDE), `Shift+Enter` (Emacs), `Shift+Enter` (Sublime Text), `⇧ ⏎` (Sublime Text (macOS)), `Shift+Enter` (NetBeans), `Shift+Enter` (Visual Studio), `⇧ ⏎` (Visual Studio (macOS)), `Ctrl+NumPad -` (Eclipse), `⌘ NumPad -` (Eclipse (macOS)) to modify a multiline code fragment.
> **Note:**
> Keep in mind that any variables declared in the body of the expression go out of scope after the expression has been evaluated.
4. Click Evaluate ( `Ctrl+Enter` (Windows), `⌘ ⏎` (macOS), `⌘ ⏎` (IntelliJ IDEA Classic (macOS)), `⌘ ⏎` (macOS System Shortcuts), `Ctrl+Enter` (XWin), `Ctrl+Enter` (GNOME), `Ctrl+Enter` (KDE), `Ctrl+Enter` (Emacs), `Ctrl+Enter` (Sublime Text), `⌘ ⏎` (Sublime Text (macOS)), `Ctrl+Enter` (NetBeans), `Ctrl+Enter` (Visual Studio), `⌘ ⏎` (Visual Studio (macOS)), `Ctrl+Enter` (Eclipse), `⌘ ⏎` (Eclipse (macOS)) for multiline mode). The expression result appears in the Result field.
The result of the expression is taken from the return statement. When there is no return statement, the result is taken from the last line of code (it does not even have to be an expression: a single literal works too). When there is no valid line to take the value from, the result is `undefined`. If the specified expression cannot be evaluated, the Result field indicates the reason.
> **Tip:**
> When calling methods, make sure you are aware of their possible side effects (for example, changes to an outside variable), as they may alter the program flow or result.
>
>
>
>
>
>
> ```JAVA
> int hasSideEffects() {
> // returns the number of entries in the list
> someVariable++;
> return list.size();
> }
> ```
>
>
>
> In the example, the value of `someVariable` will increment each time this `hasSideEffects()` is evaluated, which may affect the behavior of the program.
The Evaluate dialog is non-modal, so you can switch the focus back to the editor to copy other variables and expressions. You can also open multiple Evaluate dialogs.
## View values inline
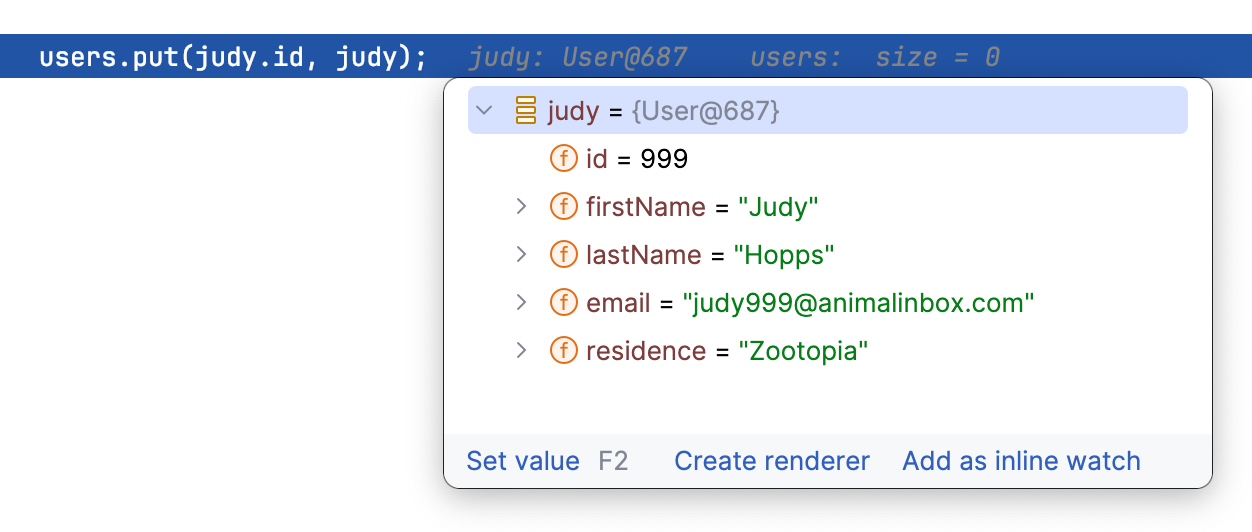
IntelliJ IDEA shows the values of the variables right next to their usage.

Once the variable value has changed, the inline view is updated with the new value and changes its color.

If a line contains a reference to an object, you can examine its fields right in the editor. From this popup, you can also [change the variable values](#setting-variable-values) , create [custom type
renderers](customizing-views.html#renderers), and [add inline watches](#inline-watch).
The inline view is enabled by default. To turn it off, in the Settings dialog (`Ctrl+Alt+S` (Windows), `⌘ Comma` (macOS), `⌘ Comma` (IntelliJ IDEA Classic (macOS)), `⌘ Comma` (macOS System Shortcuts), `Ctrl+Alt+S` (XWin), `Ctrl+Alt+S` (GNOME), `Ctrl+Alt+S` (KDE), `Ctrl+Alt+S` (Emacs), `Ctrl+Alt+S` (Sublime Text), `⌘ Comma` (Sublime Text (macOS)), `Ctrl+Alt+S` (NetBeans), `Ctrl+Alt+S` (Visual Studio), `⌘ Comma` (Visual Studio (macOS)), `Ctrl+Alt+S` (Eclipse), `⌘ Comma` (Eclipse (macOS))) , go to `Build, Execution, Deployment | Debugger | Data Views` and disable the Show values inline option.
Procedure: Add an Inline Watch
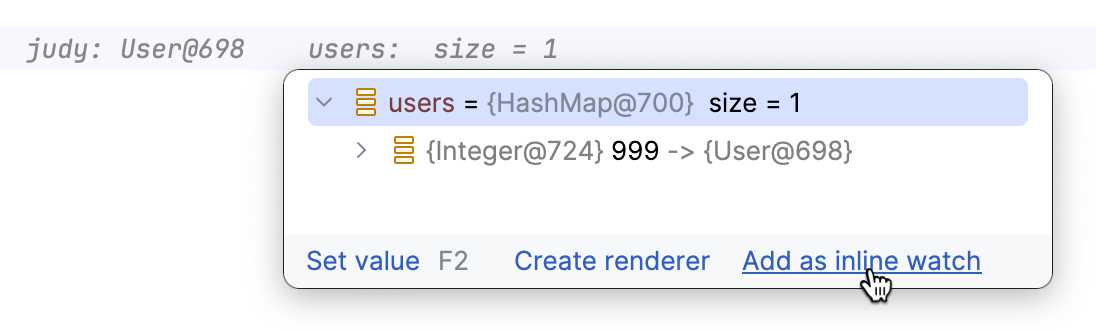
If you want the result of some expression to appear on a particular line, you can set up an inline [watch](#watches) for that. Inline watches are persistent and remain active after session restart.
1. Click the inline hint referring to the object whose field you want to track.
2. In the popup, select the field and click Add as Inline Watch.
3. Fine-tune the watch if needed. You can use any valid Java expression as a watch.

Inline watches you set in the editor are also shown under Inline Watches in the Variables tab of the Debug tool window.
To remove an inline watch, hover over the watch and click the cross near it.
### DFA-assisted debugging
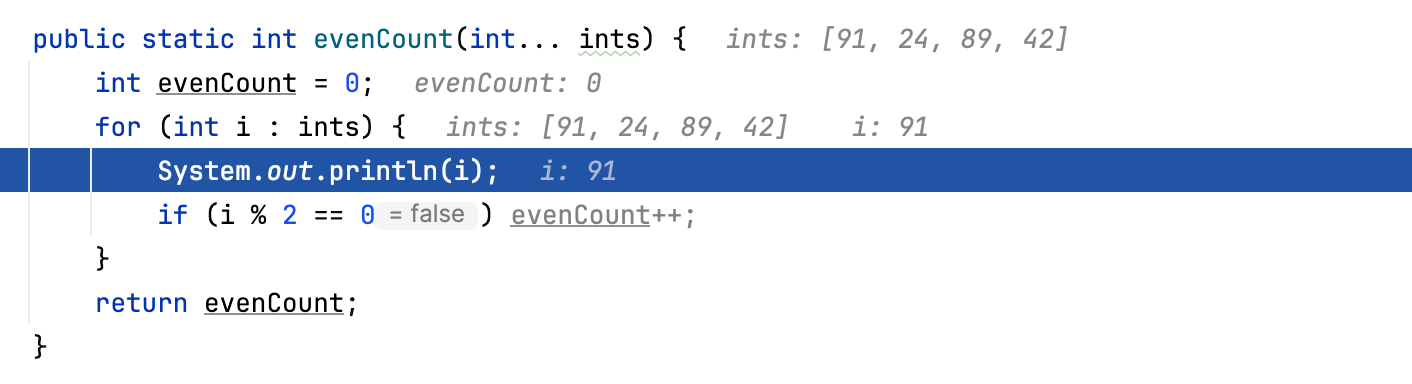
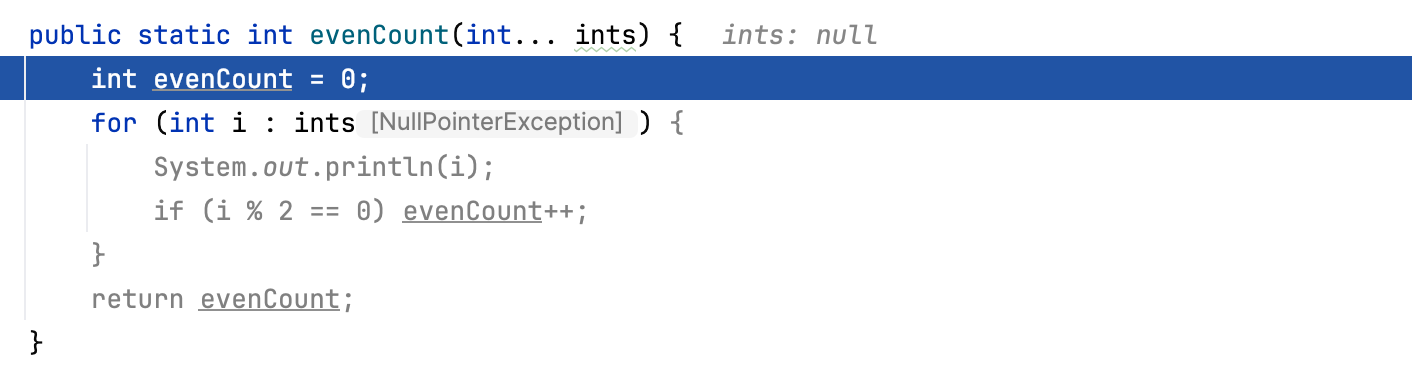
IntelliJ IDEA also provides hifnts on what is going to happen later in the executed piece of code. This analysis includes exceptions, boolean expression results, and code paths:
> **Note:**
> Future conditions/exceptions can only be analyzed for local debugging sessions.
To disable the analysis of further execution, go to `Build, Execution, Deployment | Debugger | Data Views | Java` and clear the Predict condition values and exceptions based on data flow analysis checkbox.
## Visualize JSON and XML
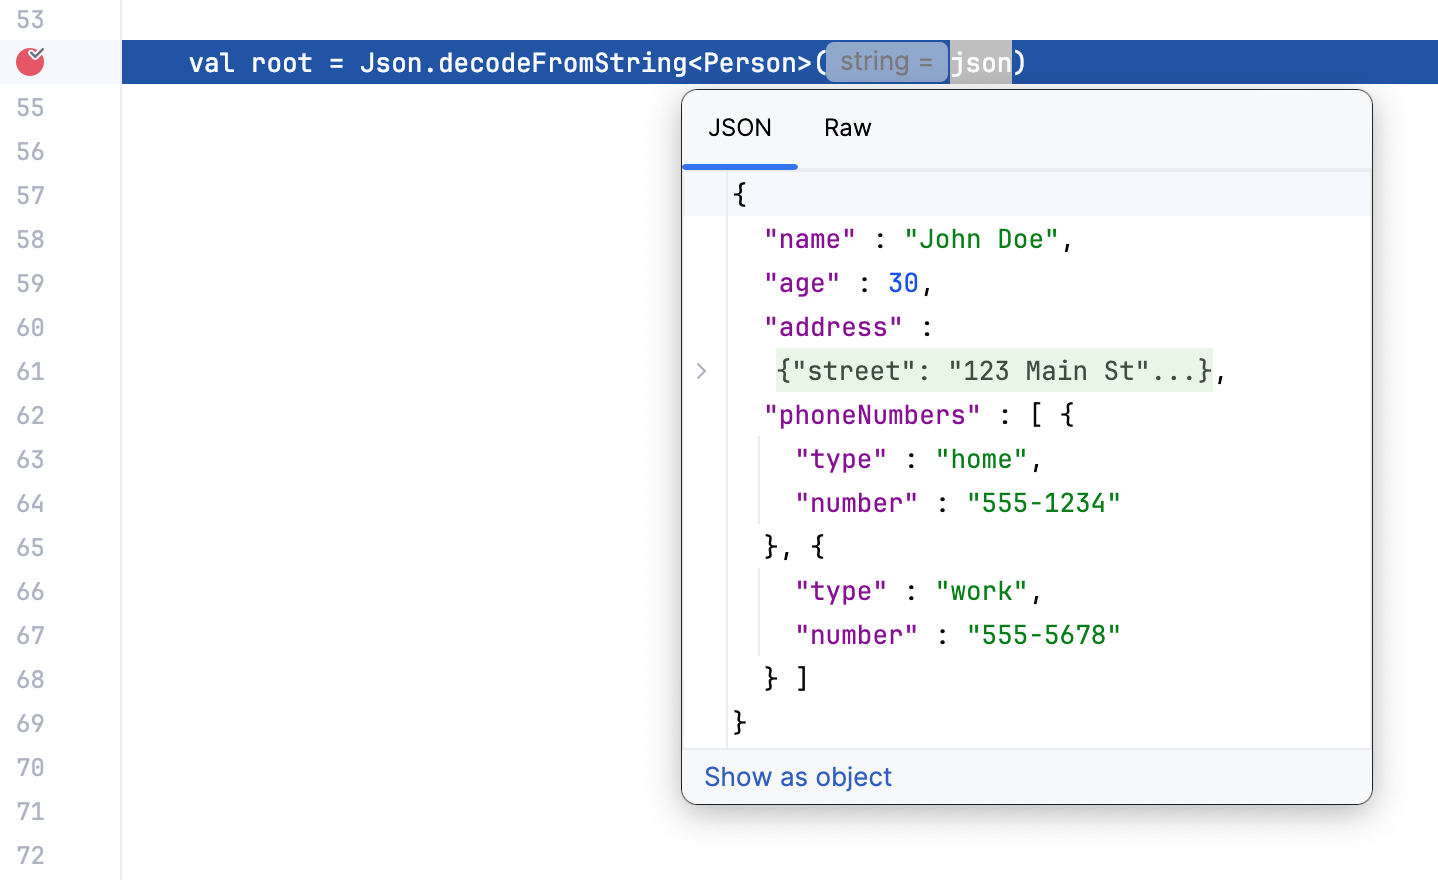
When you expand an [inline value](#inline-view) or [evaluate a string expression](#evaluating-expressions) that contains JSON or XML, IntelliJ IDEA gives you a structured and formatted view of the data.
This lets you use editor features like [code folding](https://www.jetbrains.com/guide/java/tips/expand-collapse-code/) and [extend or shrink selection](https://www.jetbrains.com/guide/java/tips/extend-selection/) for working with subtrees and convenient navigation in big objects.
Use the tabs in the preview popup to switch between the structured and raw view:
## Watches
> **Tip:**
> If you are looking for information on field watchpoints, refer to the [Breakpoints](using-breakpoints.html) topic.
If you want to keep track of some variable or the result of a more complex expression, set up a watch for this variable or expression. This is useful when you need to evaluate something that is not regularly displayed on the list of variables.
This feature only works if the program was suspended after hitting a breakpoint(not [paused](starting-the-debugger-session.html#pause-resume) ).
> **Tip:**
> When calling methods, make sure you are aware of their possible side effects (for example, changes to an outside variable), as they may alter the program flow or result.
>
>
>
>
>
>
> ```JAVA
> int hasSideEffects() {
> // returns the number of entries in the list
> someVariable++;
> return list.size();
> }
> ```
>
>
>
> In the example, the value of `someVariable` will increment each time this `hasSideEffects()` is evaluated, which may affect the behavior of the program.
Watches are evaluated in the context of the selected frame. Watches cannot be evaluated when they are out of context or when they fail to compile. If this is the case, the watch is marked with the error icon .
By default, watches are shown together with variables in the Variables pane. To hide/reveal the Watches pane, use the Separate watches option in the Layout Settings menu.
Procedure: Add a watch
Depending on the expression that you want to track:
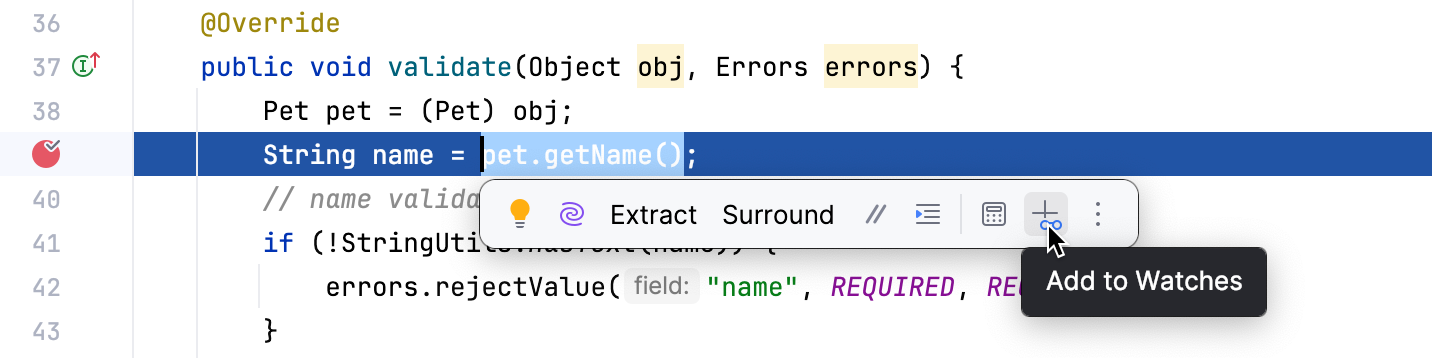
* For expressions in the editor – select the expression, then click the Add to Watches icon  on the floating toolbar that appears. Alternatively, drag the expression to the Variables tab.
* For elements in the current context – right-click a variable in the Variables tab and select Add to Watches from the menu.
* For arbitrary expressions – enter the expression in the top part of the Variables tab, then click Add to Watches.

If you only want the watch to be shown when an object of a particular type is inspected, you can set up a class-level watch for it.
Procedure: Add a class-level watch
* Right-click such object in the Variables pane and select New Class Level Watch.
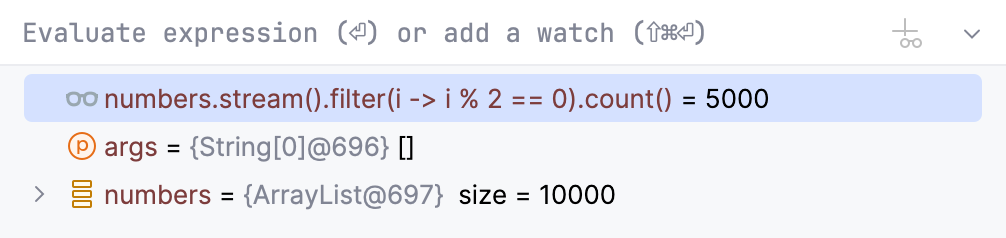
After you have added a variable/expression to Watches, it stays there and is evaluated for each [step](stepping-through-the-program.html), providing you with the result in the current context.
Procedure: Edit a watch
* Right-click the desired watch and select Edit.
Procedure: Delete a watch
* To remove a single watch, right-click it and select Remove Watch. Alternatively, select the watch and press `Delete` (Windows), `⌦` (macOS), `⌦` (IntelliJ IDEA Classic (macOS)), `⌦` (macOS System Shortcuts), `Delete` (XWin), `Delete` (GNOME), `Delete` (KDE), `Delete` (Emacs), `Delete` (Sublime Text), `⌦` (Sublime Text (macOS)), `Delete` (NetBeans), `Delete` (Visual Studio), `⌦` (Visual Studio (macOS)), `Delete` (Eclipse), `⌦` (Eclipse (macOS)).
* To remove all watches, right-click anywhere on the Variables/
Watches pane and select Remove All Watches.
Watches allow for the same actions as variables do. For example, you can [view them in a dedicated dialog](#view-in-a-dialog) or use them to [navigate to the source code](#navigate-to-source).
Watches are a part of your project. This means you can stop and rerun the debugging session without risk of losing them.
Procedure: Pause and resume watches
Sometimes, a watch may rely on local context or involve heavy computations, making its evaluation impractical for some steps. In such cases, you can pause the watch and evaluate it on demand.
* To pause a watch, right-click it and select Pause Watch.
* To resume a watch, right-click it and select Resume Watch.
* To perform a one-time evaluation of a paused watch, click Evaluate near the watch.
## Labels
During debugging, it is sometimes useful to mark some instance so that it is easily identifiable in any context. For this, you can add labels. Once attached, a label accompanies the object for its entire lifetime.
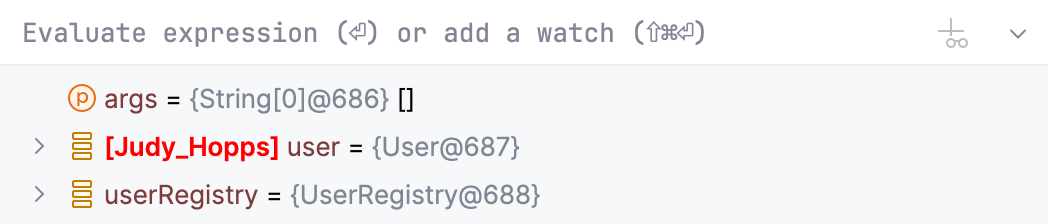
This is especially helpful where conditions or expressions are used – you can refer to that object by label instead of searching for the reference to this object.
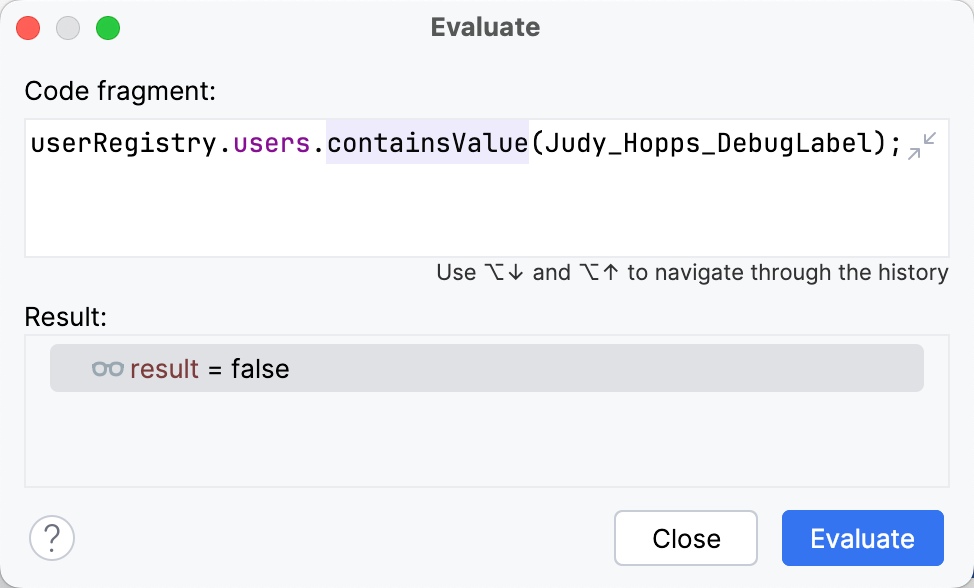
If you want to keep track of an instance regardless of the context, create a watch for this label. With this type of watch, the object is always at hand irrespective of the current frame and thread.
Procedure: Add label
1. On the Variables tab, right-click a variable or a watch which is currently referring to the object you want to track. From the menu, select Mark Object `F11` (Windows), `F3` (macOS), `F11` (IntelliJ IDEA Classic (macOS)), `⌃ ⇧ K` (macOS System Shortcuts), `F11` (XWin), `F11` (GNOME), `F11` (KDE), `F11` (Emacs), `Ctrl+F2` (Sublime Text), `⌘ F2` (Sublime Text (macOS)), `F11` (NetBeans), `Ctrl+K, K` (Visual Studio), `⌘ K, K` (Visual Studio (macOS)), `Ctrl+Shift+F11` (Eclipse), `F11` (Eclipse (macOS)).
2. Enter the name for the label. Optionally, you can select the display color. For this, click  and select the color. After you have finished with configuration, click OK.
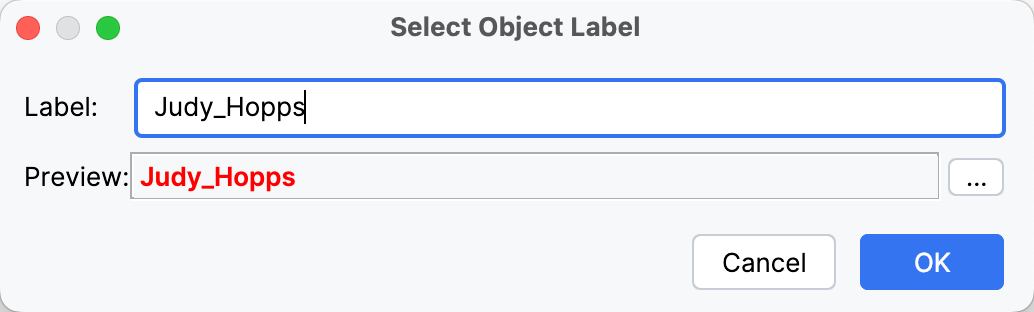
Procedure: Remove label
* Right-click the label that you want to remove and select Unmark Object `F11` (Windows), `F3` (macOS), `F11` (IntelliJ IDEA Classic (macOS)), `⌃ ⇧ K` (macOS System Shortcuts), `F11` (XWin), `F11` (GNOME), `F11` (KDE), `F11` (Emacs), `Ctrl+F2` (Sublime Text), `⌘ F2` (Sublime Text (macOS)), `F11` (NetBeans), `Ctrl+K, K` (Visual Studio), `⌘ K, K` (Visual Studio (macOS)), `Ctrl+Shift+F11` (Eclipse), `F11` (Eclipse (macOS)) from the menu.
## Execution point
### Return to the current execution point
Examining the program state involves navigating in code, and you often need to return to the place where your program is suspended.
Procedure:
Do one of the following:
* In the main menu, go to `Run | Debugging Actions | Show Execution Point`.
* Press `Alt+F10` (Windows), `⌥ F10` (macOS), `⌥ F10` (IntelliJ IDEA Classic (macOS)), `⌥ F10` (macOS System Shortcuts), `Alt+F10` (XWin), `Alt+Shift+0` (GNOME), `Alt+Shift+0` (KDE), `Alt+F10` (Emacs), `Alt+F10` (Sublime Text), `⌥ F10` (Sublime Text (macOS)), `Alt+F10` (NetBeans), `Alt+NumPad *` (Visual Studio), `⌥ NumPad *` (Visual Studio (macOS)), `Alt+F10` (Eclipse), `⌥ F10` (Eclipse (macOS)).
* Click  on the stepping toolbar of the Debug tool window and select  Show Execution Point from the context menu that opens.

## See also
### Procedures
[Debug code](debugging-code.html) [Debug tool window](debug-tool-window.html) [Start the debugger session](starting-the-debugger-session.html)