# Exploring Windows minidumps
> **Warning:**
> You can create Windows minidumps only on the Microsoft Windows operating system. But you can analyze and debug your application on all supported operating systems.
Windows minidump files record the state of a program as it is running, or as at the moment of a crash. To read a minidump file, you must have the binaries of your application and the dump file.
Procedure: Create a binary file of your application
1. Open the Run/Debug Configuration dialog in one of the following ways:
* Select `Run | Edit Configurations` from the main menu.
* With the [Navigation bar](guided-tour-around-the-user-interface.html#navigation-bar) visible (`View | Appearance | Navigation Bar`), choose `Edit Configurations` from the run/debug configuration selector.
* Press `Alt+Shift+F10` (Windows), `⌃ ⌥ R` (macOS), `⌥ ⇧ F10` (IntelliJ IDEA Classic (macOS)), `⌃ ⌥ R` (macOS System Shortcuts), `Alt+Shift+F10` (XWin), `Alt+Shift+F10` (GNOME), `Alt+Shift+F10` (KDE), `Alt+Shift+F10` (Emacs), `Alt+Shift+F10` (Sublime Text), `⌃ ⌥ R` (Sublime Text (macOS)), `Alt+Shift+F10` (NetBeans), `Ctrl+Alt+Shift+R` (Visual Studio), `⌘ ⌥ ⇧ R` (Visual Studio (macOS)), `Alt+Shift+F10` (Eclipse), `⌃ ⌥ R` (Eclipse (macOS)) and then press `0` (Windows), `0` (macOS), `0` (IntelliJ IDEA Classic (macOS)), `0` (macOS System Shortcuts), `0` (XWin), `0` (GNOME), `0` (KDE), `0` (Emacs), `0` (Sublime Text), `0` (Sublime Text (macOS)), `0` (NetBeans), `0` (Visual Studio), `0` (Visual Studio (macOS)), `0` (Eclipse), `0` (Eclipse (macOS)).
2. In the [Run/Debug Configuration](run-debug-configurations-dialog.html) dialog, click the Add New Configuration icon () on the toolbar or press `Alt+Insert` (Windows), `⌘ N` (macOS), `⌃ N` (IntelliJ IDEA Classic (macOS)), `⌘ N` (macOS System Shortcuts), `Alt+Insert` (XWin), `Alt+Insert` (GNOME), `Alt+Insert` (KDE), `Alt+Insert` (Emacs), `Ctrl+N` (Sublime Text), `⌘ N` (Sublime Text (macOS)), `Alt+Insert` (NetBeans), `Ctrl+N` (Visual Studio), `⌘ N` (Visual Studio (macOS)), `Alt+Insert` (Eclipse), `⌘ N` (Eclipse (macOS)). The list shows the default run/debug configurations. Select the desired configuration type (for example, Go build).
The fields that appear in the right-hand pane display the default settings for the selected configuration type.
3. In the Name field, type the configuration name.
4. In the Files field, add the name of the file that you want to run (for example, `main.go`).
5. In the Output Directory field, specify the path where you want to store the created binary file.
6. Apply the changes and close the dialog.
Procedure: Create the minidump file on Windows
1. Start the application and use it as usual.
You can run the generated EXE file or run the application from IntelliJ IDEA. To run the application from IntelliJ IDEA, click the Run icon  in the gutter near the main function and select Run 'go build '.
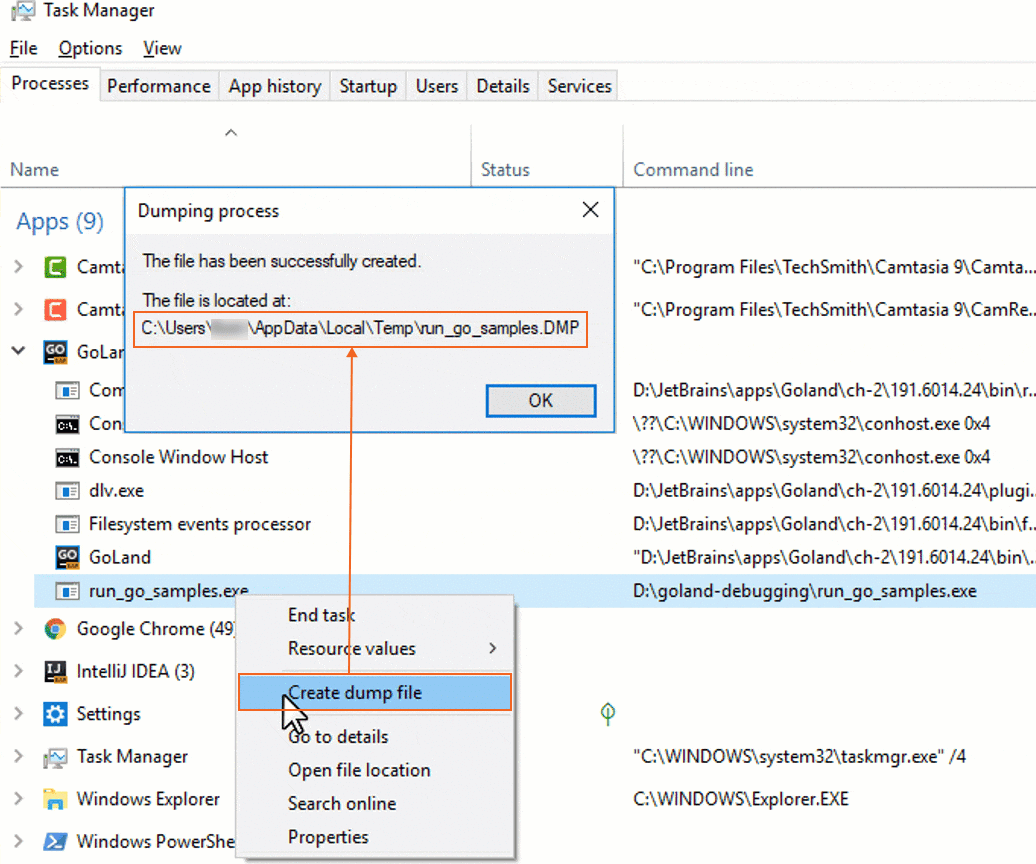
2. Open the Windows Task Manager `Ctrl+Alt+Delete`, click the Processes tab.
3. Right-click your application and select Create dump file.
Procedure: Open the minidump file in IntelliJ IDEA
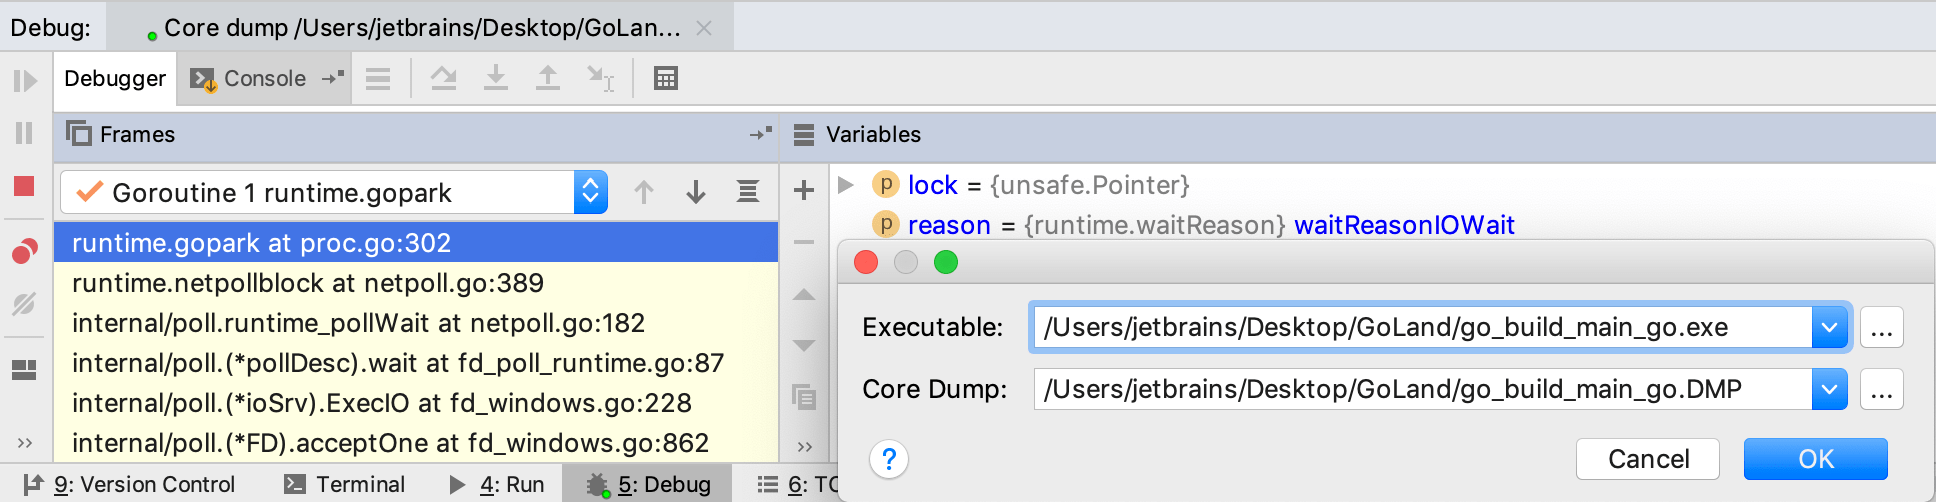
1. Navigate to `Run | Open Core Dump`.
2. In the Executable field, specify a path to the `EXE` file.
3. In the Core Dump field, specify a path to the dump file.
4. Click OK.