# Run/Debug Configuration: NPM
> **TL;DR**
> Required plugins:
>
>
>
> `JavaScript and TypeScript` - the plugin is bundled with IntelliJ IDEA and enabled by default.
>
>
>
> `Node.js` - install the plugin on the Settings | Plugins page, tab Marketplace. The plugin is available only in IntelliJ IDEA with the Ultimate subscription.
Create: `Run | Edit Configurations |`  `| NPM`
In this dialog, create configurations for running [npm](https://docs.npmjs.com/misc/scripts) and [Yarn](https://yarnpkg.com/en/) scripts locally. "Locally" in the current context means that IntelliJ IDEA itself starts Node.js installed on your computer, whereupon initiates script execution.
Learn more from [npm, pnpm, and Yarn](installing-and-removing-external-software-using-node-package-manager.html).
If a script launches an application in the development mode, you can modify the configuration, so it also starts a debugging session. To do that, go to the [Browser / Live
Edit tab](#run_configurations_npm_browser_live_edit_tab) and specify there the URL address at which the application will run. Learn more from [Run and debug an Angular application with a single npm run/debug configuration](run-and-debug-angular-applications.html#angular_debug_two_rc), [Run and debug a Vue.js application with a single npm run/debug configuration](vue-js.html#vue_debug_two_rc), and [Run and debug a Vite application with a single npm run/debug configuration](vite.html#vite_debug_two_rc).
## Before you start
Procedure:
1. Download and install [Node.js](http://nodejs.org/#download). Note that npm is also installed so if you are going to use it, you are through with the preliminary steps.
2. To use Yarn, install it as described on the [Yarn official website](https://yarnpkg.com/en/docs/install).
## Configuration tab
| Item | Description |
| --- | --- |
| package.json | In this field, specify the `package.json` file to run the scripts from. Choose the file from the drop-down list which shows all the `package.json` files detected in the current project or click  and choose the required `package.json` in the dialog that opens. |
| Command | From this list, choose the npm CLI command to execute, by default `run-script` is selected. Learn more at [npm documentation](https://docs.npmjs.com/), under the section CLI Commands. |
| Scripts | From this drop-down list, choose the script to which the chosen command will be applied. The list contains all the scripts defined within the `scripts` property in the `package.json` file. |
| Arguments | In this field, specify the command-line arguments to execute a script with. Learn more from the [npm official website](https://docs.npmjs.com/cli/v10/commands/npm-run-script?utm_source=chatgpt.com). |
| Node runtime | In this field, specify the Node.js runtime to use. If you choose the Project alias, IntelliJ IDEA will automatically use the project default interpreter from the Node runtime field on the [JavaScript Runtime](javascript-runtime.html) page . In most cases, IntelliJ IDEA detects the project default runtime and fills in the field itself. You can also choose another configured local or remote interpreter or click  and configure a new one. |
| Node Options | In this field, type the Node.js-specific command-line options to be passed to the Node.js executable file. The acceptable options are: * Use `--require coffeescript/register` to have CoffeeScript files compiled into JavaScript on the fly during run. This mode requires that the `register.js` file, which is a part of the `coffeescript` package, is located inside your project. Therefore, make sure you have the `coffeescript` package installed locally as described in [Install the CoffeeScript compiler](coffeescript.html#ws_coffee_installation). * Use `--inspect` or `--inspect-brk` parameter for [Chrome Debugging Protocol](https://developer.chrome.com/devtools/docs/debugger-protocol) support. |
| Package manager | In this field. specify the package manager to use. If you choose the `Project` alias, IntelliJ IDEA will use the default project package manager from the [JavaScript Runtime](javascript-runtime.html) page. You can also choose the relevant package alias (npm or yarn) or specify an explicit path to a custom installation of a package manager. |
| Environment Variables | In this field, specify the custom [environment variables](https://www.w3schools.com/nodejs/nodejs_environment.asp) for the Node.js executable file. The definitions of variables are displayed in the Environment variables field with semicolons (`;`) as separators, for example: * `NODE_PATH` A list of additional directories to search when resolving modules. To separate directories in a list, use colon (`:`) on macOS or Linux, use semicolon (`;`) on Windows. * `NODE_MODULE_CONTEXTS` Set to 1 to load modules in their own global contexts. * `NODE_DISABLE_COLORS` Set to 1 to disable colors in the REPL. 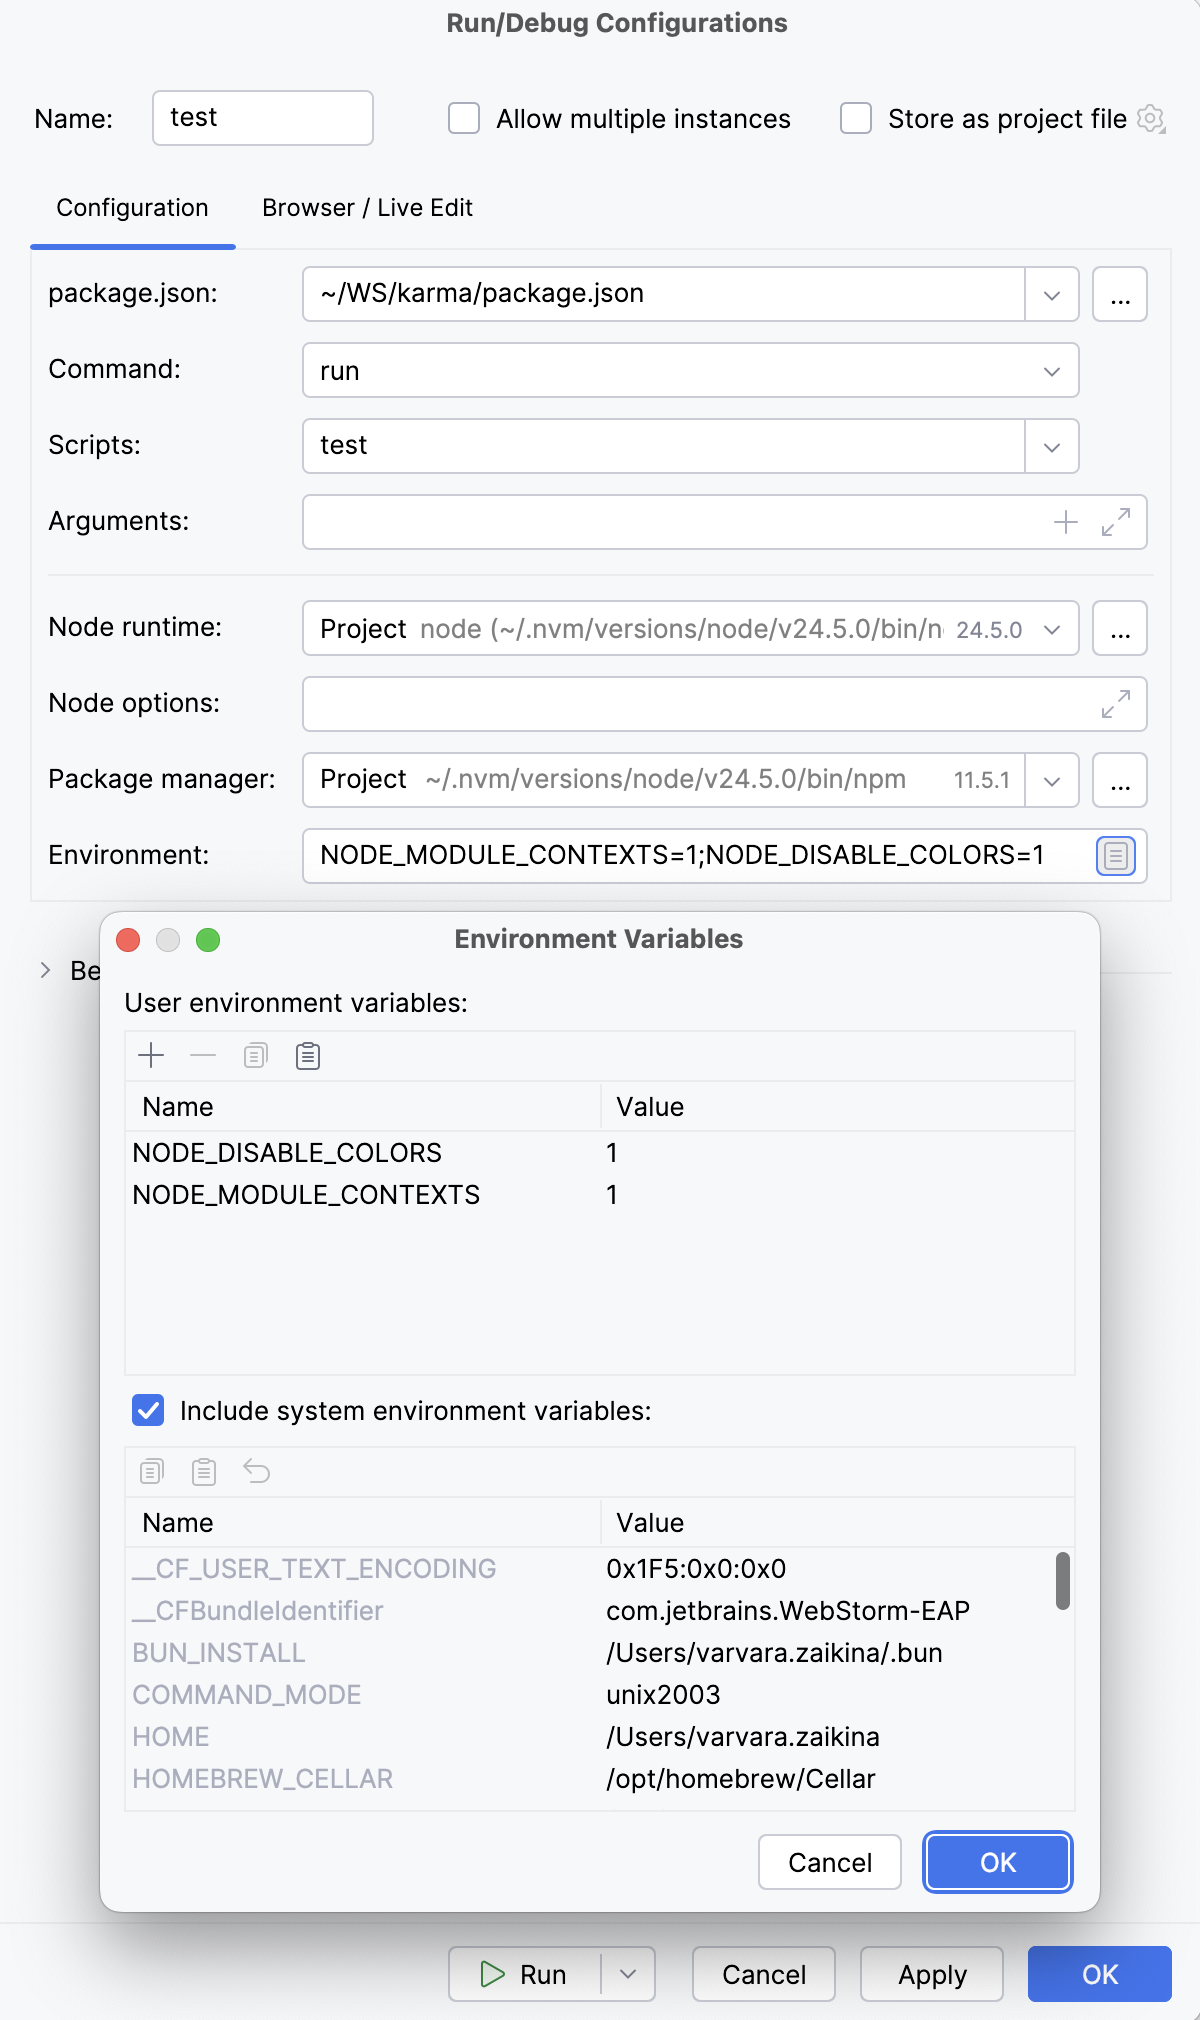 Alternatively, click Browse  to the right of the field and configure a list of variables in the Environment Variables dialog, that opens: * Use , ,  and  buttons to manage the list of custom variables. * The dialog also shows a list of available system environment variables. Clear the Include system environment variables checkbox if you don't want to use the system environment variables for the current configuration. * Click OK, when ready. |
| Docker container settings | This read-only field shows port and volume bindings. Click  to open the command preview. > **Warning:** > This field only appears when a [Docker-based remote interpreter](node-with-docker.html#ws_node_docker_configure_remote_interpreter_preferences_remote_interpreters_dialog) is selected. 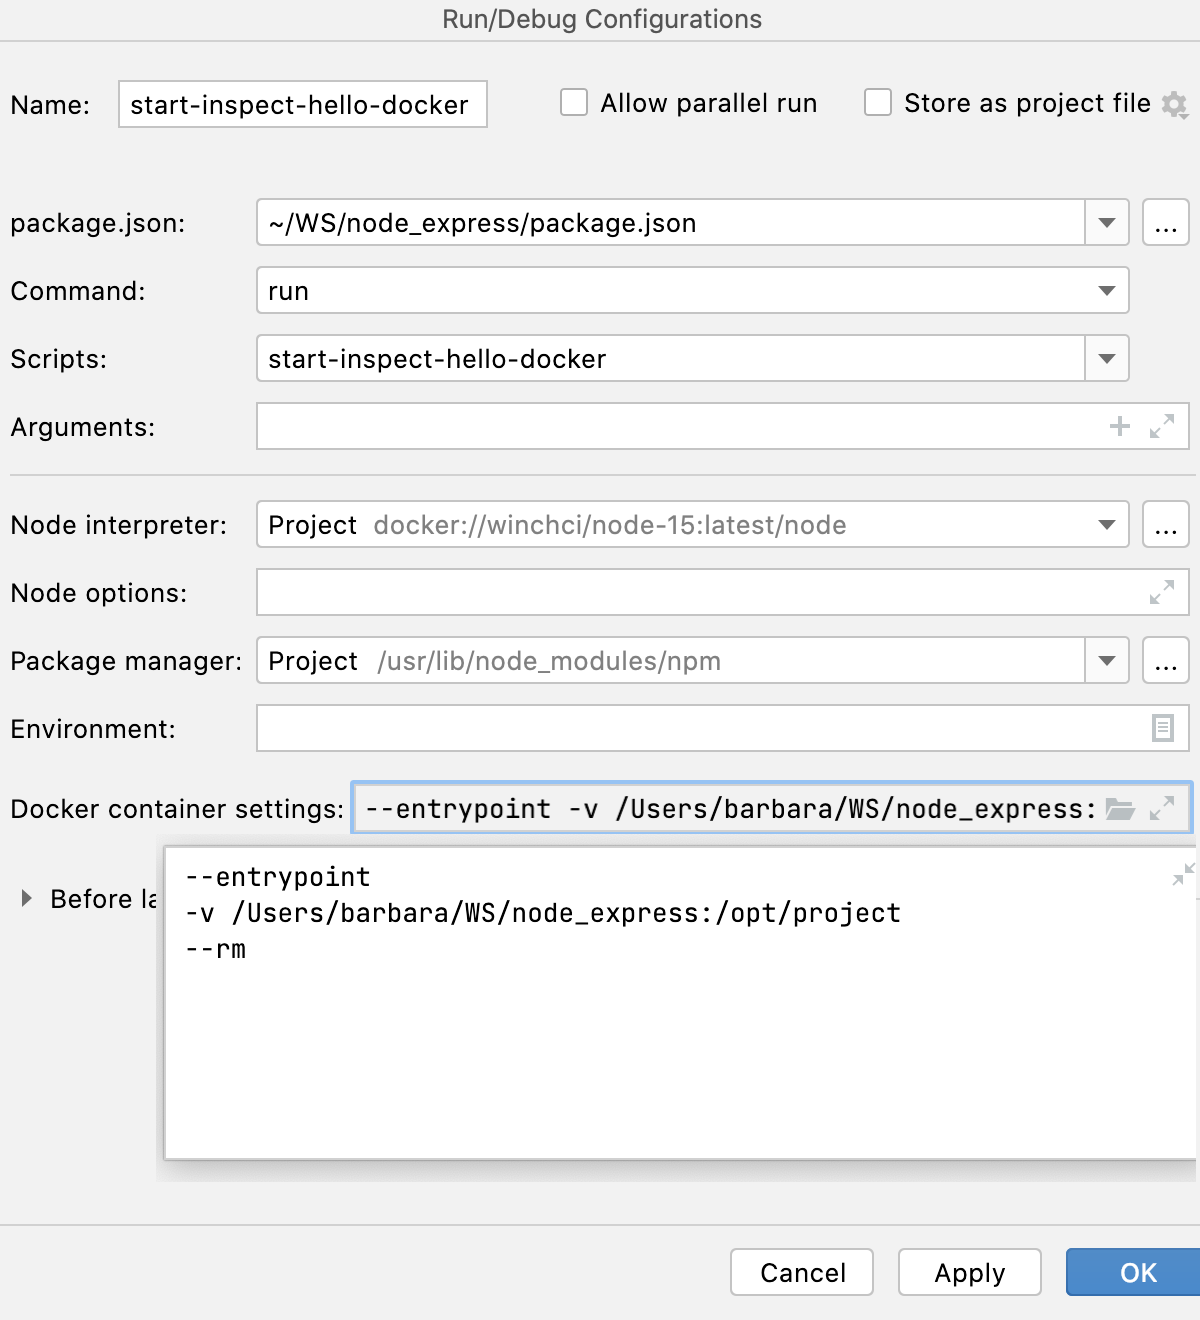 |
| Docker Compose | In this area, specify the commands and options to be passed to Docker Compose. Accept the default settings or click  and specify custom ones, for example, custom Docker Compose flags, like `--rm` or `--service-ports`. Learn more from the [Docker official website](https://docs.docker.com/compose/reference/). Check the Command Preview. > **Warning:** > This field only appears when a [remote runtime via Docker > Compose](node-with-docker-compose.html#ws_node_docker_compose_configure_interpreter) is selected. |
### Common settings
When you edit a run configuration (but not a run configuration template), you can specify the following options:
| Item | Description |
| --- | --- |
| Name | Specify a name for the run configuration to quickly identify it among others when editing or running. |
| Allow multiple instances | Allow running multiple instances of this run configuration in parallel. By default, it is disabled, and when you start this configuration while another instance is still running, IntelliJ IDEA suggests stopping the running instance and starting another one. This is helpful when a run configuration consumes a lot of resources and there is no good reason to run multiple instances. |
| Store as project file | Save the file with the run configuration settings to share it with other team members. The default location is `.idea/runConfigurations`. However, if you do not want to share the `.idea` directory, you can save the configuration to any other directory within the project. By default, it is disabled, and IntelliJ IDEA stores run configuration settings in `.idea/workspace.xml`. |
### Toolbar
The tree view of run/debug configurations has a toolbar that helps you manage configurations available in your project as well as adjust default configurations templates.
| Item | Shortcut | Description |
| --- | --- | --- |
|  | `Alt+Insert` (Windows), `⌘ N` (macOS), `⌃ N` (IntelliJ IDEA Classic (macOS)), `⌘ N` (macOS System Shortcuts), `Alt+Insert` (XWin), `Alt+Insert` (GNOME), `Alt+Insert` (KDE), `Alt+Insert` (Emacs), `Ctrl+N` (Sublime Text), `⌘ N` (Sublime Text (macOS)), `Alt+Insert` (NetBeans), `Ctrl+N` (Visual Studio), `⌘ N` (Visual Studio (macOS)), `Alt+Insert` (Eclipse), `⌘ N` (Eclipse (macOS)) | Create a run/debug configuration. |
|  | `Alt+Delete` (Windows), `⌘ ⌦` (macOS), `⌘ ⌦` (IntelliJ IDEA Classic (macOS)), `⌘ ⌦` (macOS System Shortcuts), `Alt+Delete` (XWin), `Alt+Delete` (GNOME), `Alt+Delete` (KDE), `Alt+Delete` (Emacs), `Alt+Delete` (Sublime Text), `⌘ ⌦` (Sublime Text (macOS)), `Alt+Delete` (NetBeans), `Ctrl+R, D` (Visual Studio), `⌘ R, D` (Visual Studio (macOS)), `Alt+Delete` (Eclipse), `Alt+Delete` (Eclipse (macOS)) | Delete the selected run/debug configuration. Note that you cannot delete default configurations. |
|  | `Ctrl+D` (Windows), `⌘ D` (macOS), `⌘ D` (IntelliJ IDEA Classic (macOS)), `⌘ D` (macOS System Shortcuts), `Ctrl+D` (XWin), `Ctrl+D` (GNOME), `Ctrl+D` (KDE), `Meta+D` (Emacs), `Ctrl+Shift+D` (Sublime Text), `⌘ ⇧ D` (Sublime Text (macOS)), `Ctrl+D` (NetBeans), `Ctrl+D` (Visual Studio), `⌘ D` (Visual Studio (macOS)), `Ctrl+D` (Eclipse), `Ctrl+D` (Eclipse (macOS)) | Create a copy of the selected run/debug configuration. Note that you create copies of default configurations. |
|  | | The button is displayed only when you select a [temporary configuration](run-debug-configuration.html). Click this button to save a temporary configuration as permanent. |
|  | | Move into new folder / Create new folder. You can group run/debug configurations by [placing them into folders](run-debug-configuration.html#config-folders). To create a folder, select the configurations within a category, click , and specify the folder name. If only a category is in focus, an empty folder is created. Then, to move a configuration into a folder, between the folders or out of a folder, use drag or  and  buttons. To remove grouping, select a folder and click . |
|  | | Click this button to sort configurations in the alphabetical order. |
### Before launch
In this area, you can specify tasks to be performed before starting the selected run/debug configuration. The tasks are performed in the order they appear in the list.
| Item | Shortcut | Description |
| --- | --- | --- |
|  | `Alt+Insert` (Windows), `⌘ N` (macOS), `⌃ N` (IntelliJ IDEA Classic (macOS)), `⌘ N` (macOS System Shortcuts), `Alt+Insert` (XWin), `Alt+Insert` (GNOME), `Alt+Insert` (KDE), `Alt+Insert` (Emacs), `Ctrl+N` (Sublime Text), `⌘ N` (Sublime Text (macOS)), `Alt+Insert` (NetBeans), `Ctrl+N` (Visual Studio), `⌘ N` (Visual Studio (macOS)), `Alt+Insert` (Eclipse), `⌘ N` (Eclipse (macOS)) | Click this icon to add one of the following available tasks: * Launch Web Browser: select this option to have a browser started. In the dialog that opens, select the type of the browser and provide the start URL. Also, specify if you want the browser be launched with JavaScript debugger. * Run External tool: select to run an external application. In the dialog that opens, select one or multiple applications you want to run. If it is not defined in IntelliJ IDEA yet, add its definition. For more information, refer to [External tools](configuring-third-party-tools.html) and [External tools settings](settings-tools-external-tools.html). * Run Another Configuration: select to execute another run/debug configuration and wait until it finishes before starting the current configuration. If you want to run several configurations in parallel, use a [compound run/debug configuration](run-debug-multiple.html#compound-configs) . * Build: select to compile the specified module. The [Build Module command](compiling-applications.html#compile_module) will be executed. If an error occurs during compilation, IntelliJ IDEA won't attempt to start the run/debug configuration. * Build Project: select to compile the entire project. The [Build Project command](compiling-applications.html#compile_module) will be executed. If an error occurs during compilation, IntelliJ IDEA won't attempt to start the run/debug configuration. * Build, no error check: the same as the Build option, but IntelliJ IDEA will try to start the run/debug configuration irrespective of the compilation results. * Build Artifacts: select this option to build an [artifact](working-with-artifacts.html) or artifacts. In the dialog that opens, select the artifact or artifacts that should be built. * Run Remote External tool: adds a [remote SSH external tool](settings-tools-remote-ssh-external-tools.html). * Run Grunt task: select this option to run a Grunt task. In the Grunt task dialog that opens, specify the `Gruntfile.js` where the required task is defined, select the task to execute, and specify the arguments to pass to the Grunt tool. Specify the location of the Node.js runtime, the parameters to pass to it, and the path to the grunt-cli package. * Run Gulp task: select this option to run a Gulp task. In the Gulp task dialog that opens, specify the `Gulpfile.js` where the required task is defined, select the task to execute, and specify the arguments to pass to the Gulp tool. Specify the location of the Node.js runtime, the parameters to pass to it, and the path to the gulp package. * Run Maven Goal: select this option to [run a Maven goal](work-with-maven-goals.html). In the dialog that opens, select the goal to be run. * Run npm Script: select this option to execute an npm script. In the NPM Script dialog that opens, specify the [npm run/debug configuration settings](installing-and-removing-external-software-using-node-package-manager.html). * Compile TypeScript: select to run the built-in TypeScript compiler and thus make sure that all the changes you made to your TypeScript code are reflected in the generated JavaScript files. In the TypeScript Compile Settings dialog that opens, select or clear the Check errors checkbox to configure the behaviour of the compiler in case any errors are detected: * If the Check errors checkbox is selected, the compiler will show all the errors and the run configuration will not start. * If the Check errors checkbox is cleared, the compiler will show all the detected errors but the run configuration still will be launched. * Generate CoffeeScript Source Maps: select this option to generate the source maps for your [CoffeeScript](coffeescript.html) sources. In the dialog that opens, specify where your CoffeeScript source files are located. * Run Rake task: add a [Rake task](null) to be executed prior to running or debugging. To choose a Rake task, click the browse button , and select the desired task from the list of available tasks. Note that [code completion](auto-completing-code.html) is available here. 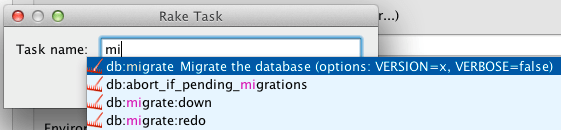 * Run JRuby compiler: choose this option to execute JRuby compiler with the specified target path, compiler process heap size, and command line parameters (if any). |
|  | `Alt+Delete` (Windows), `⌘ ⌦` (macOS), `⌘ ⌦` (IntelliJ IDEA Classic (macOS)), `⌘ ⌦` (macOS System Shortcuts), `Alt+Delete` (XWin), `Alt+Delete` (GNOME), `Alt+Delete` (KDE), `Alt+Delete` (Emacs), `Alt+Delete` (Sublime Text), `⌘ ⌦` (Sublime Text (macOS)), `Alt+Delete` (NetBeans), `Ctrl+R, D` (Visual Studio), `⌘ R, D` (Visual Studio (macOS)), `Alt+Delete` (Eclipse), `Alt+Delete` (Eclipse (macOS)) | Click this icon to remove the selected task from the list. |
|  | `Enter` (Windows), `⏎` (macOS), `⏎` (IntelliJ IDEA Classic (macOS)), `⏎` (macOS System Shortcuts), `Enter` (XWin), `Enter` (GNOME), `Enter` (KDE), `Enter` (Emacs), `Enter` (Sublime Text), `⏎` (Sublime Text (macOS)), `Enter` (NetBeans), `Enter` (Visual Studio), `⏎` (Visual Studio (macOS)), `Enter` (Eclipse), `⏎` (Eclipse (macOS)) | Click this icon to edit the selected task. Make the necessary changes in the dialog that opens. |
|   | `Alt+Up` (Windows), `⌃ ⇧ ↑` (macOS), `⌃ ↑` (IntelliJ IDEA Classic (macOS)), `⌃ ⌥ ↑` (macOS System Shortcuts), `Alt+Up` (XWin), `Alt+Up` (GNOME), `Alt+Up` (KDE), `Alt+Up` (Emacs), `Alt+Up` (Sublime Text), `Alt+Up` (Sublime Text (macOS)), `Ctrl+Alt+Up` (NetBeans), `Alt+Up` (Visual Studio), `⌃ ⇧ ↑` (Visual Studio (macOS)), `Ctrl+Shift+Up` (Eclipse), `⌃ ⌥ ↑` (Eclipse (macOS)) `Alt+Down` (Windows), `⌃ ⇧ ↓` (macOS), `⌃ ↓` (IntelliJ IDEA Classic (macOS)), `⌃ ⌥ ↓` (macOS System Shortcuts), `Alt+Down` (XWin), `Alt+Down` (GNOME), `Alt+Down` (KDE), `Alt+Down` (Emacs), `Alt+Down` (Sublime Text), `Alt+Down` (Sublime Text (macOS)), `Ctrl+Alt+Down` (NetBeans), `Alt+Down` (Visual Studio), `⌃ ⇧ ↓` (Visual Studio (macOS)), `Ctrl+Shift+Down` (Eclipse), `⌃ ⌥ ↓` (Eclipse (macOS)) | Click these icons to move the selected task one line up or down in the list. The tasks are performed in the order that they appear in the list. |
| Show this page | | Select this checkbox to show the run/debug configuration settings prior to actually starting the run/debug configuration. |
| Activate tool window | | By default this checkbox is selected and the [Run](run-tool-window.html) or the [Debug](debug-tool-window.html) tool window opens when you start the run/debug configuration. Otherwise, if the checkbox is cleared, the tool window is hidden. However, when the configuration is running, you can open the corresponding tool window for it yourself by pressing `Alt+4` (Windows), `⌘ 4` (macOS), `⌘ 4` (IntelliJ IDEA Classic (macOS)), `⌘ 4` (macOS System Shortcuts), `Alt+4` (XWin), `Alt+4` (GNOME), `Alt+4` (KDE), `Alt+4` (Emacs), `Alt+4` (Sublime Text), `⌘ 4` (Sublime Text (macOS)), `Alt+4` (NetBeans), `Alt+4` (Visual Studio), `⌘ 4` (Visual Studio (macOS)), `Alt+4` (Eclipse), `⌘ 4` (Eclipse (macOS)) or `Alt+5` (Windows), `⌘ 5` (macOS), `⌘ 5` (IntelliJ IDEA Classic (macOS)), `⌘ 5` (macOS System Shortcuts), `Alt+5` (XWin), `Alt+5` (GNOME), `Alt+5` (KDE), `Alt+5` (Emacs), `Alt+5` (Sublime Text), `⌘ 5` (Sublime Text (macOS)), `Alt+5` (NetBeans), `Alt+5` (Visual Studio), `⌘ 5` (Visual Studio (macOS)), `Alt+5` (Eclipse), `⌘ 5` (Eclipse (macOS)). |
## Browser / Live Edit tab
Use the controls in this tab if you want the run/debug configuration to launch an application in the development mode and at the same time start a debugging session. Learn more from [Run and debug an Angular application with a single npm run/debug configuration](run-and-debug-angular-applications.html#angular_debug_two_rc), [Run and debug a Vue.js application with a single npm run/debug configuration](vue-js.html#vue_debug_two_rc), and [Run and debug a Vite application with a single npm run/debug configuration](vite.html#vite_debug_two_rc).
Here you can also enable IntelliJ IDEA to open the application in the browser.
| Item | Description |
| --- | --- |
| Open browser | In this area, enable the application to open in the browser. * After launch - select this checkbox to open the application on startup. From the list, select the browser to open the application in. > **Note:** > If you are going to debug the application, select [Google Chrome](http://www.google.com/chrome/) or another [Chromium-based browser](https://www.chromium.org/). * URL - in this field, specify the URL address at which the application wil run. * with JavaScript debugger - select this checkbox to start a debugging session at the same time as the application is launched in the development mode. |
## See also
### Procedures
[Run applications](running-applications.html) [Debug code](debugging-code.html)
### Reference
[Run/Debug Configuration: Attach to Node.js/Chrome](run-debug-configuration-node-js-remote-debug.html)