# Run/debug configuration: sbt Task
> **TL;DR**
> Required plugin: Scala: [how to install](get-started-with-scala.html#scala_plugin)
The sbt Task run configuration provides a reusable setup for running Scala sbt project tasks. It stores the commands to run, whether to use the sbt shell, JVM options, environment variables, and any pre-launch steps, such as building the project first.
Procedure: Create a new configuration for sbt
1. In the main menu, go to `Run | Edit Configurations`.
2. In the Run/Debug Configuration dialog, click  on the toolbar or press `Alt+Insert` (Windows), `⌘ N` (macOS), `⌃ N` (IntelliJ IDEA Classic (macOS)), `⌘ N` (macOS System Shortcuts), `Alt+Insert` (XWin), `Alt+Insert` (GNOME), `Alt+Insert` (KDE), `Alt+Insert` (Emacs), `Alt+Insert` (Sublime Text), `⌘ N` (Sublime Text (macOS)), `Alt+Insert` (NetBeans), `Alt+Insert` (Visual Studio), `⌘ ⌃ N` (Visual Studio (macOS)), `Alt+Insert` (Eclipse), `⌘ N` (Eclipse (macOS)).
The list shows the run/debug configuration templates. Select sbt Task on the left.
On the right, you will see configuration options.
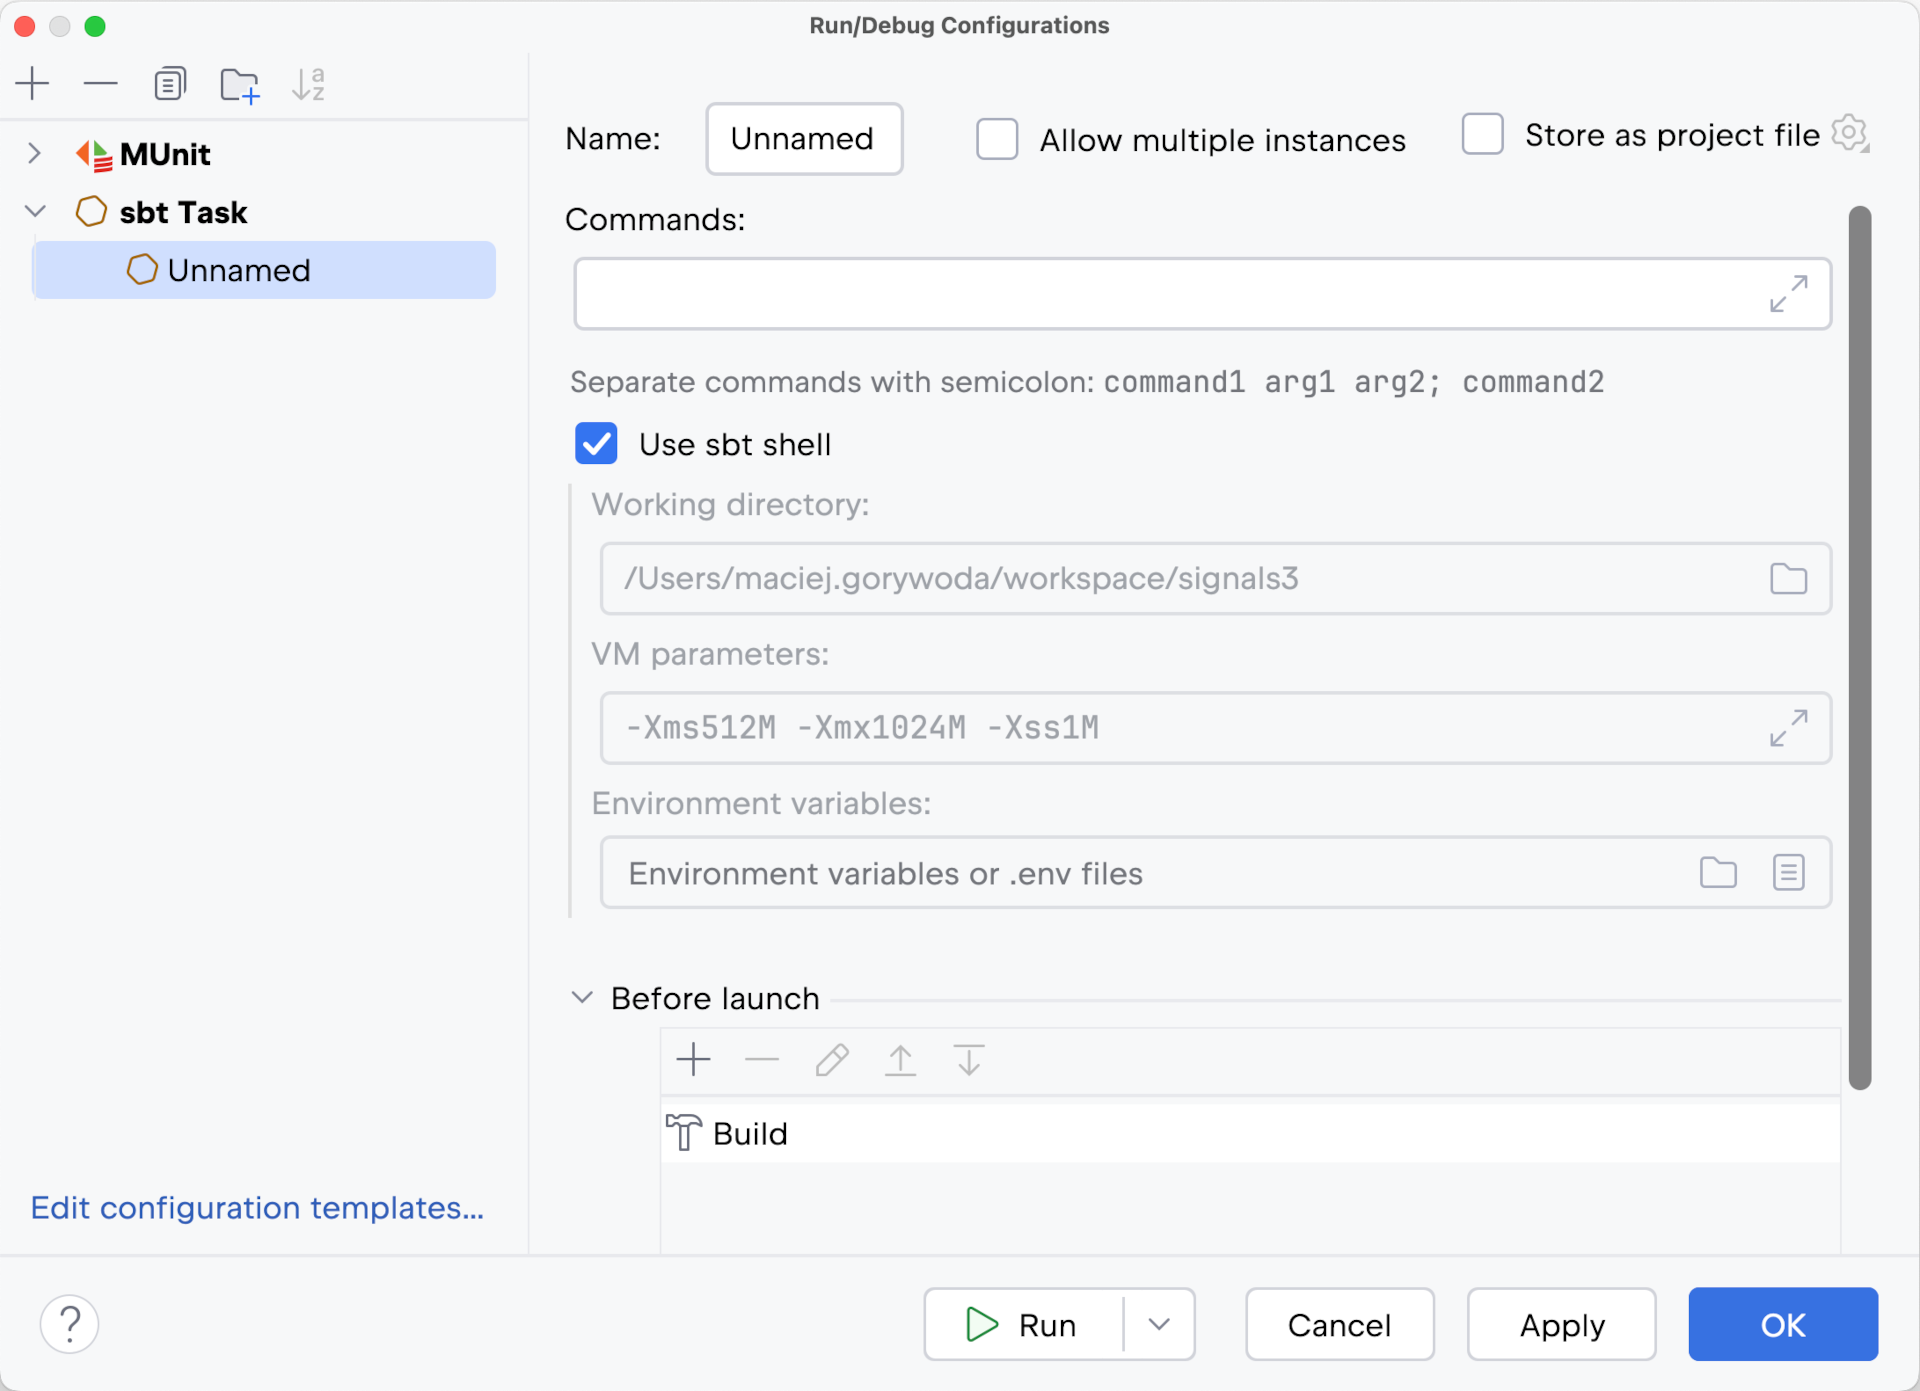
## sbt Task settings
| Item | Description |
| --- | --- |
| Commands | Specify an sbt [command](https://www.scala-sbt.org/1.x/docs/Command-Line-Reference.html). |
| Use sbt shell | Delegate build actions to an sbt shell or server instance instead of the built-in compiler. The build is considered successful only if the sbt build completes successfully and reports no errors. |
| Working directory | Specify the directory that will act as the current directory when running the test. It will act as the root directory for all relative input and output paths. By default, the directory where the project file resides is used as a working directory. Type directory name, or click  and select the desired directory in the dialog that opens. |
| VM options | Specify the options to be passed to the Java virtual machine when launching the application, for example, `-mx`, `-verbose`, and so on. When specifying JVM options, follow these rules: * Use spaces to separate individual options. * If the value of an option includes spaces, enclose either the value or the actual spaces with double quotes. * If an option includes double quotes as part of the value, escape the double quotes using backslashes. * You can pass environment variable values to custom Java properties. ```PLAINTEXT -Xmx1024m -Dspaces="some arg" -Dmy.prop=\"quoted_value\" -Dfoo=${MY_ENV_VAR} ``` Use code completion in this field: start typing the name of a flag, and the IDE suggests a list of available command line options. This works for `-XX:` and `-X` options and some standard options that are not configured by IntelliJ IDEA automatically, like `-ea`, but not for `-cp` or `–release`. The `-classpath` option specified in this field overrides the classpath of the module. |
| Environment variables | Click  to open the Environment Variables dialog where you can create variables and specify their values. |
## Common settings
When you edit a run configuration (but not a run configuration template), you can specify the following options:
| Item | Description |
| --- | --- |
| Name | Specify a name for the run configuration to quickly identify it among others when editing or running. |
| Allow multiple instances | Allow running multiple instances of this run configuration in parallel. By default, it is disabled, and when you start this configuration while another instance is still running, IntelliJ IDEA suggests stopping the running instance and starting another one. This is helpful when a run configuration consumes a lot of resources and there is no good reason to run multiple instances. |
| Store as project file | Save the file with the run configuration settings to share it with other team members. The default location is `.idea/runConfigurations`. However, if you do not want to share the `.idea` directory, you can save the configuration to any other directory within the project. By default, it is disabled, and IntelliJ IDEA stores run configuration settings in `.idea/workspace.xml`. |
## Before launch
In this area, you can specify tasks to be performed before starting the selected run/debug configuration. The tasks are performed in the order they appear in the list.
| Item | Shortcut | Description |
| --- | --- | --- |
|  | `Alt+Insert` (Windows), `⌘ N` (macOS), `⌃ N` (IntelliJ IDEA Classic (macOS)), `⌘ N` (macOS System Shortcuts), `Alt+Insert` (XWin), `Alt+Insert` (GNOME), `Alt+Insert` (KDE), `Alt+Insert` (Emacs), `Ctrl+N` (Sublime Text), `⌘ N` (Sublime Text (macOS)), `Alt+Insert` (NetBeans), `Ctrl+N` (Visual Studio), `⌘ N` (Visual Studio (macOS)), `Alt+Insert` (Eclipse), `⌘ N` (Eclipse (macOS)) | Click this icon to add one of the following available tasks: * Launch Web Browser: select this option to have a browser started. In the dialog that opens, select the type of the browser and provide the start URL. Also, specify if you want the browser to be launched with the JavaScript debugger. * Run External tool: select to run an external application. In the dialog that opens, select one or multiple applications you want to run. If it is not defined in IntelliJ IDEA yet, add its definition. For more information, refer to [External tools](configuring-third-party-tools.html) and [External tools settings](settings-tools-external-tools.html). * Run Another Configuration: select to execute another run/debug configuration and wait until it finishes before starting the current configuration. If you want to run several configurations in parallel, use a [compound run/debug configuration](run-debug-multiple.html#compound-configs) . * Build: select to compile the specified module. The [Build Module command](compiling-applications.html#compile_module) will be executed. If an error occurs during compilation, IntelliJ IDEA won't attempt to start the run/debug configuration. * Build Project: select to compile the entire project. The [Build Project command](compiling-applications.html#compile_module) will be executed. If an error occurs during compilation, IntelliJ IDEA won't attempt to start the run/debug configuration. * Build, no error check: the same as the Build option, but IntelliJ IDEA will try to start the run/debug configuration irrespective of the compilation results. * Build Artifacts: select this option to build an [artifact](working-with-artifacts.html) or artifacts. In the dialog that opens, select the artifact or artifacts that should be built. * Run Remote External Tool: adds a [remote SSH external tool](settings-tools-remote-ssh-external-tools.html). * Run Grunt task: select this option to run a Grunt task. In the Grunt task dialog that opens, specify the `Gruntfile.js` where the required task is defined, select the task to execute, and specify the arguments to pass to the Grunt tool. Specify the location of the Node.js runtime, the parameters to pass to it, and the path to the grunt-cli package. * Run gulp task: select this option to run a Gulp task. In the Gulp task dialog that opens, specify the `Gulpfile.js` where the required task is defined, select the task to execute, and specify the arguments to pass to the Gulp tool. Specify the location of the Node.js runtime, the parameters to pass to it, and the path to the gulp package. * Run Maven Goal: select this option to [run a Maven goal](work-with-maven-goals.html). In the dialog that opens, select the goal to be run. * Run npm script: select this option to execute an npm script. In the NPM Script dialog that opens, specify the [npm run/debug configuration settings](installing-and-removing-external-software-using-node-package-manager.html). * Compile TypeScript: select to run the built-in TypeScript compiler and thus make sure that all the changes you made to your TypeScript code are reflected in the generated JavaScript files. In the TypeScript Compile Settings dialog that opens, select or clear the Check errors checkbox to configure the behaviour of the compiler in case any errors are detected: * If the Check errors checkbox is selected, the compiler will show all the errors and the run configuration will not start. * If the Check errors checkbox is cleared, the compiler will show all the detected errors but the run configuration still will be launched. * Disconnect Data Source: select this option if you want to disrupt the connection to a data source before the run/debug configuration is run. |
|  | `Alt+Delete` (Windows), `⌘ ⌦` (macOS), `⌘ ⌦` (IntelliJ IDEA Classic (macOS)), `⌘ ⌦` (macOS System Shortcuts), `Alt+Delete` (XWin), `Alt+Delete` (GNOME), `Alt+Delete` (KDE), `Alt+Delete` (Emacs), `Alt+Delete` (Sublime Text), `⌘ ⌦` (Sublime Text (macOS)), `Alt+Delete` (NetBeans), `Ctrl+R, D` (Visual Studio), `⌘ R, D` (Visual Studio (macOS)), `Alt+Delete` (Eclipse), `Alt+Delete` (Eclipse (macOS)) | Click this icon to remove the selected task from the list. |
|  | `Enter` (Windows), `⏎` (macOS), `⏎` (IntelliJ IDEA Classic (macOS)), `⏎` (macOS System Shortcuts), `Enter` (XWin), `Enter` (GNOME), `Enter` (KDE), `Enter` (Emacs), `Enter` (Sublime Text), `⏎` (Sublime Text (macOS)), `Enter` (NetBeans), `Enter` (Visual Studio), `⏎` (Visual Studio (macOS)), `Enter` (Eclipse), `⏎` (Eclipse (macOS)) | Click this icon to edit the selected task. Make the necessary changes in the dialog that opens. |
|   | `Alt+Up` (Windows), `⌃ ⇧ ↑` (macOS), `⌃ ↑` (IntelliJ IDEA Classic (macOS)), `⌃ ⌥ ↑` (macOS System Shortcuts), `Alt+Up` (XWin), `Alt+Up` (GNOME), `Alt+Up` (KDE), `Alt+Up` (Emacs), `Alt+Up` (Sublime Text), `Alt+Up` (Sublime Text (macOS)), `Ctrl+Alt+Up` (NetBeans), `Alt+Up` (Visual Studio), `⌃ ⇧ ↑` (Visual Studio (macOS)), `Ctrl+Shift+Up` (Eclipse), `⌃ ⌥ ↑` (Eclipse (macOS)) `Alt+Down` (Windows), `⌃ ⇧ ↓` (macOS), `⌃ ↓` (IntelliJ IDEA Classic (macOS)), `⌃ ⌥ ↓` (macOS System Shortcuts), `Alt+Down` (XWin), `Alt+Down` (GNOME), `Alt+Down` (KDE), `Alt+Down` (Emacs), `Alt+Down` (Sublime Text), `Alt+Down` (Sublime Text (macOS)), `Ctrl+Alt+Down` (NetBeans), `Alt+Down` (Visual Studio), `⌃ ⇧ ↓` (Visual Studio (macOS)), `Ctrl+Shift+Down` (Eclipse), `⌃ ⌥ ↓` (Eclipse (macOS)) | Click these icons to move the selected task one line up or down in the list. The tasks are performed in the order that they appear in the list. |
| Show this page | | Select this checkbox to show the run/debug configuration settings prior to actually starting the run/debug configuration. |
| Activate tool window | | By default this checkbox is selected and the [Run](run-tool-window.html) or the [Debug](debug-tool-window.html) tool window opens when you start the run/debug configuration. Otherwise, if the checkbox is cleared, the tool window is hidden. However, when the configuration is running, you can open the corresponding tool window for it yourself by pressing `Alt+4` (Windows), `⌘ 4` (macOS), `⌘ 4` (IntelliJ IDEA Classic (macOS)), `⌘ 4` (macOS System Shortcuts), `Alt+4` (XWin), `Alt+4` (GNOME), `Alt+4` (KDE), `Alt+4` (Emacs), `Alt+4` (Sublime Text), `⌘ 4` (Sublime Text (macOS)), `Alt+4` (NetBeans), `Alt+4` (Visual Studio), `⌘ 4` (Visual Studio (macOS)), `Alt+4` (Eclipse), `⌘ 4` (Eclipse (macOS)) or `Alt+5` (Windows), `⌘ 5` (macOS), `⌘ 5` (IntelliJ IDEA Classic (macOS)), `⌘ 5` (macOS System Shortcuts), `Alt+5` (XWin), `Alt+5` (GNOME), `Alt+5` (KDE), `Alt+5` (Emacs), `Alt+5` (Sublime Text), `⌘ 5` (Sublime Text (macOS)), `Alt+5` (NetBeans), `Alt+5` (Visual Studio), `⌘ 5` (Visual Studio (macOS)), `Alt+5` (Eclipse), `⌘ 5` (Eclipse (macOS)). |
| Focus tool window | | Select this checkbox to automatically move focus to the [Run](run-tool-window.html) or the [Debug](debug-tool-window.html) tool window when you start the run/debug configuration. |
## Logs
The following options are related to logging the execution of this configuration. For more information, refer to [Logs](setting-log-options.html).
| Item | Description |
| --- | --- |
| Specify logs to be shown in the console | Specify which log files to display while running the application. Click  to add a new log. In the Edit Log Files Aliases dialog, configure the following: * Alias: The name of the tab where the log will be displayed. * Log File Location: Specify the path to the log file or an [Ant pattern](https://ant.apache.org/manual/dirtasks.html). If several files of a rolling log match the pattern, IntelliJ IDEA will display the most recent one. * Show all files coverable by pattern: Show all logs that match the pattern. For logs in the table, you can configure the following options: * Is Active: Display the specified log file. * Skip Content: Do not display old log messages from previous runs. |
| Save console output to file | Save the console output to the specified location. Type the path manually or click the browse button and point to the desired location in the [dialog that opens](null). |
| Show console when a message is printed to stdout | Activate the console when the application writes to the standard output stream. |
| Show console when a message is printed to stderr | Activate the console when the application writes to the standard error stream. |
For more details about how to debug a Scala application, see [Run, debug, and test Scala projects](run-debug-and-test-scala.html).