# Run applications
> **TL;DR**
> Run a class with a `main()` method: `Shift+F10` (Windows), `⌃ R` (macOS), `⇧ F10` (IntelliJ IDEA Classic (macOS)), `⌥ ⇧ R` (macOS System Shortcuts), `Shift+F10` (XWin), `Shift+F10` (GNOME), `Shift+F10` (KDE), `Shift+F10` (Emacs), `Shift+F10` (Sublime Text), `Shift+F10` (Sublime Text (macOS)), `F6` (NetBeans), `Ctrl+F5` (Visual Studio), `⌃ F5` (Visual Studio (macOS)), `Alt+Shift+X` (Eclipse), `⌘ ⇧ F11` (Eclipse (macOS))
You can run applications right from IntelliJ IDEA if you have an [SDK set up](sdk.html) for your [project](creating-and-managing-projects.html) /[module](creating-and-managing-modules.html).
## Quick way
Procedure: Run from the editor
If you are not going to pass any parameters to your program, and your program does not require any specific actions to be performed before start, you can run it right from the editor.
> **Note:**
> The class that you are going to execute must contain a `main()` method with a valid signature, for example: `public static void main(String[] args)`.
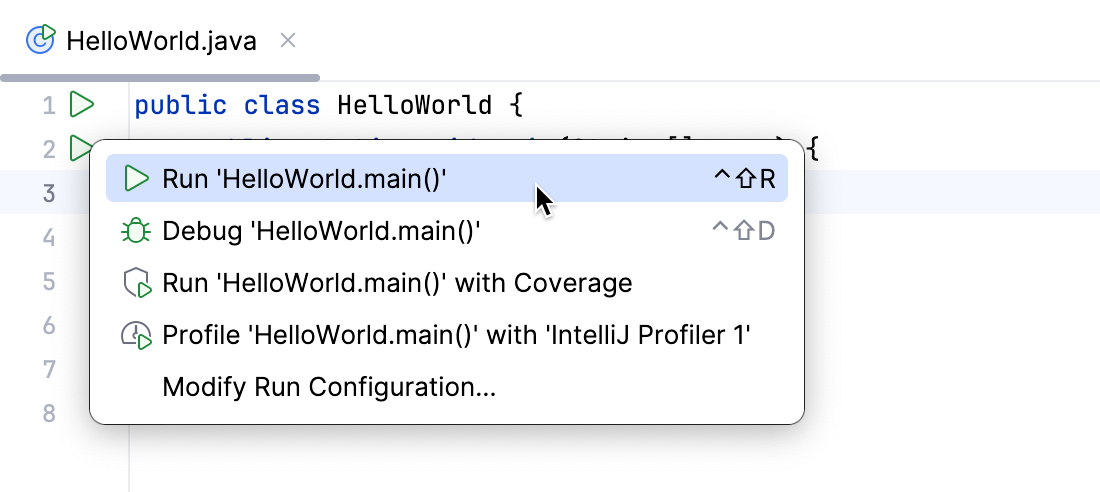
* Click  in the [gutter](guided-tour-around-the-user-interface.html) near the class declaration and select Run.
Procedure: Run the current file
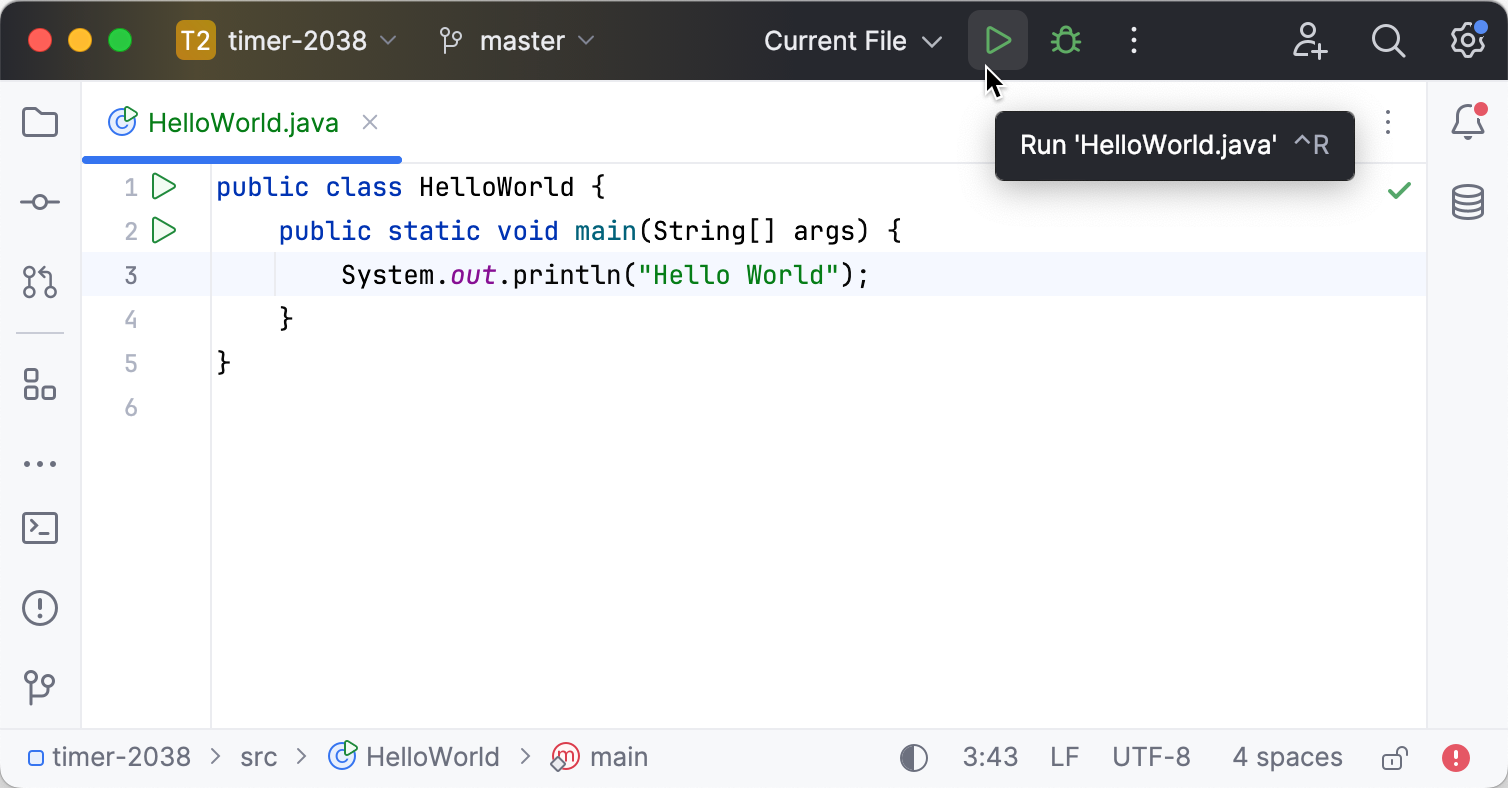
You can run single files using a dedicated option on the toolbar. The run and debug buttons are active and allow you to instantly run the currently opened file.
1. In the editor, open the file that you want to run.
2. Click  next to the Current File option on the toolbar.
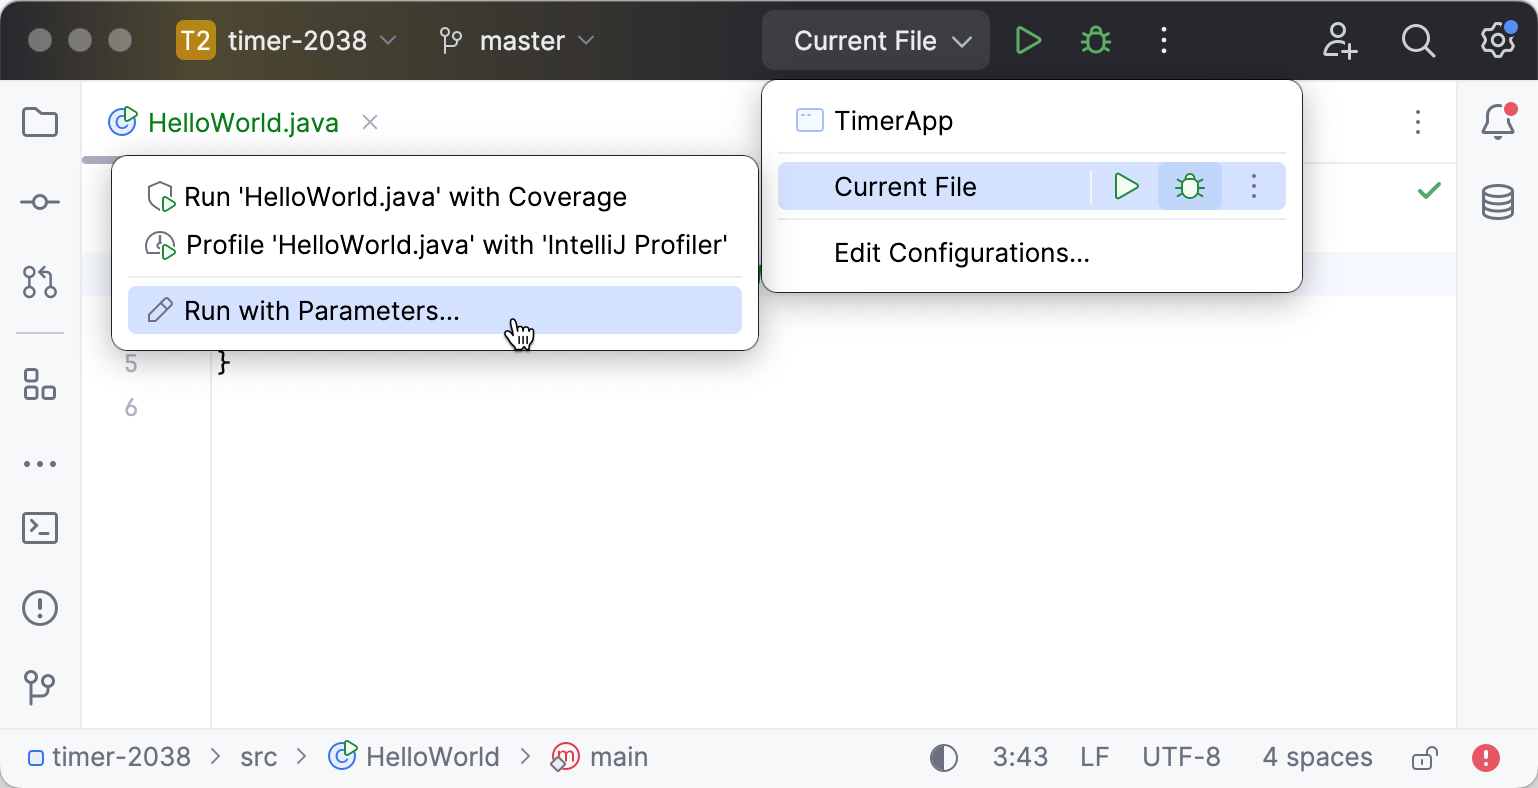
You can access the other run modes by expanding the list. From the widget that opens, you can debug the code, run it with coverage, profile it, or open the run configuration to specify more options.
## Customizable way
Procedure:
1. Click  in the [gutter](guided-tour-around-the-user-interface.html) near the class declaration and select Modify Run Configuration.
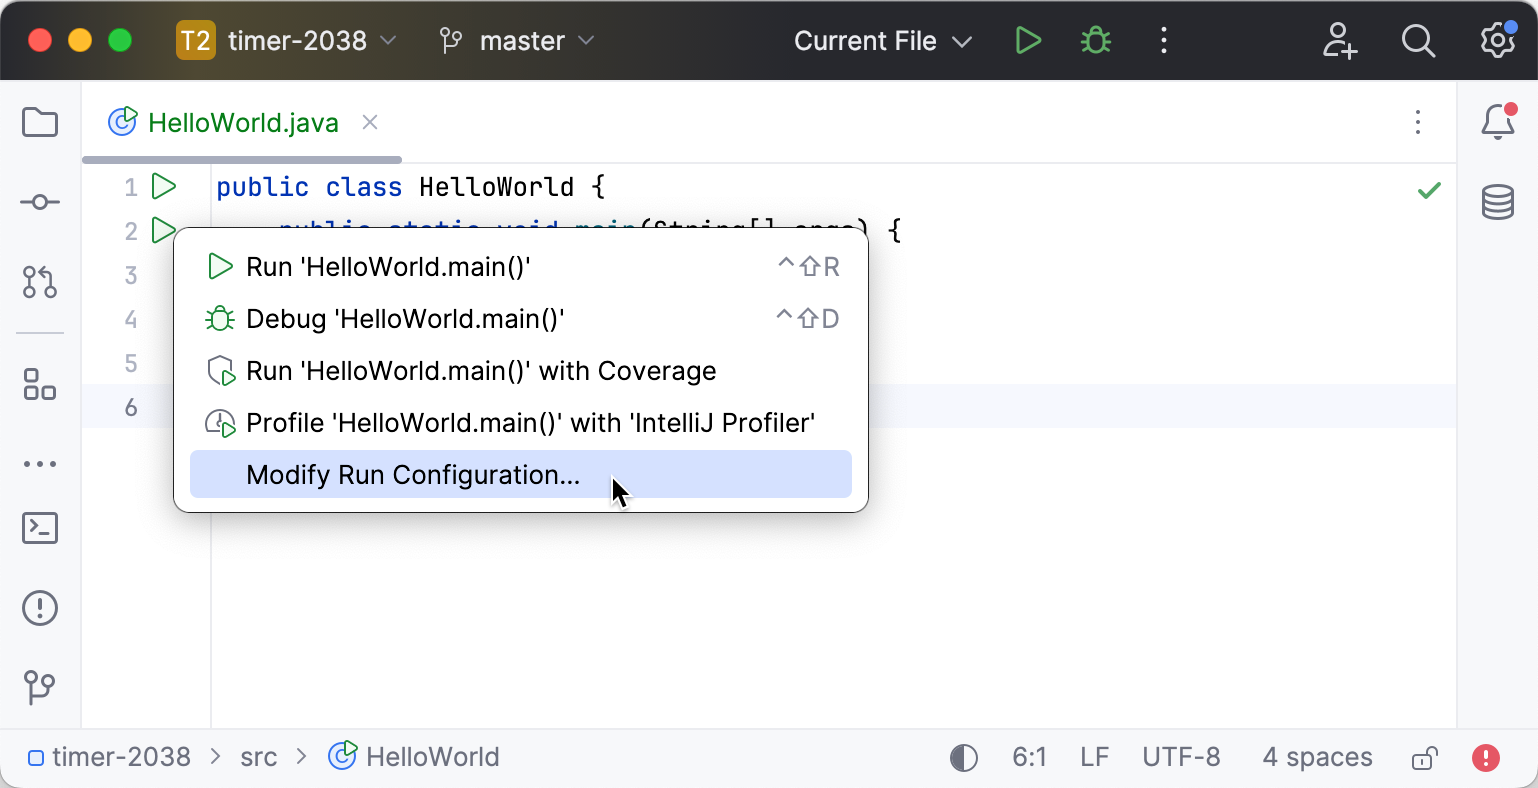
2. Modify the run/debug configuration as needed. For example, if you need to run your program with arguments, add the arguments to the Program arguments field.
To access additional parameters, click Modify options and select the required option from the menu.
> **Tip:**
> To quickly access the fields only using a keyboard, hold `Alt` (Windows), `Alt` (macOS), `Alt` (IntelliJ IDEA Classic (macOS)), `Alt` (macOS System Shortcuts), `Alt` (XWin), `Alt` (GNOME), `Alt` (KDE), `Alt` (Emacs), `Alt` (Sublime Text), `Alt` (Sublime Text (macOS)), `Alt` (NetBeans), `Alt` (Visual Studio), `Alt` (Visual Studio (macOS)), `Alt` (Eclipse), `Alt` (Eclipse (macOS)) and use the shortcut according to the hints that appear.
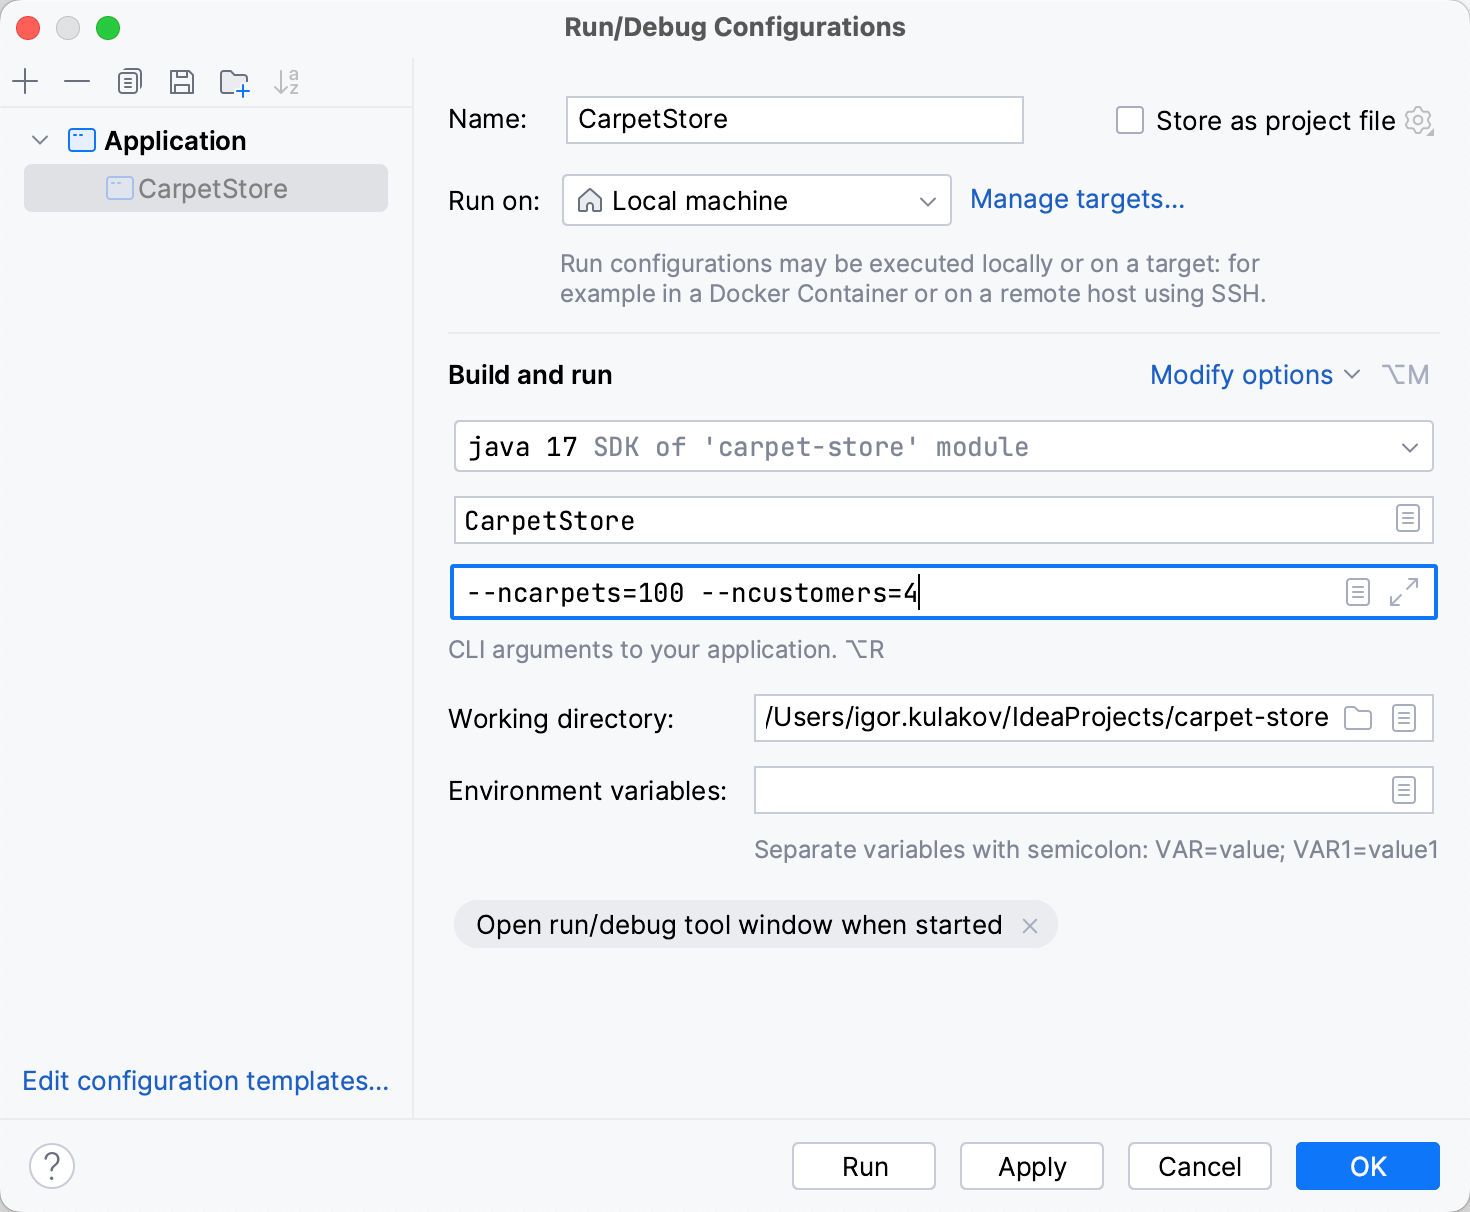
3. Click OK to save the run configuration for later, or Run to save and run it right-away.
### Launch a run configuration
Procedure:
You can launch existing run configurations in one of the following ways:
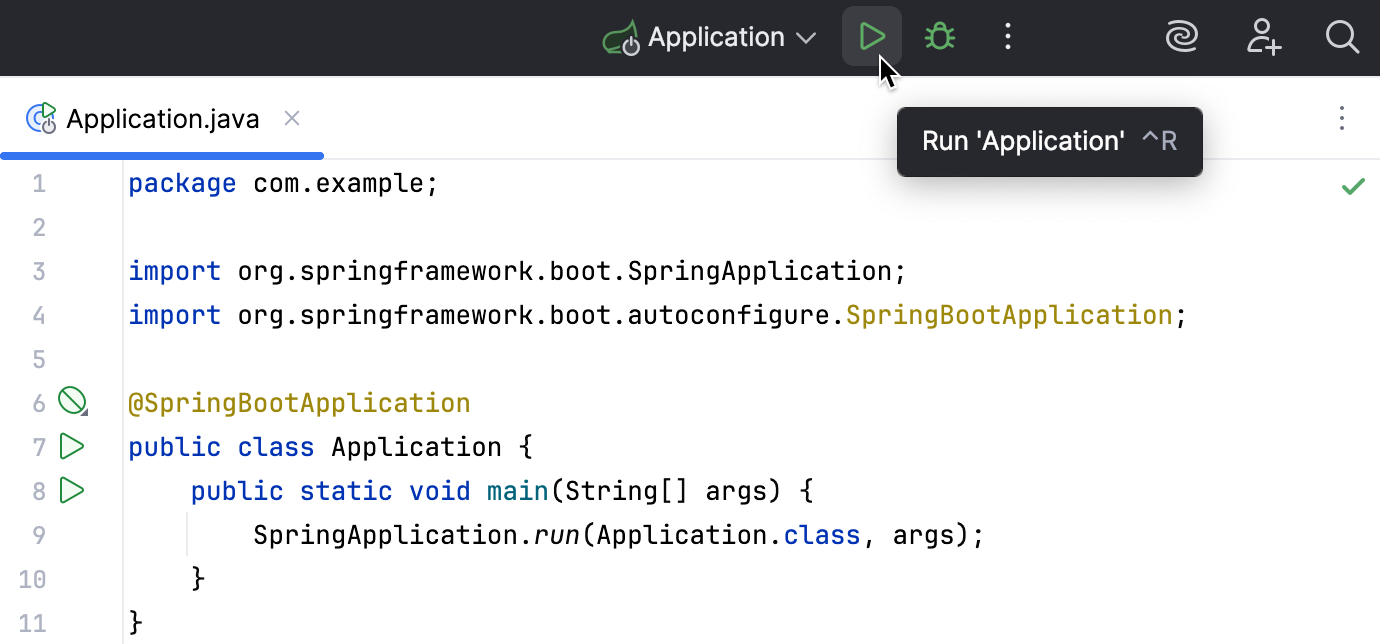
* If the run configuration is already selected in the [Run widget](guided-tour-around-the-user-interface.html#toolbar) , click  next to it or press `Shift+F10` (Windows), `⌃ R` (macOS), `⇧ F10` (IntelliJ IDEA Classic (macOS)), `⌥ ⇧ R` (macOS System Shortcuts), `Shift+F10` (XWin), `Shift+F10` (GNOME), `Shift+F10` (KDE), `Shift+F10` (Emacs), `Shift+F10` (Sublime Text), `Shift+F10` (Sublime Text (macOS)), `F6` (NetBeans), `Ctrl+F5` (Visual Studio), `⌃ F5` (Visual Studio (macOS)), `Alt+Shift+X` (Eclipse), `⌘ ⇧ F11` (Eclipse (macOS)).
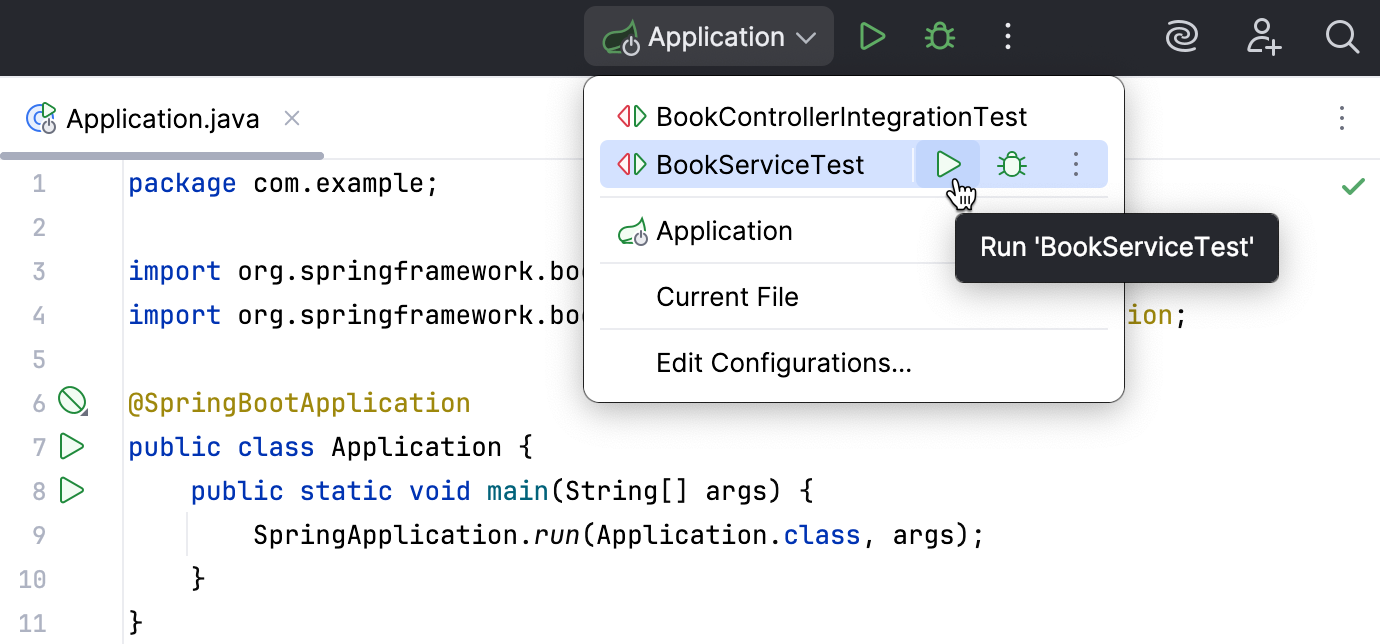
* If you want to select another run configuration, click the [Run widget](guided-tour-around-the-user-interface.html#toolbar) . In the menu that opens, click  next to the run configuration you want to launch.
* Press `Alt+Shift+F10` (Windows), `⌃ ⌥ R` (macOS), `⌥ ⇧ F10` (IntelliJ IDEA Classic (macOS)), `⌃ ⌥ R` (macOS System Shortcuts), `Alt+Shift+F10` (XWin), `Alt+Shift+F10` (GNOME), `Alt+Shift+F10` (KDE), `Alt+Shift+F10` (Emacs), `Alt+Shift+F10` (Sublime Text), `⌃ ⌥ R` (Sublime Text (macOS)), `Alt+Shift+F10` (NetBeans), `Ctrl+Alt+Shift+R` (Visual Studio), `⌘ ⌥ ⇧ R` (Visual Studio (macOS)), `Alt+Shift+F10` (Eclipse), `⌃ ⌥ R` (Eclipse (macOS)). In the menu that opens, click the run configuration you want to launch.
> **Note:**
> For running applications using build tools, refer to [Run anything](running-anything.html) and [Compile and build applications with IntelliJ IDEA](compiling-applications.html).
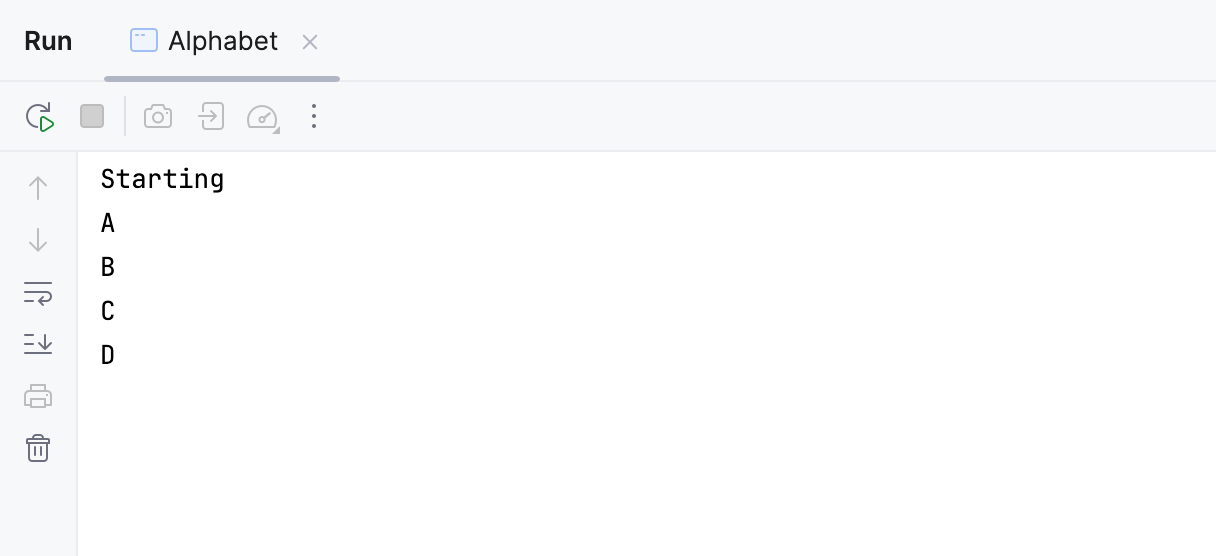
When the application starts, you can view its output and interact with it in the Run tool window. Every [run/debug configuration](run-debug-configuration.html) creates a separate tab when you run it.
> **Tip:**
> Use the `Ctrl+F` (Windows), `⌘ F` (macOS), `⌘ F` (IntelliJ IDEA Classic (macOS)), `⌘ F` (macOS System Shortcuts), `Ctrl+F` (XWin), `Ctrl+F` (GNOME), `Ctrl+F` (KDE), `Ctrl+Alt+S` (Emacs), `Ctrl+F` (Sublime Text), `⌘ F` (Sublime Text (macOS)), `Ctrl+F` (NetBeans), `Ctrl+F` (Visual Studio), `⌘ F` (Visual Studio (macOS)), `Ctrl+F` (Eclipse), `Ctrl+F` (Eclipse (macOS)) shortcut to search for text occurrences in the console output.
For more information about tool windows and how to manage them, see the [Tool windows](tool-windows.html) topic.
## Re-run applications
Procedure:
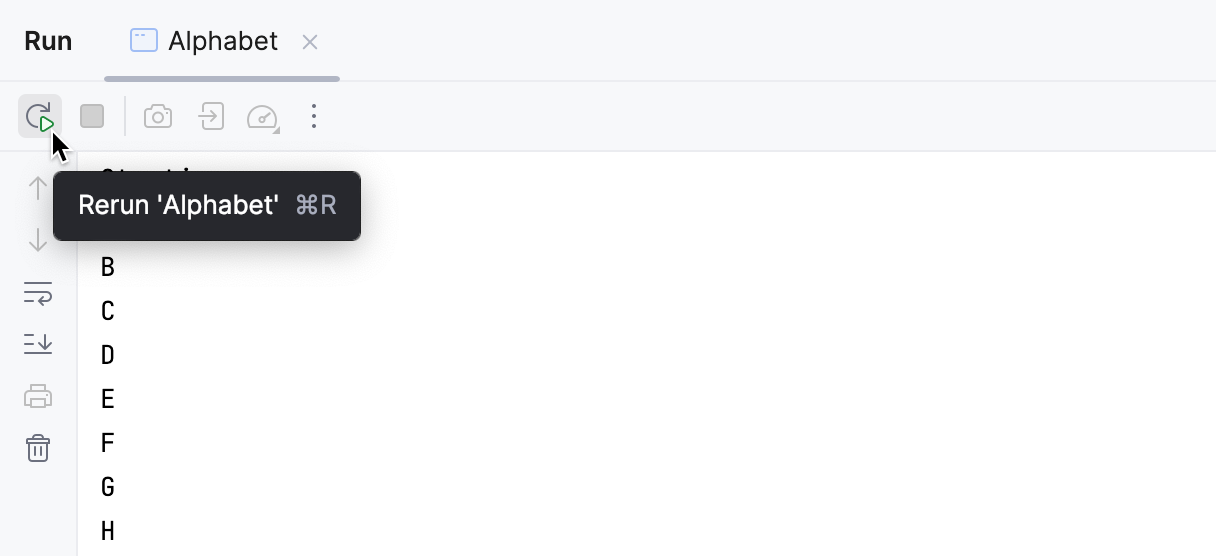
* On the toolbar of the Run tool window, click  Rerun or press `Shift+F10` (Windows), `⌃ R` (macOS), `⇧ F10` (IntelliJ IDEA Classic (macOS)), `⌥ ⇧ R` (macOS System Shortcuts), `Shift+F10` (XWin), `Shift+F10` (GNOME), `Shift+F10` (KDE), `Shift+F10` (Emacs), `Shift+F10` (Sublime Text), `Shift+F10` (Sublime Text (macOS)), `F6` (NetBeans), `Ctrl+F5` (Visual Studio), `⌃ F5` (Visual Studio (macOS)), `Alt+Shift+X` (Eclipse), `⌘ ⇧ F11` (Eclipse (macOS)).
> **Tip:**
> If you re-run an application, the output of the previous run is lost. To preserve the output of an application, click the Pin Tab button on the toolbar of the Run tool window. When a tab is pinned, new sessions are opened in another tab.
## Run multiple tasks
Procedure:
* To run or debug multiple tasks simultaneously, open the run widget menu in the toolbar and select the corresponding run/debug configurations while holding down the `Ctrl` (Windows), `Ctrl` (macOS), `Ctrl` (IntelliJ IDEA Classic (macOS)), `Ctrl` (macOS System Shortcuts), `Ctrl` (XWin), `Ctrl` (GNOME), `Ctrl` (KDE), `Ctrl` (Emacs), `Ctrl` (Sublime Text), `Ctrl` (Sublime Text (macOS)), `Ctrl` (NetBeans), `Ctrl` (Visual Studio), `Ctrl` (Visual Studio (macOS)), `Ctrl` (Eclipse), `Ctrl` (Eclipse (macOS)) key.
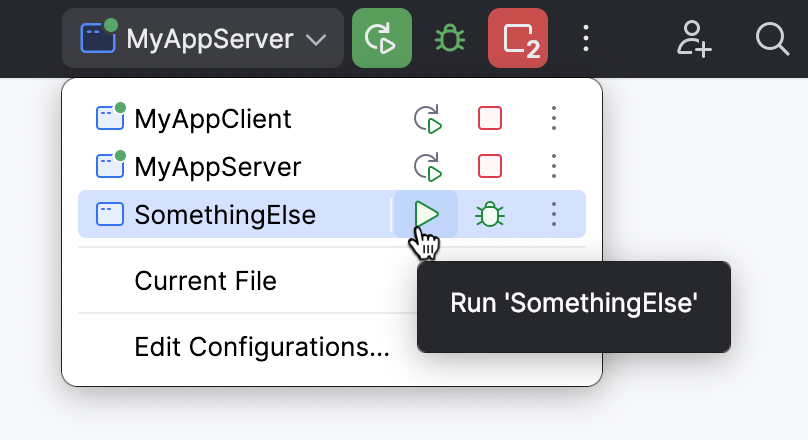
For launching multiple tasks using a single run/debug configuration, refer to [Run compound tasks](run-debug-multiple.html).
## Stop and pause applications
When you stop a program, its process is interrupted and exits immediately. When you pause a program, it continues running in the background, but its output is suspended.
Procedure: Stop a program
* In the Run tool window, click  Stop on the toolbar. Alternatively, press `Ctrl+F2` (Windows), `⌘ F2` (macOS), `⌘ F2` (IntelliJ IDEA Classic (macOS)), `⌃ ⇧ .` (macOS System Shortcuts), `Ctrl+F2` (XWin), `Ctrl+F2` (GNOME), `Ctrl+2` (KDE), `Ctrl+F2` (Emacs), `Ctrl+F2` (Sublime Text), `Ctrl+F2` (Sublime Text (macOS)), `Shift+F5` (NetBeans), `Shift+F5` (Visual Studio), `⇧ F5` (Visual Studio (macOS)), `Ctrl+F2` (Eclipse), `⌘ F2` (Eclipse (macOS)) and select the process to stop.
This performs a forceful termination of the program, meaning that the usual cleanup mechanisms at the operating system, virtual machine, and application levels may be bypassed, possibly preventing the execution of shutdown hooks, proper resource releasing, logging, and so on.
Procedure: Terminate a program gracefully
* In the Run tool window, click  Exit on the toolbar.
Unlike forceful termination, this terminates the program in a graceful way, the same as when it closes normally.
Procedure: Pause the program output
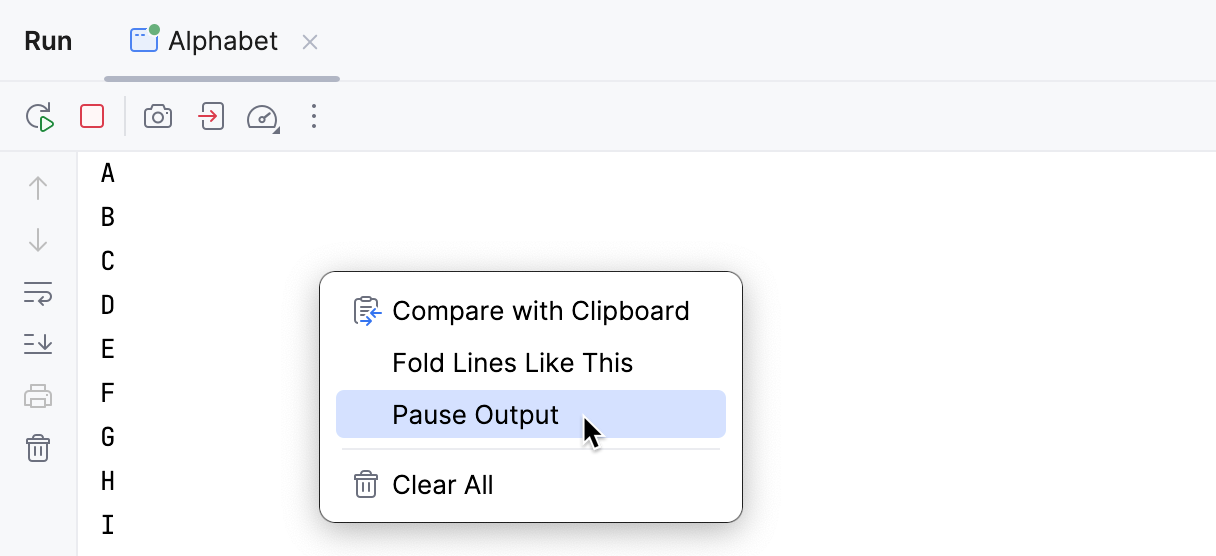
* Right-click in the Run tool window and select Pause Output from the context menu. Use the same toggle to resume the program.
> **Note:**
> Only the output is suspended. Pausing the output does not affect the execution of the program.
## Investigate errors
If there are errors in your program, here is how you can address them.
Procedure:
* If an exception is thrown:
* If the meaning of the exception is unclear, you can navigate to the exception class right from the stack trace and read the documentation for the exception to learn what it means.
* Attach the debugger and examine the program state that led to the failure. See [Tutorial: Debug your first Java application](debugging-your-first-java-application.html) for a quick introduction to IntelliJ IDEA's debugger.
* [Run static analysis](analyzing-data-flow.html) to see where incorrect values might be coming from.
* If a logic error is present, the debugger may save you a lot of time finding and fixing the cause. See [Tutorial: Debug your first Java application](debugging-your-first-java-application.html) for a quick introduction to IntelliJ IDEA's debugger.
* If the problem is related to application performance, [IntelliJ Profiler](profiler-intro.html) will help you analyze the problem and assess the efficiency of a fix.
## Show running processes
You can view the list of all active run or debug sessions and navigate between them.
Procedure:
* Go to Run | Show Running List. In the top-right corner of the editor, IntelliJ IDEA shows a list with all active applications.
## CPU and Memory Live Charts
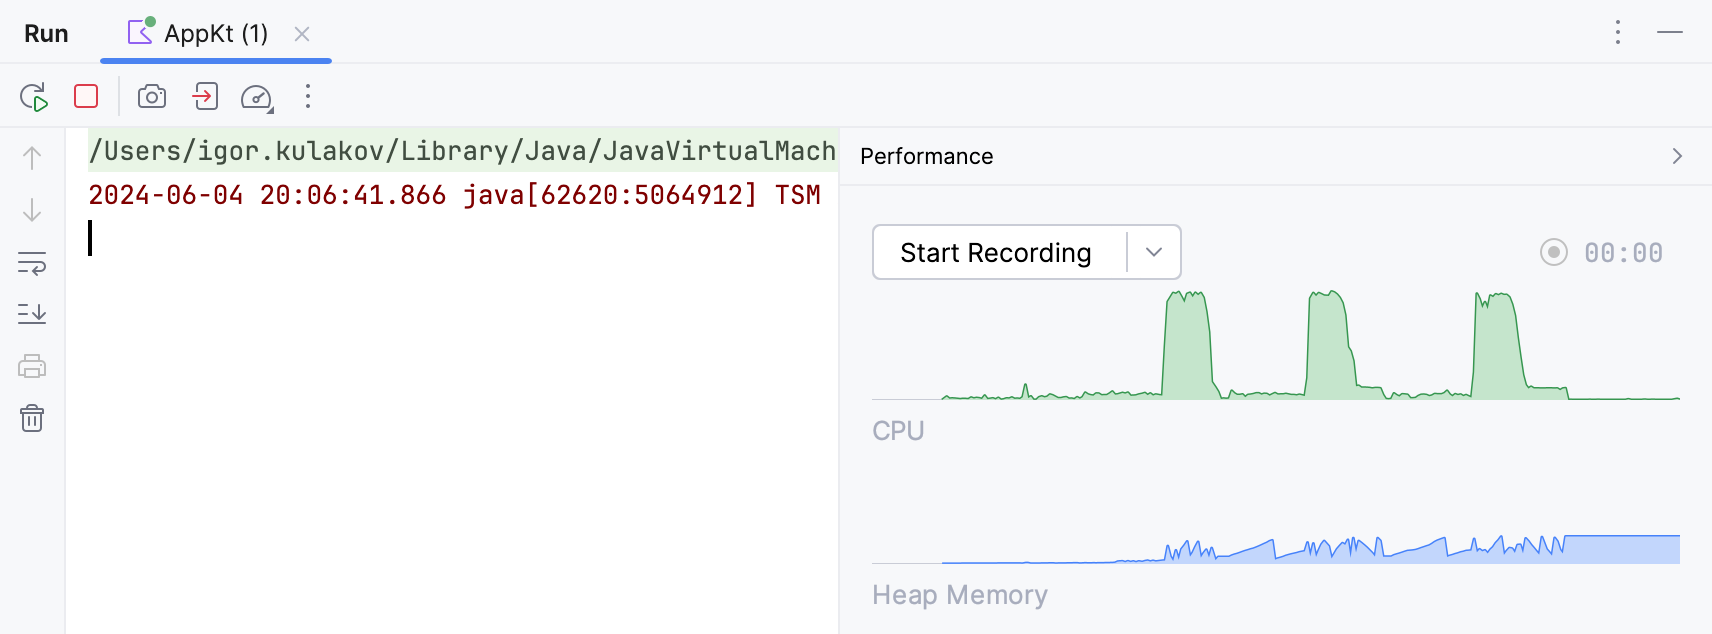
IntelliJ IDEA provides a way to monitor live performance statistics for a running process through CPU and Memory Live Charts.
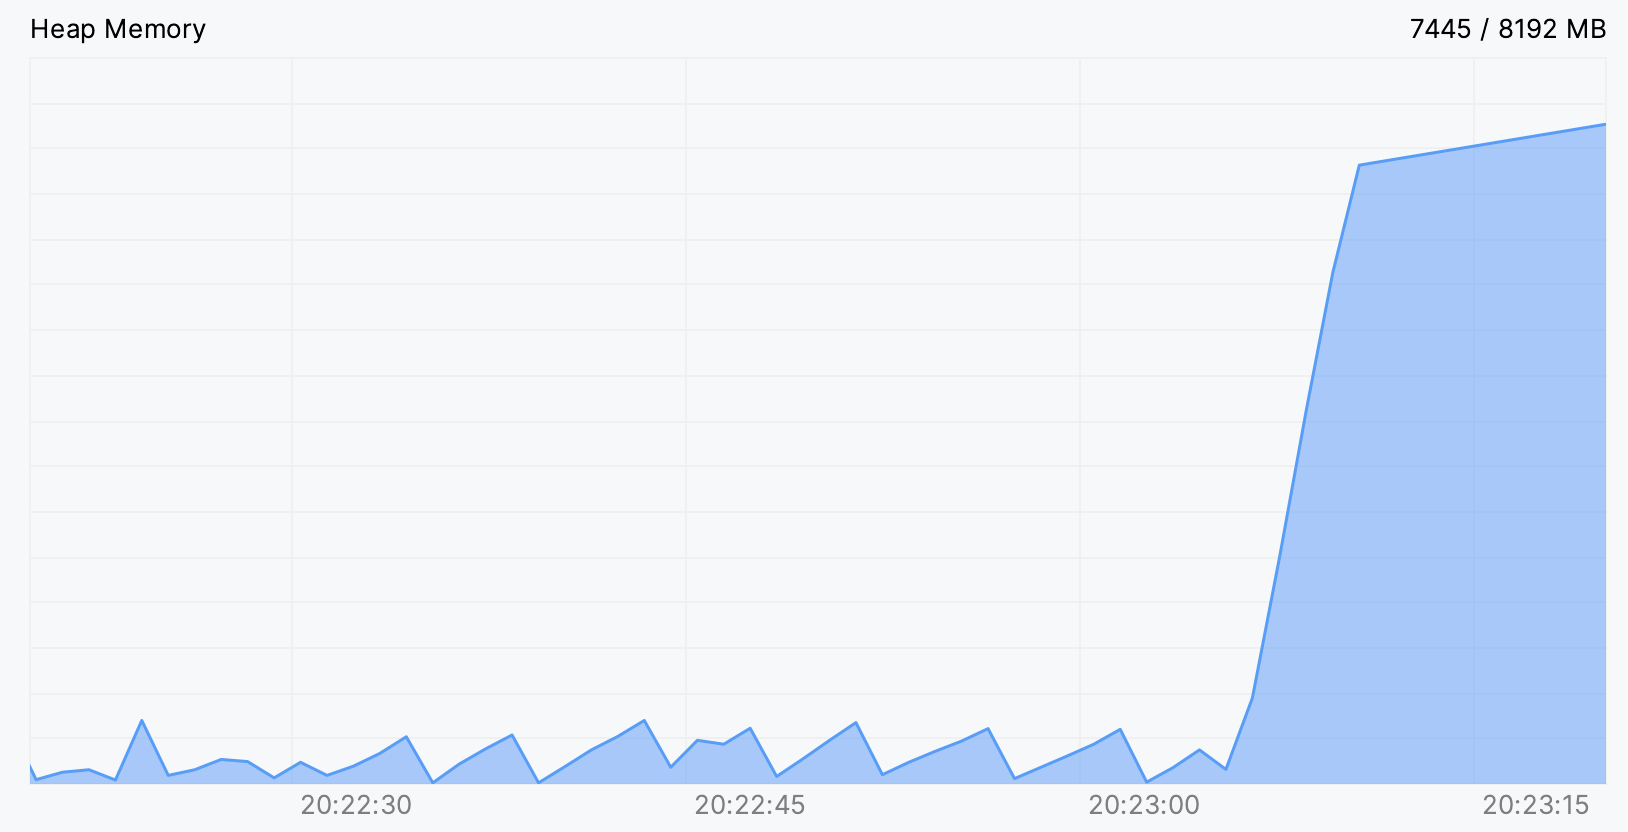
As opposed to viewing static figures, live data may help you to visualize resource consumption, identify resource-related bottlenecks, and understand how certain events affect the program performance.
For example, in the picture below, we can see what a memory leak looks like in the Heap Memory chart. Sometimes it is enough to figure out the cause, and when it is not enough, it can give a clue for further investigation.
CPU and Memory Live Charts are automatically shown for the following [run/debug configurations](run-debug-configuration.html):
* [Application](run-debug-configuration-java-application.html) (Java/Kotlin)
* [JUnit](run-debug-configuration-junit.html), [TestNG](run-debug-configuration-testng.html)
* [Maven](run-debug-configuration-maven.html)
* [JAR](run-debug-configuration-jar.html)
* [Spring Boot](run-debug-configuration-spring-boot.html), [Quarkus](quarkus-run-configuration.html), [Micronaut](micronaut.html), [Ktor](ktor.html)
* [Shell script](run-debug-configuration-shell-script.html)
For more information, refer to [Monitor resources usage](cpu-and-memory-live-charts.html).
## See also
### Concepts
[Run/Debug Configurations](run-debug-configuration.html)
### Reference
[Run tool window](run-tool-window.html)